Home > Analyses > Healthcare > Tempus AI, Inc.
Tempus AI, Inc. revolutionizes cancer care by decoding vast molecular data to tailor treatments precisely. As a pioneer in healthcare information services, Tempus leads with cutting-edge sequencing diagnostics and AI-powered platforms that connect clinicians, researchers, and pharma. Its innovative approach transforms raw data into actionable insights, reshaping oncology outcomes. Yet, with a volatile market backdrop and lofty expectations, I ask: does Tempus’s growth trajectory justify its current valuation?
Table of contents
Business Model & Company Overview
Tempus AI, Inc., founded in 2015 and headquartered in Chicago, IL, stands as a leader in healthcare technology. The company integrates next-generation sequencing diagnostics with advanced molecular pathology testing, creating a cohesive ecosystem that serves healthcare providers, pharma, biotech, and researchers. Its platforms, including Hub and Lens, streamline test management and data analysis, reinforcing its dominant market position in medical information services.
Tempus generates revenue through a balanced mix of diagnostic hardware, proprietary software, and recurring analytical services. Its global footprint spans the Americas, Europe, and Asia, supporting strategic collaborations with AstraZeneca and Pathos AI. This robust economic moat combines cutting-edge data assets with deep industry partnerships, positioning Tempus to shape the future of precision oncology and healthcare innovation.
Financial Performance & Fundamental Metrics
I analyze Tempus AI, Inc.’s income statement, key financial ratios, and dividend payout policy to reveal its underlying financial health and shareholder value creation.
Income Statement
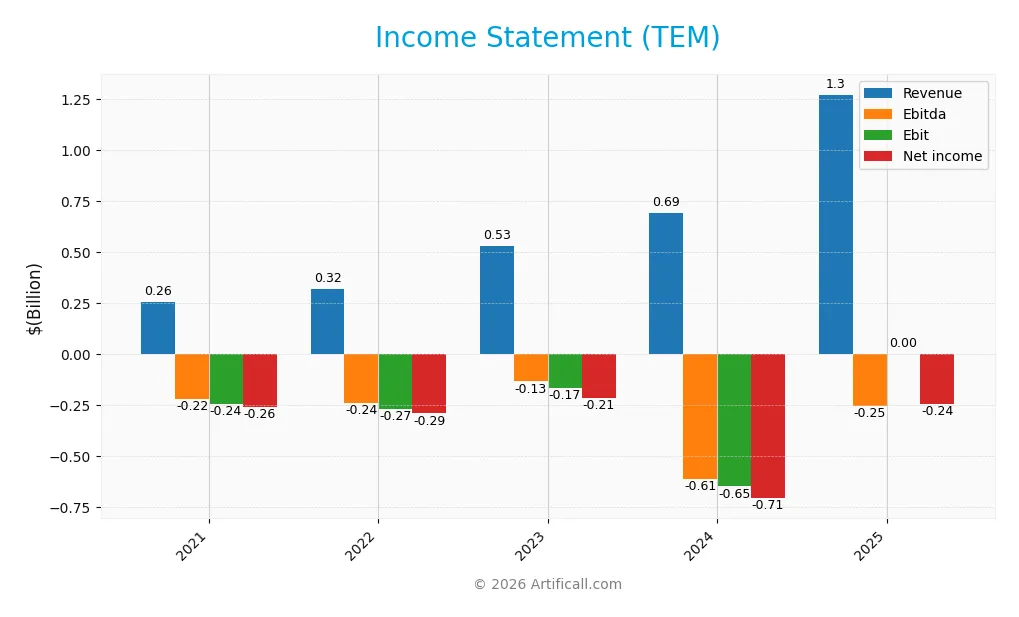
The table below summarizes Tempus AI, Inc.’s income statement figures for fiscal years 2021 through 2025 in USD.
| 2021 | 2022 | 2023 | 2024 | 2025 | |
|---|---|---|---|---|---|
| Revenue | 258M | 321M | 532M | 693M | 1.27B |
| Cost of Revenue | 174M | 190M | 246M | 312M | 386M |
| Operating Expenses | 327M | 396M | 482M | 1.07B | 1.14B |
| Gross Profit | 84M | 130M | 286M | 381M | 886M |
| EBITDA | -220M | -237M | -133M | -610M | -253M |
| EBIT | -243M | -267M | -167M | -648M | 0 |
| Interest Expense | 15M | 22M | 47M | 54M | 70M |
| Net Income | -259M | -290M | -214M | -706M | -245M |
| EPS | -1.75 | -1.97 | -1.73 | -4.60 | -1.41 |
| Filing Date | 2021-12-31 | 2022-12-31 | 2023-12-31 | 2025-02-24 | 2026-02-24 |
Income Statement Evolution
Tempus AI’s revenue soared 393% from 2021 to 2025, with a sharp 83% rise in the latest year. Gross profit more than tripled, lifting gross margins to a robust 69.6%. Despite stable operating expenses growing in line with revenue, net income losses narrowed, improving net margin significantly over the period.
Is the Income Statement Favorable?
In 2025, Tempus AI reported $1.27B revenue with a 69.6% gross margin, signaling strong product profitability. However, operating losses persisted at $253M, reflecting heavy SG&A and other expenses. Interest expense dropped favorably to 5.5% of revenue. Overall fundamentals appear favorable thanks to solid top-line growth and margin expansion, yet net losses remain a caution.
Financial Ratios
The table below summarizes key financial ratios for Tempus AI, Inc. over the past five fiscal years, reflecting profitability, liquidity, leverage, and market valuation:
| Ratios | 2021 | 2022 | 2023 | 2024 | 2025 |
|---|---|---|---|---|---|
| Net Margin | -100.52% | -90.38% | -40.26% | -101.79% | -19.27% |
| ROE | 32.10% | 25.67% | 15.49% | -1252.79% | -49.87% |
| ROIC | -58.45% | -57.27% | -58.04% | -107.73% | -13.20% |
| P/E | -26.38 | -23.59 | -28.98 | -7.75 | -42.00 |
| P/B | -8.47 | -6.06 | -4.49 | 97.15 | 20.94 |
| Current Ratio | 3.52 | 2.52 | 1.51 | 2.29 | 3.13 |
| Quick Ratio | 3.32 | 2.39 | 1.38 | 2.16 | 3.00 |
| D/E | -0.30 | -0.38 | -0.35 | 8.31 | 1.66 |
| Debt-to-Assets | 45.0% | 68.6% | 86.5% | 50.5% | 35.9% |
| Interest Coverage | -16.05 | -12.12 | -4.18 | -12.88 | 3.60 |
| Asset Turnover | 0.49 | 0.51 | 0.94 | 0.75 | 0.56 |
| Fixed Asset Turnover | 7.29 | 4.73 | 6.47 | 9.52 | 8.28 |
| Dividend Yield | 0.08% | 0.08% | 0.09% | 0.10% | 0.00% |
Evolution of Financial Ratios
Tempus AI’s Return on Equity (ROE) declined sharply, reaching -49.87% in 2025, reflecting deteriorating profitability. The Current Ratio improved steadily, rising to 3.13, indicating stronger short-term liquidity. Meanwhile, Debt-to-Equity ratio remained elevated at 1.66, signaling persistent leverage concerns. Overall, profitability weakened despite better liquidity.
Are the Financial Ratios Favorable?
In 2025, profitability ratios like net margin (-19.27%) and ROE (-49.87%) were unfavorable, undermining earnings quality. Liquidity showed mixed signals: a high Current Ratio (3.13) was unfavorable, but Quick Ratio (3.0) was favorable. Leverage remained a red flag with Debt-to-Equity at 1.66 and negative interest coverage. Efficiency ratios like asset turnover (0.56) were neutral, while fixed asset turnover (8.28) was favorable. Market valuations were challenging with a high Price-to-Book ratio (20.94). Overall, the ratio profile is predominantly unfavorable.
Shareholder Return Policy
Tempus AI, Inc. does not pay dividends as of 2025, reflecting its negative net income and reinvestment focus. The company maintains no share buyback programs, consistent with its high-growth and cash flow deficit profile.
This approach prioritizes funding operations and development over immediate shareholder payouts. It aligns with long-term value creation only if future profitability improves, given current losses and absent distributions.
Score analysis
The radar chart below illustrates Tempus AI, Inc.’s key financial scores, providing a snapshot of its valuation and profitability metrics:
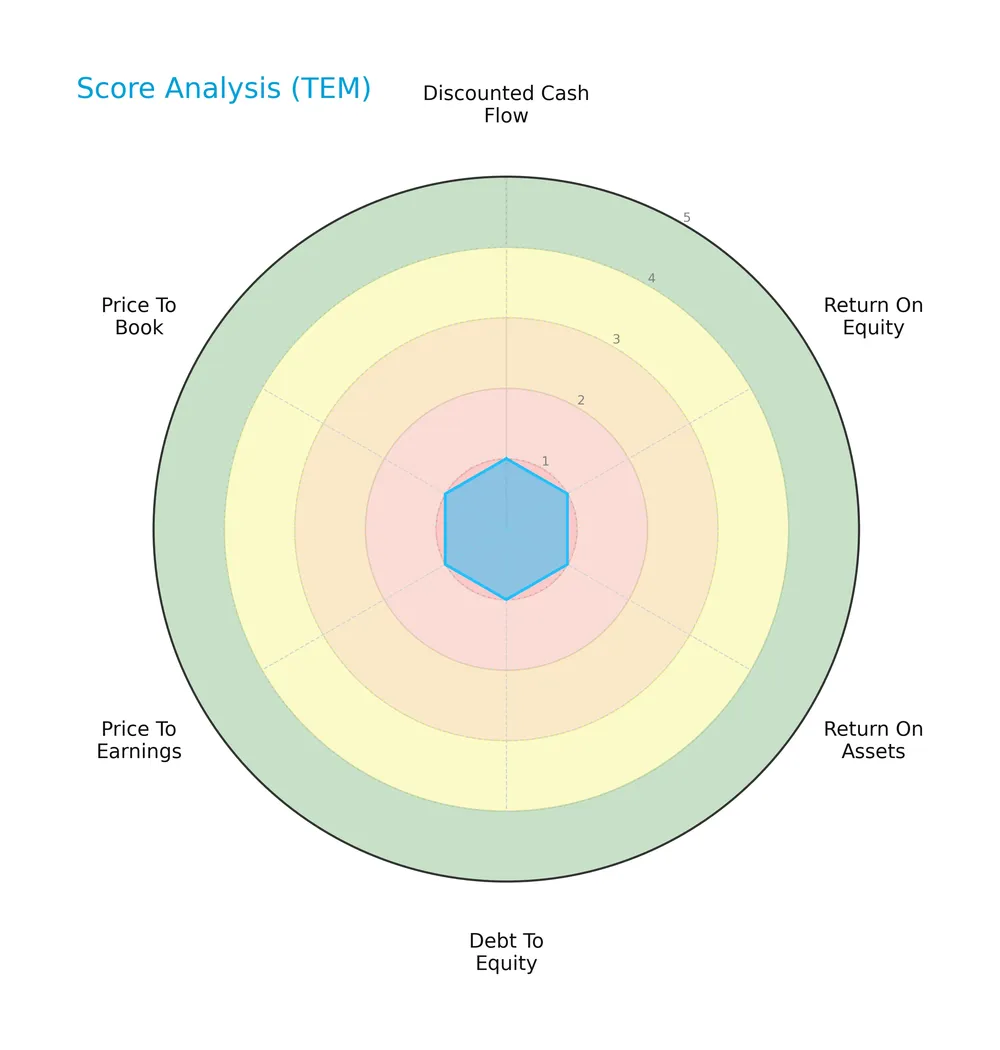
All scores—discounted cash flow, return on equity, return on assets, debt to equity, price to earnings, and price to book—register at the lowest level, indicating uniformly very unfavorable financial metrics across the board.
Analysis of the company’s bankruptcy risk
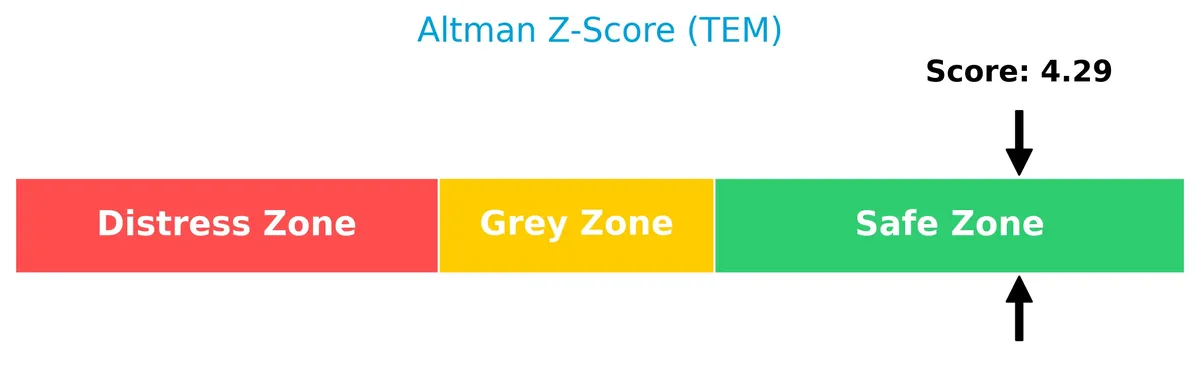
Tempus AI, Inc. shows a strong financial position with an Altman Z-Score well above the distress threshold, placing it confidently in the safe zone:
Is the company in good financial health?
The Piotroski diagram below highlights the company’s financial strength based on nine accounting criteria:
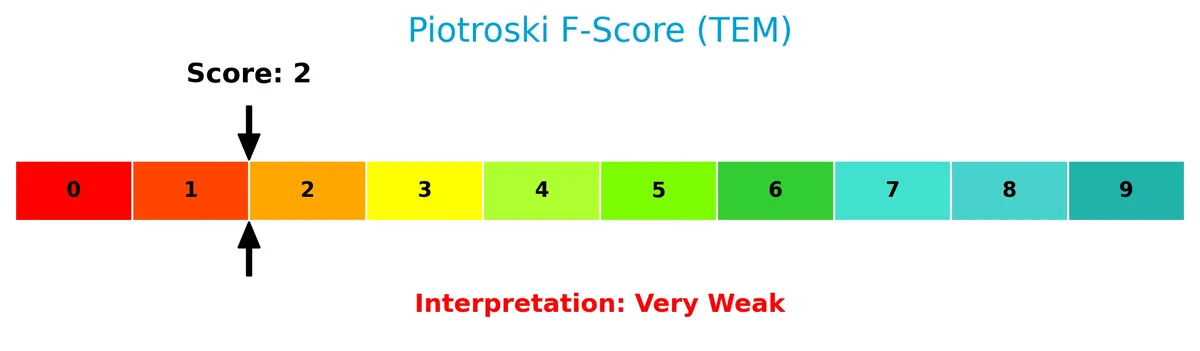
With a Piotroski score of 2, Tempus AI, Inc. falls into the very weak category, signaling significant financial health challenges despite its bankruptcy risk profile.
Competitive Landscape & Sector Positioning
This sector analysis explores Tempus AI, Inc.’s role in healthcare information services, focusing on strategic positioning and revenue segments. I will examine whether Tempus AI holds a competitive advantage over its main industry peers.
Strategic Positioning
Tempus AI, Inc. concentrates its portfolio on healthcare technology, focusing on diagnostics with $955M revenue in 2025. Its offerings span molecular testing, data analytics, and clinical trial services, primarily targeting pharmaceutical, biotech, and healthcare providers in the US market.
Revenue by Segment
The pie chart illustrates Tempus AI, Inc.’s revenue distribution by segment for the full fiscal year 2025.
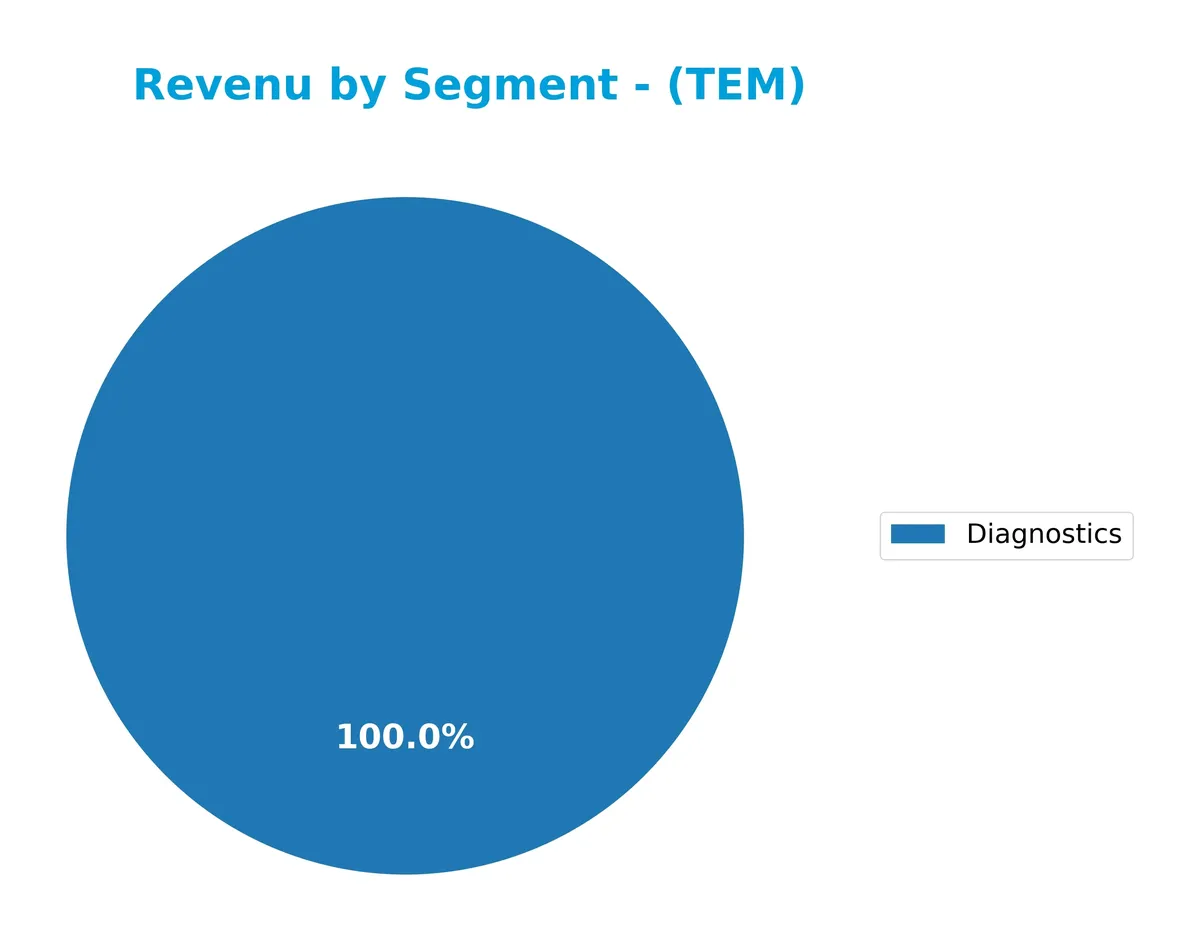
Diagnostics is the sole reported revenue segment, generating 955M USD in 2025. This concentration highlights a dependency on Diagnostics, with no diversification across other segments. The lack of additional revenue streams signals potential concentration risk if market dynamics shift in this area. Investors should monitor the company’s strategy for expanding its product portfolio to mitigate this risk.
Key Products & Brands
Tempus AI, Inc. offers a range of healthcare technology products and platforms focused on diagnostics and data analytics:
| Product | Description |
|---|---|
| Diagnostics | Next generation sequencing, polymerase chain reaction profiling, molecular genotyping, and pathology testing. |
| Insights | License library of linked clinical, molecular, and imaging de-identified data with analytical and cloud tools. |
| Trials | Clinical trial matching services for pharmaceutical companies. |
| Next; Algos | Suite of algorithmic tests specialized in oncology. |
| Hub | Desktop and mobile platform for ordering, managing, and receiving test results. |
| Lens | Platform for researchers to access and analyze Tempus data. |
Tempus AI’s portfolio primarily revolves around advanced diagnostics and data-driven platforms supporting oncology and clinical research. Diagnostics accounted for $955M revenue in 2025, underscoring its core role.
Main Competitors
There are 2 competitors in the Healthcare sector; the table below lists the top 10 leaders by market capitalization:
| Competitor | Market Cap. |
|---|---|
| GE HealthCare Technologies Inc. | 37.8B |
| Tempus AI, Inc. | 10.1B |
Tempus AI, Inc. ranks 2nd among its competitors. It holds about 26.5% of the market cap of the leader, GE HealthCare Technologies Inc. The company’s market cap is below both the average market cap of the top 10 competitors (24B) and the median for the sector. It trails GE HealthCare by a significant margin of +277.6%.
Comparisons with competitors
Check out how we compare the company to its competitors:
Does Tempus AI have a competitive advantage?
Tempus AI operates in healthcare information services but currently destroys value, with ROIC well below WACC despite growing profitability. Its 70%+ gross margin reflects strong operational leverage, yet negative net margins highlight ongoing challenges.
Looking ahead, Tempus AI pursues growth through innovative platforms and strategic oncology collaborations, expanding clinical trial matching and molecular diagnostics. These initiatives may unlock new opportunities in data-driven healthcare markets.
SWOT Analysis
This SWOT analysis highlights Tempus AI, Inc.’s key strategic factors to guide investment decisions.
Strengths
- strong revenue growth of 83% in 2025
- favorable gross margin at 69.6%
- strategic collaborations with AstraZeneca and Pathos AI
Weaknesses
- negative net margin at -19.3%
- unfavorable ROIC at -13.2% below WACC
- very weak Piotroski score of 2
Opportunities
- expanding clinical trial matching services
- growing demand for AI-driven healthcare diagnostics
- increasing use of molecular and genomic data analytics
Threats
- high beta of 5.23 indicates volatile stock
- intense competition in healthcare AI sector
- regulatory risks in healthcare data and diagnostics
Tempus AI shows robust top-line growth and high-margin services but suffers from persistent losses and weak profitability metrics. The company must leverage its technology partnerships and market demand to improve operational efficiency and mitigate volatility risks.
Stock Price Action Analysis
The weekly stock chart of Tempus AI, Inc. (TEM) over the last 12 months reveals significant price movement and volatility:
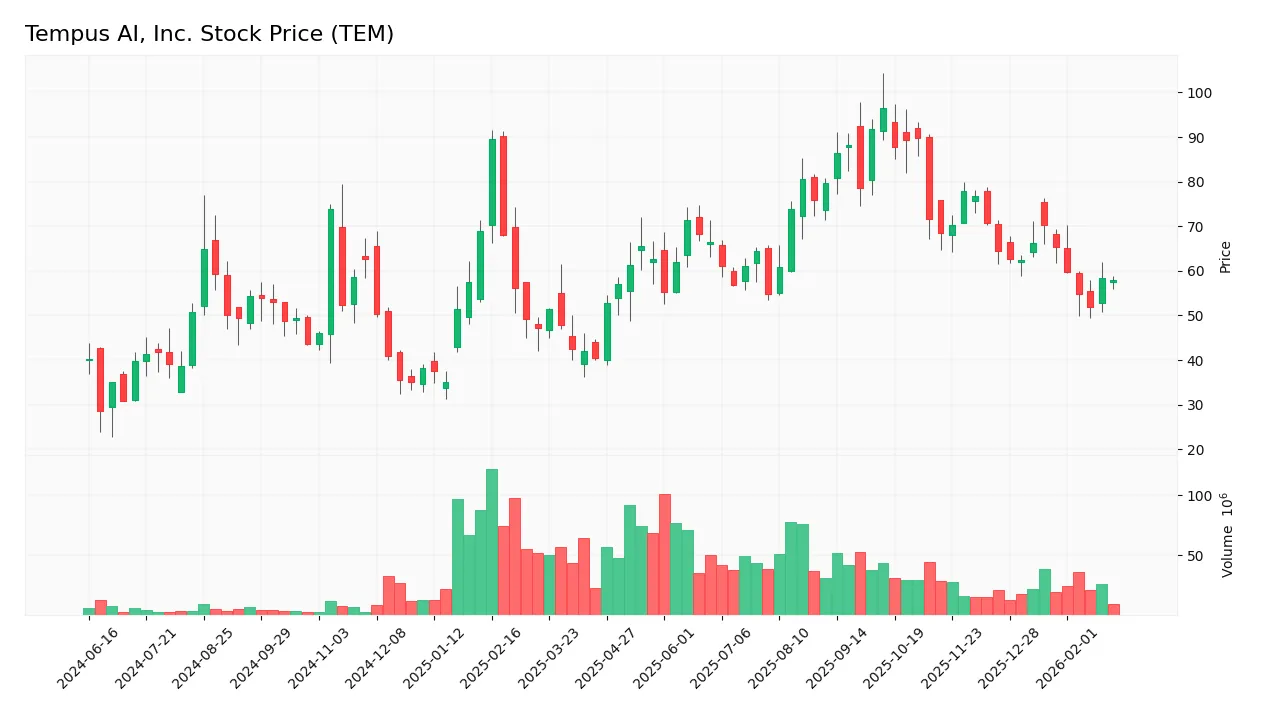
Trend Analysis
Over the past 12 months, TEM’s stock price increased by 44%, indicating a bullish trend. The highest price reached 96.39 and the lowest was 28.64. However, recent months show a deceleration with a 17.9% decline from December 2025 to March 2026. Volatility remains elevated with a 15.5% standard deviation overall.
Volume Analysis
Trading volume has increased overall, with buyers accounting for 53.3% of total volume, suggesting moderate buyer dominance. In the recent period, sellers dominated with only 32.8% buyer volume, indicating a shift toward selling pressure and cautious investor sentiment.
Target Prices
Analysts present a clear target price consensus for Tempus AI, Inc.
| Target Low | Target High | Consensus |
|---|---|---|
| 59 | 105 | 89.88 |
The target range spans from 59 to 105, with a consensus near 90, signaling moderately optimistic analyst expectations.

Don’t Let Luck Decide Your Entry Point
Optimize your entry points with our advanced ProRealTime indicators. You’ll get efficient buy signals with precise price targets for maximum performance. Start outperforming now!
Analyst & Consumer Opinions
This section examines grades and consumer feedback to provide insight into Tempus AI, Inc.’s market perception.
Stock Grades
Below is a summary of recent analyst ratings for Tempus AI, Inc., reflecting current market sentiment and consensus:
| Grading Company | Action | New Grade | Date |
|---|---|---|---|
| Canaccord Genuity | Maintain | Buy | 2025-12-22 |
| JP Morgan | Maintain | Neutral | 2025-12-15 |
| Morgan Stanley | Maintain | Overweight | 2025-12-02 |
| BTIG | Maintain | Buy | 2025-11-25 |
| Piper Sandler | Maintain | Neutral | 2025-11-11 |
| Morgan Stanley | Maintain | Overweight | 2025-11-11 |
| HC Wainwright & Co. | Maintain | Buy | 2025-11-07 |
| Needham | Maintain | Buy | 2025-11-05 |
| BTIG | Maintain | Buy | 2025-11-05 |
| Canaccord Genuity | Maintain | Buy | 2025-11-05 |
The overall trend shows a strong preference towards Buy and Overweight ratings, with a few Neutral opinions. No Sell or Strong Sell grades appear, indicating general analyst confidence in the stock.
Consumer Opinions
Tempus AI, Inc. evokes strong reactions from its user base, reflecting its innovative yet evolving technology.
| Positive Reviews | Negative Reviews |
|---|---|
| “Tempus AI’s data accuracy has transformed our research workflows.” | “The platform’s learning curve is steep and time-consuming.” |
| “Customer support is responsive and knowledgeable.” | “High subscription costs limit access for smaller firms.” |
| “Integration with existing tools is seamless and efficient.” | “Occasional glitches disrupt real-time data analysis.” |
Consumers praise Tempus AI for its precision and support, but note barriers in usability and pricing. The tech’s power is clear, yet accessibility remains a concern.
Risk Analysis
Below is a table summarizing key risks facing Tempus AI, Inc., with their likelihood and potential impact:
| Category | Description | Probability | Impact |
|---|---|---|---|
| Financial Health | Negative ROE (-49.87%) and ROIC (-13.2%) indicate ongoing profitability issues. | High | High |
| Valuation | Extremely high P/B ratio (20.94) suggests overvaluation risk. | Medium | Medium |
| Leverage | Debt-to-equity at 1.66 raises concerns about financial leverage and interest coverage near zero. | Medium | High |
| Market Volatility | Very high beta (5.23) signals extreme stock price volatility vs. market. | High | Medium |
| Operational Risks | Negative net margin (-19.27%) reflects operational inefficiency. | High | Medium |
| Liquidity | Current ratio at 3.13 may indicate inefficient asset use despite appearing strong. | Low | Low |
| Bankruptcy Risk | Altman Z-Score of 4.29 places company in safe zone, mitigating bankruptcy fears. | Low | Low |
| Financial Strength | Piotroski score of 2 signals weak financial health and poor value metrics. | High | Medium |
The most critical risks are Tempus’s persistent unprofitability and heavy leverage, which amplify vulnerability in volatile markets. Despite a strong Altman Z-Score, the company’s poor returns and weak Piotroski score highlight ongoing financial distress. Investors must weigh high beta-driven volatility against the firm’s nascent market position and aggressive valuation.
Should You Buy Tempus AI, Inc.?
Tempus AI appears to have a slightly unfavorable moat, shedding value despite growing profitability. Its leverage profile seems manageable, supported by a strong Altman Z-Score, yet operational efficiency and returns remain very weak. The overall rating suggests a cautious profile.
Strength & Efficiency Pillars
Tempus AI, Inc. posts a gross margin of 69.64%, signaling strong operational efficiency. Despite a net margin of -19.27% and ROIC at -13.2%, the Altman Z-Score of 4.29 places the company firmly in the safe zone, indicating solid solvency. However, ROIC remains well below WACC at 26.45%, which means the company is currently destroying value despite growing profitability trends. This gap highlights challenges in capital allocation and long-term value creation.
Weaknesses and Drawbacks
Tempus AI faces significant profitability and leverage concerns. The net margin and ROE stand deeply negative at -19.27% and -49.87%, respectively, reflecting persistent losses. Its high price-to-book ratio of 20.94 suggests an expensive valuation relative to book value, while the debt-to-equity ratio of 1.66 reveals substantial leverage risk. The recent seller dominance with buyers only at 32.83% compounds short-term market pressure, signaling caution amid decelerating price momentum.
Our Final Verdict about Tempus AI, Inc.
Despite a secure solvency position, Tempus AI’s negative profitability and high leverage make the investment profile risky. The bullish long-term trend is undercut by recent seller dominance and deceleration, suggesting investors might prefer to wait for clearer operational improvements and market stability before committing capital. The profile might appear appealing only for risk-tolerant investors willing to navigate significant volatility and value erosion.
Disclaimer: This content is for informational purposes only and does not constitute financial, investment, or other professional advice. Investing in financial markets involves a significant risk of loss, and past performance is not indicative of future results.
Additional Resources
- Tempus Reports Fourth Quarter and Full Year 2025 Results – Business Wire (Feb 24, 2026)
- Tempus AI Inc Q4 Loss Increases, But Beats Estimates – Nasdaq (Feb 25, 2026)
- Why Tempus AI Stock Is Dropping Despite Bold Outlook – TipRanks (Feb 24, 2026)
- Tempus AI (NASDAQ:TEM) Releases Earnings Results, Beats Expectations By $0.01 EPS – MarketBeat (Feb 24, 2026)
- Tempus AI Inc (NASDAQ:TEM) Reports Strong Q4 Revenue Beat and First Positive Adjusted EBITDA – ChartMill (Feb 24, 2026)
For more information about Tempus AI, Inc., please visit the official website: tempus.com