Home > Analyses > Technology > Teledyne Technologies Incorporated
Teledyne Technologies shapes the future of industrial and defense technology with precision instruments and advanced imaging systems. It dominates sectors from aerospace electronics to digital sensors, powering critical applications in research, security, and manufacturing. Known for relentless innovation and quality, Teledyne commands a strong market presence backed by cutting-edge engineering. As we dive deeper, I ask: do its robust fundamentals still justify its premium valuation and growth outlook in 2026?

Table of contents
Business Model & Company Overview
Teledyne Technologies Incorporated, founded in 1960 and based in Thousand Oaks, California, leads the hardware, equipment & parts industry with a diversified technology ecosystem. It integrates advanced instrumentation, digital imaging, aerospace, and engineered systems to serve industrial, defense, medical, and scientific markets. This cohesive portfolio drives innovation across multiple sectors, reinforcing its position as a critical technology enabler.
The company’s revenue engine balances sales of high-precision hardware with recurring software and service contracts. Teledyne operates globally, with strong market footprints in the Americas, Europe, and Asia. Its broad reach and integrated solutions create a durable economic moat, underpinning long-term growth and industry influence.
Financial Performance & Fundamental Metrics
I analyze Teledyne Technologies Incorporated’s income statement, key financial ratios, and dividend payout policy to assess its core financial health and shareholder value.
Income Statement
This table summarizes Teledyne Technologies Incorporated’s key income statement figures for fiscal years 2021 through 2025, illustrating revenue growth and profitability trends.

| 2021 | 2022 | 2023 | 2024 | 2025 | |
|---|---|---|---|---|---|
| Revenue | 4.61B | 5.46B | 5.64B | 5.67B | 6.12B |
| Cost of Revenue | 2.77B | 3.13B | 3.20B | 3.24B | 3.72B |
| Operating Expenses | 1.22B | 1.36B | 1.41B | 1.45B | 1.25B |
| Gross Profit | 1.84B | 2.33B | 2.44B | 2.43B | 2.40B |
| EBITDA | 996M | 1.33B | 1.35B | 1.31B | 1.50B |
| EBIT | 625M | 997M | 1.04B | 996M | 1.16B |
| Interest Expense | 91M | 89M | 77M | 58M | 60M |
| Net Income | 445M | 789M | 886M | 819M | 895M |
| EPS | 10.31 | 16.85 | 18.71 | 17.43 | 18.88 |
| Filing Date | 2022-02-25 | 2023-02-24 | 2023-12-31 | 2025-02-21 | 2026-02-20 |
Income Statement Evolution
Teledyne Technologies’ revenue rose 33% from 2021 to 2025, with a 7.9% increase in 2025 alone. Net income doubled over this period, reflecting strong profitability gains. Gross margin remained stable near 39%, while EBIT margin improved to 19%, showing efficient cost control and margin expansion despite a slight dip in gross profit growth last year.
Is the Income Statement Favorable?
The 2025 income statement reveals solid fundamentals. Revenue hit $6.12B with a 14.6% net margin, signaling strong earnings quality. Operating expenses grew proportionally with revenue, supporting margin stability. Interest expense stayed low at under 1%, enhancing earnings resilience. Overall, profitability metrics and growth trends align favorably, indicating robust operational performance and prudent capital management.
Financial Ratios
The following table summarizes key financial ratios for Teledyne Technologies Incorporated (TDY) over the last five fiscal years:
| Ratios | 2021 | 2022 | 2023 | 2024 | 2025 |
|---|---|---|---|---|---|
| Net Margin | 9.7% | 14.4% | 15.7% | 14.4% | 14.6% |
| ROE | 5.8% | 9.7% | 9.6% | 8.6% | 8.5% |
| ROIC | 4.0% | 6.4% | 7.2% | 6.7% | 6.8% |
| P/E | 42.4 | 23.7 | 23.8 | 26.5 | 27.3 |
| P/B | 2.48 | 2.29 | 2.29 | 2.28 | 2.33 |
| Current Ratio | 1.62 | 1.85 | 1.69 | 2.33 | 1.64 |
| Quick Ratio | 1.12 | 1.27 | 1.17 | 1.61 | 1.08 |
| D/E | 0.54 | 0.48 | 0.35 | 0.29 | 0.24 |
| Debt-to-Assets | 28.4% | 27.3% | 22.3% | 19.6% | 16.2% |
| Interest Coverage | 6.9x | 10.9x | 13.4x | 17.1x | 19.3x |
| Asset Turnover | 0.32 | 0.38 | 0.39 | 0.40 | 0.40 |
| Fixed Asset Turnover | 5.58 | 7.09 | 7.25 | 7.61 | 7.29 |
| Dividend Yield | 0% | 0% | 0% | 0% | 0% |
Evolution of Financial Ratios
Return on Equity (ROE) has declined slightly from 9.65% in 2023 to 8.51% in 2025, indicating a modest weakening in profitability. The Current Ratio fell from 2.33 in 2024 to 1.64 in 2025, showing reduced short-term liquidity. Meanwhile, the Debt-to-Equity Ratio improved steadily from 0.54 in 2021 to 0.24 in 2025, reflecting more conservative leverage.
Are the Financial Ratios Fovorable?
In 2025, profitability appears mixed with a favorable net margin of 14.63% but an unfavorable ROE of 8.51%, below WACC at 8.05%. Liquidity ratios, including a current ratio of 1.64 and quick ratio of 1.08, are favorable. Leverage metrics like debt-to-equity at 0.24 and interest coverage near 19.5 are strong. Asset turnover at 0.4 and zero dividend yield are unfavorable, resulting in a slightly favorable overall ratio profile.
Shareholder Return Policy
Teledyne Technologies Incorporated (TDY) does not pay dividends, reflecting a reinvestment strategy focused on growth and operational expansion. The company maintains share buybacks, suggesting a preference for capital return via stock repurchases rather than direct dividend payments.
This approach aligns with sustaining long-term shareholder value by prioritizing cash flow reinvestment and prudent capital allocation. Share buybacks indicate a balanced distribution policy that supports shareholder returns without compromising financial flexibility or growth initiatives.
Score analysis
The radar chart below illustrates the company’s performance across key financial metrics:

Teledyne’s scores show moderate discounted cash flow and return on equity. Return on assets is favorable. Debt-to-equity and price-to-earnings scores are unfavorable, while price-to-book remains moderate.
Analysis of the company’s bankruptcy risk
The Altman Z-Score indicates a strong financial position, placing the company firmly in the safe zone:

Is the company in good financial health?
The Piotroski diagram presents the company’s financial strength based on nine key criteria:

With a Piotroski score of 6, the company demonstrates average financial health, suggesting reasonable but not exceptional operational efficiency and profitability.
Competitive Landscape & Sector Positioning
This analysis explores Teledyne Technologies Incorporated’s strategic positioning within the technology sector. It examines revenue by segment, key products, main competitors, and competitive advantages. I will assess whether Teledyne holds a meaningful competitive advantage over its peers.
Strategic Positioning
Teledyne Technologies maintains a diversified product portfolio across Aerospace and Defense Electronics, Digital Imaging, Instrumentation, and Engineered Systems. Geographically, it generates significant revenue in the United States, Europe, and Asia, reflecting a broad international presence alongside sector specialization.
Revenue by Segment
This pie chart illustrates Teledyne Technologies’ revenue distribution by product segment for the fiscal year 2025, highlighting the company’s diversified business model.

Digital Imaging leads with $3.16B, followed by Instrumentation at $1.46B and Aerospace and Defense Electronics at $1.06B. Engineered Systems contributes $436M. The strong growth in Aerospace and Defense Electronics signals increasing defense demand. Digital Imaging remains the core revenue driver, showing steady expansion. Instrumentation also shows consistent growth, while Engineered Systems holds a smaller, stable share, reflecting a balanced but concentrated portfolio.
Key Products & Brands
Teledyne Technologies’ revenue derives from four main business segments with diverse technological offerings:
| Product | Description |
|---|---|
| Instrumentation | Monitoring and control instruments for marine, environmental, industrial use; electronic test and measurement equipment. |
| Digital Imaging | Visible spectrum sensors, digital cameras for industrial, medical, scientific applications; infrared, X-ray spectra, MEMS. |
| Aerospace and Defense Electronics | Electronic components, subsystems, communications products for defense, aircraft, wireless, satellite, and general aviation. |
| Engineered Systems | Systems engineering, integration, technology development for defense, space, environmental, energy; military electrochemical systems. |
Teledyne’s product mix spans industrial instrumentation, advanced imaging, aerospace electronics, and engineered defense systems. Digital Imaging dominates revenue, reflecting the company’s technological depth and market reach.
Main Competitors
The sector includes 20 competitors, with the table listing the top 10 leaders by market capitalization:
| Competitor | Market Cap. |
|---|---|
| Amphenol Corporation | 171B |
| Corning Incorporated | 77.7B |
| TE Connectivity Ltd. | 68.6B |
| Sandisk Corporation | 40B |
| Garmin Ltd. | 39B |
| Keysight Technologies, Inc. | 35.5B |
| Celestica Inc. | 34B |
| Coherent, Inc. | 28.7B |
| Jabil Inc. | 25.7B |
| Teledyne Technologies Incorporated | 24.4B |
Teledyne ranks 10th among its peers, holding roughly 18% of the market cap of the leader, Amphenol Corporation. It sits below the average market cap of the top 10 (54.4B) but remains above the sector median of 21.6B. The company has an 18.2% market cap gap to its closest competitor above, Jabil Inc., highlighting a moderate distance in scale.
Comparisons with competitors
Check out how we compare the company to its competitors:
Does Teledyne have a competitive advantage?
Teledyne currently lacks a strong competitive advantage, as its return on invested capital (ROIC) falls below its weighted average cost of capital (WACC), indicating value destruction. However, its ROIC has shown significant growth over recent years, signaling improving profitability despite this challenge.
Looking ahead, Teledyne’s diverse product portfolio spans instrumentation, digital imaging, aerospace, and defense electronics, offering exposure to multiple industrial growth markets. Expansion into new geographic regions and continued innovation in advanced sensor and imaging technologies present meaningful future opportunities.
SWOT Analysis
This SWOT analysis highlights Teledyne Technologies’ core competitive factors and risks to guide strategic investment decisions.
Strengths
- strong gross margin at 39%
- diversified industrial and defense segments
- low debt-to-assets ratio at 16%
Weaknesses
- ROIC below WACC indicates value destruction
- moderate revenue growth at 7.9% last year
- no dividend yield limits income appeal
Opportunities
- expanding digital imaging and aerospace markets
- growing ROIC trend signals improving profitability
- geographic expansion in Europe and Asia
Threats
- semiconductor supply volatility
- defense budget uncertainties
- high P/E at 27.35 may pressure valuation
Teledyne balances robust margins and a diversified portfolio with challenges in capital efficiency. Strategic focus on innovation and market expansion is essential to convert profitability gains into shareholder value.
Stock Price Action Analysis
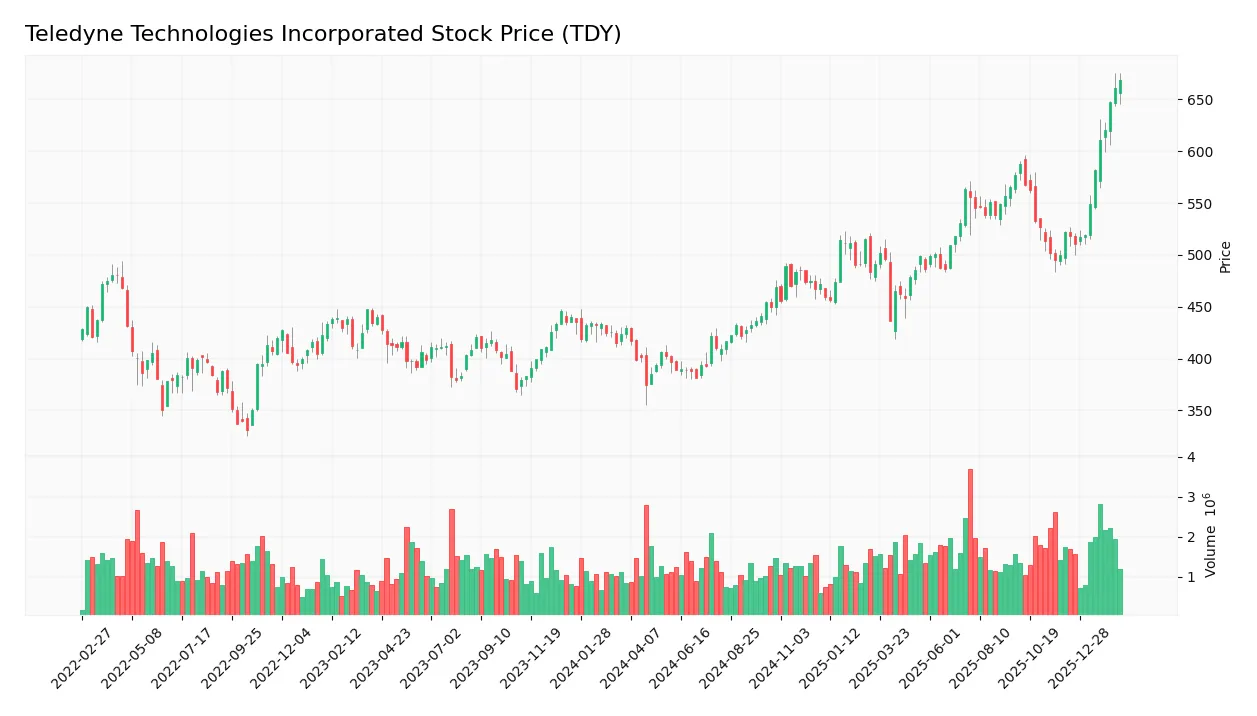
The weekly stock chart below illustrates Teledyne Technologies Incorporated’s price movement and volatility patterns over the past 12 months:
Trend Analysis
Over the past 12 months, TDY’s stock price increased by 55.76%, indicating a strong bullish trend with accelerating momentum. The price ranged from a low of 374.64 to a high of 668.72, and volatility remains elevated with a 64.96 standard deviation.
Volume Analysis
Trading volume for TDY is increasing, with buyers accounting for 56.38% overall. In the last three months, buyer dominance surged to 84.24%, signaling strong buyer-driven activity and heightened investor confidence in the stock.
Target Prices
Analysts set a confident target consensus for Teledyne Technologies Incorporated at $638.5.
| Target Low | Target High | Consensus |
|---|---|---|
| 599 | 720 | 638.5 |
The target range suggests expectations of solid upside potential, reflecting strong confidence in Teledyne’s growth trajectory.

Don’t Let Luck Decide Your Entry Point
Optimize your entry points with our advanced ProRealTime indicators. You’ll get efficient buy signals with precise price targets for maximum performance. Start outperforming now!
Analyst & Consumer Opinions
This section examines analyst ratings and consumer feedback to provide a balanced view of Teledyne Technologies Incorporated’s market perception.
Stock Grades
Here are the latest verified grades from leading financial institutions for Teledyne Technologies Incorporated:
| Grading Company | Action | New Grade | Date |
|---|---|---|---|
| Barclays | Maintain | Equal Weight | 2026-01-22 |
| Needham | Maintain | Buy | 2026-01-22 |
| Stifel | Maintain | Buy | 2026-01-22 |
| Citigroup | Maintain | Neutral | 2026-01-13 |
| Barclays | Maintain | Equal Weight | 2026-01-12 |
| Barclays | Maintain | Equal Weight | 2025-10-23 |
| Stifel | Maintain | Buy | 2025-10-23 |
| Needham | Maintain | Buy | 2025-10-23 |
| Morgan Stanley | Maintain | Equal Weight | 2025-10-15 |
| UBS | Maintain | Buy | 2025-07-24 |
The consensus remains skewed toward Buy ratings, with multiple firms maintaining positive stances. Barclays and Morgan Stanley consistently assign Equal Weight, reflecting a cautious but stable outlook.
Consumer Opinions
Teledyne Technologies Incorporated garners a mix of praise and criticism, reflecting a nuanced consumer sentiment.
| Positive Reviews | Negative Reviews |
|---|---|
| Reliable product performance with robust engineering. | High pricing compared to competitors. |
| Excellent customer support and responsive service teams. | Occasional delays in product delivery. |
| Innovative technology that meets industry standards. | Complex user interface on some software solutions. |
Overall, consumers appreciate Teledyne’s engineering quality and customer service. However, pricing and delivery speed remain consistent pain points, suggesting room for operational improvements.
Risk Analysis
The table below summarizes key risks Teledyne Technologies Incorporated faces, highlighting probability and potential impact:
| Category | Description | Probability | Impact |
|---|---|---|---|
| Market Valuation | Elevated P/E ratio at 27.35 signals stretched valuation risk | Moderate | Medium |
| Profitability | ROE at 8.51% lags sector average, indicating weaker capital efficiency | Moderate | Medium |
| Operational | Below-average asset turnover (0.4) may limit revenue growth | Moderate | Medium |
| Leverage & Debt | Low debt-to-equity (0.24) and strong interest coverage reduce solvency risk | Low | Low |
| Dividend Policy | No dividend yield could deter income-focused investors | Moderate | Low |
| Financial Health | Altman Z-score of 4.69 places company in safe zone, minimizing bankruptcy risk | Low | Low |
| Market Volatility | Beta near 1.01 indicates stock moves roughly with market, exposing to cycles | Moderate | Medium |
The most pressing risks involve valuation and moderate profitability. The P/E at 27.35 exceeds typical industry benchmarks, suggesting price vulnerability if growth slows. Also, ROE below 10% signals capital is not generating top returns compared to peers. However, strong liquidity and low leverage mitigate major solvency concerns. Investors should watch for potential earnings pressure and market shifts impacting this industrial tech leader.
Should You Buy Teledyne Technologies Incorporated?
Teledyne Technologies appears to be a profile of improving profitability with a growing ROIC trend, yet it currently destroys value relative to WACC. Despite a manageable leverage profile, its debt metrics suggest caution. Overall, the company’s financial health could be seen as moderately favorable, supporting a B rating.
Strength & Efficiency Pillars
Teledyne Technologies Incorporated exhibits robust operational efficiency with a gross margin of 39.22% and an EBIT margin nearing 19%. Its net margin stands at a strong 14.63%, underscoring profitable core operations. Although ROIC of 6.78% trails the WACC of 8.05%, indicating the company is currently shedding value, the ROIC trend shows a 68.4% increase, signaling improving capital efficiency. The firm maintains favorable leverage ratios, supporting operational stability. These metrics reflect solid profitability despite challenges in value creation.
Weaknesses and Drawbacks
Teledyne faces valuation and efficiency headwinds. The price-to-earnings ratio of 27.35 is elevated, suggesting a premium valuation that may limit upside. Return on equity at 8.51% lags expectations, signaling weaker shareholder returns. Asset turnover is low at 0.4, pointing to underutilized assets. Dividend yield remains at zero, which could deter income-focused investors. While leverage ratios are favorable, these valuation and efficiency concerns warrant caution, especially in a competitive technology sector.
Our Final Verdict about Teledyne Technologies Incorporated
The company’s financial health is solid, as confirmed by an Altman Z-Score of 4.69, placing it well within the safe zone. Despite a bullish long-term stock trend and strong recent buyer dominance at 84.24%, the premium valuation and modest ROE suggest investors might adopt a measured stance. Teledyne’s profile may appear attractive for long-term exposure, but selective timing could enhance risk-adjusted returns.
Disclaimer: This content is for informational purposes only and does not constitute financial, investment, or other professional advice. Investing in financial markets involves a significant risk of loss, and past performance is not indicative of future results.
Additional Resources
- Decoding Teledyne Technologies Inc (TDY): A Strategic SWOT Insig – GuruFocus (Feb 21, 2026)
- Teledyne (TDY) Up 7.2% Since Last Earnings Report: Can It Continue? – Yahoo Finance (Feb 20, 2026)
- Condor Capital Management Buys Shares of 5,484 Teledyne Technologies Incorporated $TDY – MarketBeat (Feb 18, 2026)
- TELEDYNE TECHNOLOGIES INC SEC 10-K Report – TradingView (Feb 20, 2026)
- Teledyne HiRel Semiconductors Unveils Industry’s Lowest Power, 4 GHz, Wideband Low‑Noise Amplifier (LNA) – Quantisnow (Feb 19, 2026)
For more information about Teledyne Technologies Incorporated, please visit the official website: teledyne.com