Home > Analyses > Energy > TechnipFMC plc
TechnipFMC transforms how the energy sector extracts and delivers vital resources worldwide. Its cutting-edge subsea systems and surface technologies enable safer, more efficient oil and gas production across continents. Renowned for innovation and engineering excellence, the company shapes industry standards and drives operational breakthroughs. As energy markets evolve, I ask whether TechnipFMC’s strategic positioning and financial health justify its current valuation and growth prospects.

Table of contents
Business Model & Company Overview
TechnipFMC plc, founded in 1884 and headquartered in Newcastle upon Tyne, UK, stands as a global leader in the Oil & Gas Equipment & Services industry. It operates a cohesive ecosystem spanning subsea systems and surface technologies, integrating engineering, manufacturing, and life-of-field services. The company’s mission centers on advancing oil and gas production and transportation through cutting-edge solutions that address complex industry challenges worldwide.
The company’s revenue engine balances high-value hardware with digital and recurring services across the Americas, Europe, Asia, Africa, and the Middle East. Its subsea and surface segments deliver integrated production systems, digital pressure control, and flow management technologies, supported by extensive service offerings. TechnipFMC’s strategic alliances, including carbon capture initiatives, reinforce its competitive advantage and position it to shape the energy sector’s future infrastructure.
Financial Performance & Fundamental Metrics
I analyze TechnipFMC plc’s income statement, key financial ratios, and dividend payout policy to assess its operational efficiency and shareholder value creation.
Income Statement
The table below summarizes TechnipFMC plc’s key income statement figures for fiscal years 2021 through 2025, reflecting revenue growth and profitability trends.

| 2021 | 2022 | 2023 | 2024 | 2025 | |
|---|---|---|---|---|---|
| Revenue | 6.40B | 6.70B | 7.83B | 9.08B | 9.93B |
| Cost of Revenue | 5.58B | 5.80B | 6.48B | 7.37B | 8.21B |
| Operating Expenses | 745M | 697M | 777M | 741M | 766M |
| Gross Profit | 824M | 896M | 1.34B | 1.71B | 1.72B |
| EBITDA | 464M | 577M | 964M | 1.41B | 1.40B |
| EBIT | 79M | 200M | 589M | 1.04B | 957M |
| Interest Expense | 157M | 139M | 122M | 97M | 97M |
| Net Income | 13M | -107M | 23M | 843M | 964M |
| EPS | 0.19 | -0.14 | 0.05 | 1.96 | 2.30 |
| Filing Date | 2022-02-28 | 2023-02-24 | 2024-02-27 | 2025-02-27 | 2026-02-19 |
Income Statement Evolution
TechnipFMC’s revenue grew steadily from 6.4B in 2021 to nearly 10B in 2025, a 55% increase. Net income surged dramatically, from 13M in 2021 to 964M in 2025, reflecting a significant margin expansion. Gross margin held steady around 17%, while EBIT margin softened slightly but remained close to 10%, indicating stable operational efficiency.
Is the Income Statement Favorable?
In 2025, fundamentals appear favorable with a 9.7% net margin and a full-year net income of 963.9M. Despite a 7.8% EBIT decline in the last year, revenue and EPS growth remain robust at 9.4% and 20.4%, respectively. Interest expense is well controlled under 1% of revenue. Overall, 64% of income metrics rate favorable, supporting a positive income statement view.
Financial Ratios
The table below summarizes key financial ratios for TechnipFMC plc (FTI) over the last five fiscal years, providing insights into profitability, liquidity, leverage, and valuation:
| Ratios | 2021 | 2022 | 2023 | 2024 | 2025 |
|---|---|---|---|---|---|
| Net Margin | 0.21% | -1.60% | 0.29% | 9.28% | 9.70% |
| ROE | 0.39% | -3.31% | 0.73% | 27.24% | 28.65% |
| ROIC | 0.53% | -1.82% | 1.18% | 16.09% | 17.67% |
| P/E | 201 | -51 | 386 | 14.73 | 19.37 |
| P/B | 0.78 | 1.69 | 2.82 | 4.01 | 5.55 |
| Current Ratio | 1.39 | 1.20 | 1.16 | 1.12 | 1.13 |
| Quick Ratio | 1.10 | 0.93 | 0.90 | 0.88 | 0.89 |
| D/E | 0.83 | 0.71 | 0.63 | 0.58 | 0.60 |
| Debt-to-Assets | 28.2% | 24.3% | 20.4% | 18.2% | 19.9% |
| Interest Coverage | 0.50 | 1.44 | 4.64 | 9.94 | 9.87 |
| Asset Turnover | 0.64 | 0.71 | 0.81 | 0.92 | 0.98 |
| Fixed Asset Turnover | 1.91 | 2.09 | 2.52 | 3.07 | 4.35 |
| Dividend Yield | 0% | 0% | 0.49% | 0.69% | 0.44% |
Evolution of Financial Ratios
Return on Equity (ROE) improved markedly from near zero in 2023 to 28.66% in 2025, reflecting stronger profitability. The Current Ratio remained stable around 1.13, indicating consistent short-term liquidity. Debt-to-Equity Ratio fluctuated modestly, settling at 0.6 in 2025, showing a steady leverage profile without aggressive debt increases.
Are the Financial Ratios Fovorable?
Profitability ratios such as ROE (28.66%) and ROIC (17.67%) surpass the WACC (6.73%), signaling efficient capital use. Liquidity ratios like the Current Ratio (1.13) and Quick Ratio (0.89) are neutral, neither indicating distress nor excess cushion. Leverage metrics, including Debt-to-Equity (0.6) and Debt-to-Assets (19.93%), are generally favorable. Valuation multiples show mixed signals: a neutral P/E (19.37) contrasts with an unfavorable high Price-to-Book (5.55). Overall, the financial ratios are slightly favorable, balancing strengths and caution areas.
Shareholder Return Policy
TechnipFMC plc pays a modest dividend with a 2025 payout ratio near 8.5% and a yield below 0.5%. The dividend is covered by free cash flow, supporting sustainable distributions. The company also conducts share buybacks, enhancing shareholder returns.
This balanced approach of dividends and buybacks aligns with prudent capital allocation. The low payout ratio and cash flow coverage reduce risks of unsustainable returns. Overall, the policy supports long-term shareholder value creation without overleveraging the balance sheet.
Score analysis
The radar chart below summarizes TechnipFMC plc’s key financial scores, reflecting its valuation and profitability metrics:

TechnipFMC scores very favorably on return on equity and assets, indicating strong profitability. Its debt-to-equity ratio is also favorable, supporting prudent leverage. However, valuation metrics like price-to-earnings and price-to-book are weak, signaling potential market undervaluation or risk concerns.
Analysis of the company’s bankruptcy risk
TechnipFMC’s Altman Z-Score places it in the safe zone, indicating a low risk of bankruptcy and solid financial stability:

Is the company in good financial health?
The Piotroski Score diagram highlights TechnipFMC’s solid financial strength and operational efficiency:

With a score of 7, TechnipFMC demonstrates strong financial health, suggesting effective management and resilient fundamentals compared to peers.
Competitive Landscape & Sector Positioning
This analysis examines TechnipFMC plc’s strategic positioning, revenue streams, key products, and main competitors. I will assess whether TechnipFMC holds a competitive advantage in the oil and gas equipment and services sector.
Strategic Positioning
TechnipFMC maintains a diversified product portfolio split between products (~4B) and services (~5.6B) in 2025. Its geographic reach spans major oil markets including Brazil (2.16B), the U.S. (1.44B), Norway (1.38B), and multiple other regions, reflecting broad global exposure in oil and gas equipment and services.
Revenue by Segment
This pie chart illustrates TechnipFMC plc’s revenue distribution by segment for fiscal year 2025, highlighting the relative contributions of Product and Service lines.
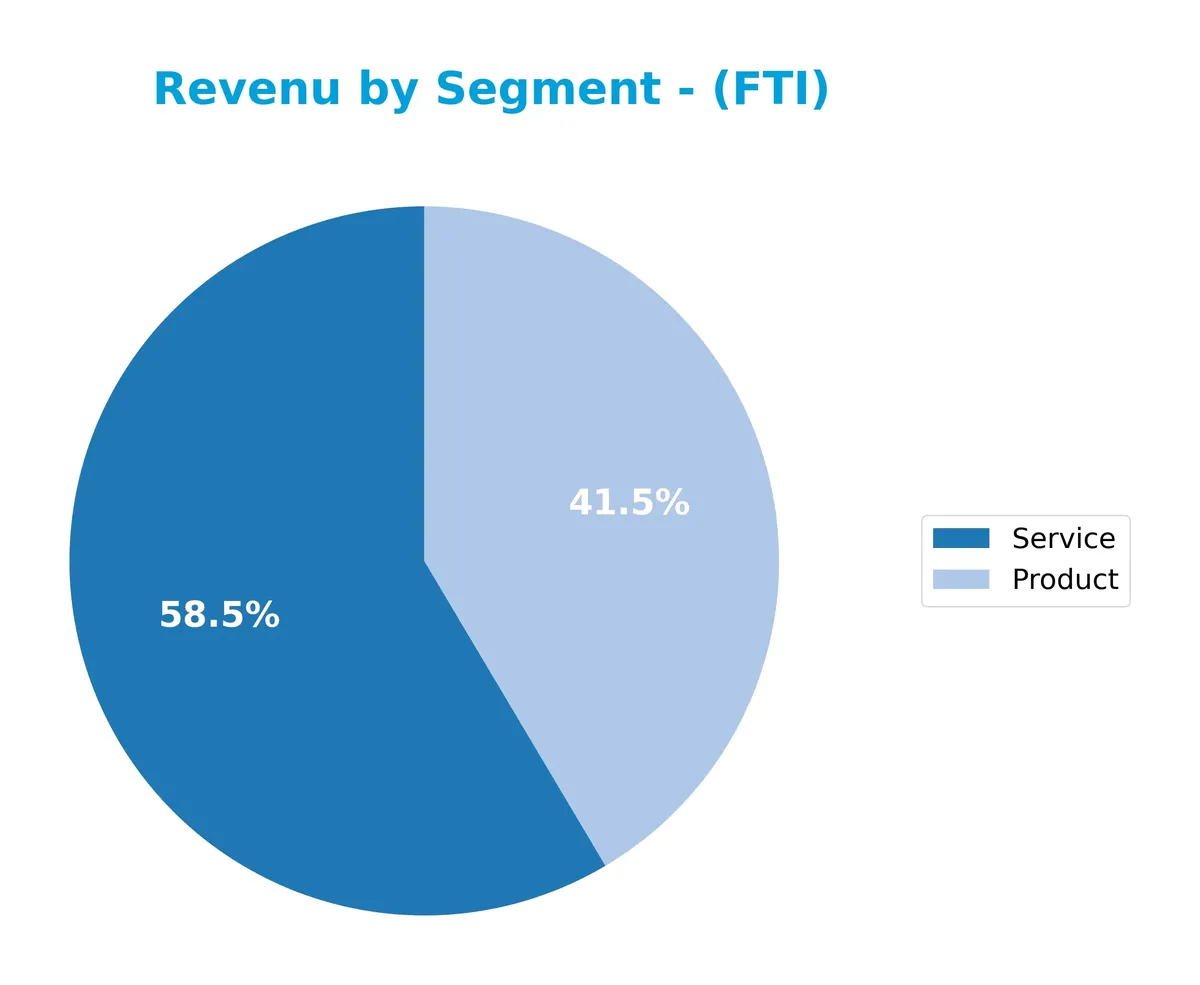
In 2025, Services lead with $5.6B, outpacing Products at $4.0B. I see a consistent rise in Product revenue from $3.3B in 2024, signaling growth in tangible offerings. Services show steady gains but with slower acceleration. This shift toward Products suggests a strategic emphasis on higher-margin or scalable goods, while Services remain a stable revenue base, reducing concentration risk.
Key Products & Brands
Below is an overview of TechnipFMC plc’s key products and brands with their respective descriptions:
| Product | Description |
|---|---|
| Subsea Systems | Design, engineering, procurement, manufacturing, and installation of subsea production and processing systems for oil and gas. |
| Subsea Umbilicals, Risers, and Flowlines | Critical infrastructure for subsea oil and gas production and transportation. |
| Surface Technologies | Products and systems for land and shallow water exploration and production, including wellheads, pressure control, and pumps. |
| Drilling and Completion Systems | Equipment used in drilling and completing oil and gas wells. |
| Digital Solutions (iComplete) | Digitally enabled pressure control systems enhancing operational safety and efficiency. |
| Fracturing Tree and Manifold Systems | Systems used in hydraulic fracturing operations to control flow and pressure. |
| Well and Asset Services | Lifecycle services including planning, maintenance, decommissioning, and upgrades for oil and gas assets. |
| Automation and Digital Systems | Flow measurement and automation solutions for production optimization. |
| Flexible Lines and Flowline Products | Supplies for flexible tubing and flowline infrastructure in oil and gas production. |
| Carbon Capture and Storage Solutions | Technical and commercial solutions developed in alliance with Talos Energy for carbon capture projects. |
TechnipFMC offers a comprehensive suite of products and services across subsea and surface technologies. The company integrates engineering expertise with digital and lifecycle services, positioning itself strongly in oil and gas infrastructure and emerging carbon capture markets.
Main Competitors
There are 4 main competitors in the Oil & Gas Equipment & Services industry; below is the top 4 by market capitalization:
| Competitor | Market Cap. |
|---|---|
| SLB N.V. | 60B |
| Baker Hughes Company | 47B |
| Halliburton Company | 25B |
| TechnipFMC plc | 19B |
TechnipFMC ranks 4th among its peers, with a market cap at 43% of the leader SLB N.V. It sits below both the average market cap of the top 10 (37.7B) and the sector median (36B). The company trails its closest rival, Halliburton, by roughly 2.3%, reflecting a narrow gap at the lower end of this competitive set.
Comparisons with competitors
Check out how we compare the company to its competitors:
Does TechnipFMC plc have a competitive advantage?
TechnipFMC plc demonstrates a clear competitive advantage, creating value with a ROIC exceeding WACC by nearly 11%, supported by a strong upward ROIC trend. This positions the company as a value creator in the Oil & Gas Equipment & Services sector.
Looking ahead, TechnipFMC’s strategic alliance in Carbon Capture and Storage projects and its broad geographic diversification offer growth opportunities. Expanding product lines and services in subsea and surface technologies could further enhance its market position.
SWOT Analysis
This analysis highlights TechnipFMC plc’s key internal and external factors shaping its strategic position.
Strengths
- strong ROIC well above WACC
- diversified global footprint
- robust revenue and net income growth
Weaknesses
- high price-to-book ratio signals valuation risk
- moderate current and quick ratios limit short-term liquidity
- low dividend yield may deter income-focused investors
Opportunities
- expanding subsea and surface technology markets
- strategic alliance in carbon capture projects
- rising global energy demand driving equipment needs
Threats
- oil price volatility affecting project spend
- geopolitical risks in key regions
- increasing regulatory and environmental pressures
TechnipFMC demonstrates a sustainable competitive advantage with solid profitability and growth. However, valuation concerns and liquidity warrant caution. The company’s strategy should leverage innovation and partnerships while managing sector cyclicality risks.
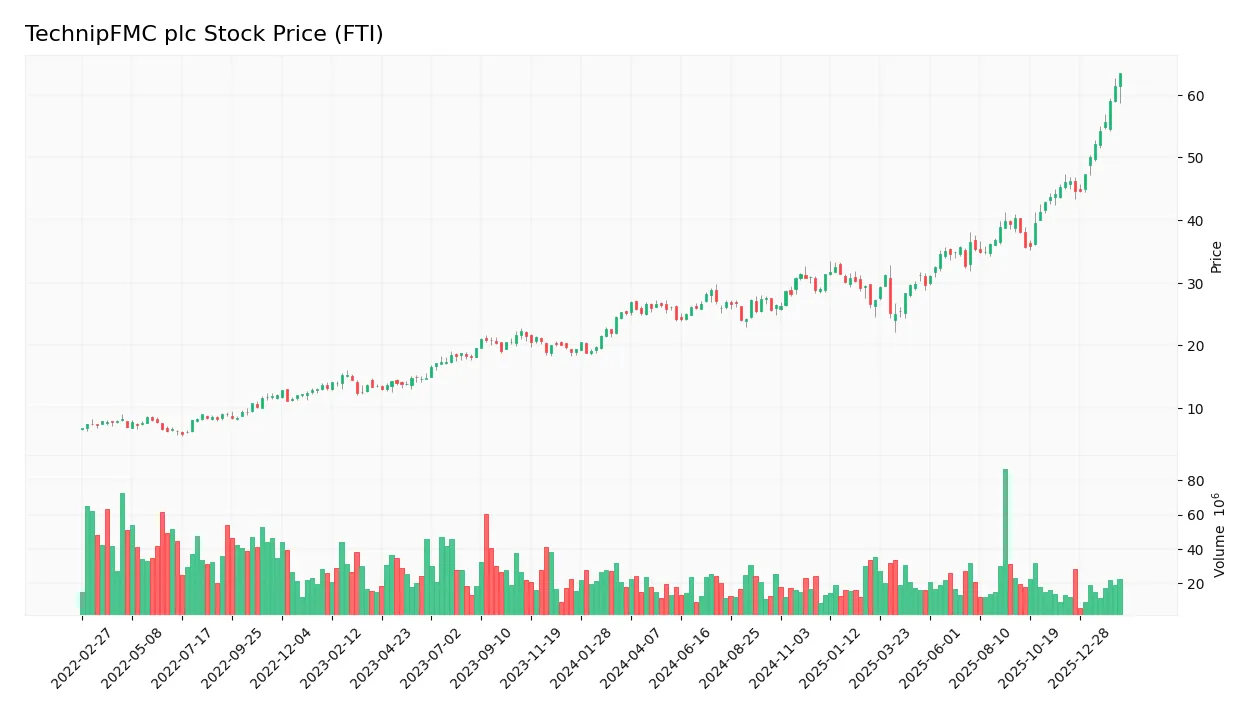
Stock Price Action Analysis
The following weekly chart illustrates TechnipFMC plc’s stock price movements and key fluctuations over the analyzed period:
Trend Analysis
TechnipFMC’s stock price rose 153% over the past two years, indicating a strong bullish trend with accelerating momentum. The price ranged from a low of 24.02 to a high of 63.49, supported by volatility at a standard deviation of 8.8%. Recent months show a 38% gain with steady slope growth of 1.77, confirming sustained upward acceleration.
Volume Analysis
Trading volume over three months shows decreasing activity overall, yet buyer volume dominates at 83%, signaling strong buyer control. This suggests robust investor confidence despite lower market participation, with sellers accounting for less than 17% of volume. The volume trend indicates selective but committed buying interest.
Target Prices
Analysts set a clear target consensus for TechnipFMC plc, reflecting moderately bullish expectations.
| Target Low | Target High | Consensus |
|---|---|---|
| 47 | 71 | 56.75 |
The target range spans from 47 to 71, with a consensus near 57, indicating steady upside potential balanced with some caution.

Don’t Let Luck Decide Your Entry Point
Optimize your entry points with our advanced ProRealTime indicators. You’ll get efficient buy signals with precise price targets for maximum performance. Start outperforming now!
Analyst & Consumer Opinions
This section examines the latest analyst grades and consumer feedback regarding TechnipFMC plc (FTI) performance and reputation.
Stock Grades
Here is a summary of recent stock grades from leading financial institutions for TechnipFMC plc:
| Grading Company | Action | New Grade | Date |
|---|---|---|---|
| HSBC | Downgrade | Hold | 2026-02-20 |
| Susquehanna | Maintain | Positive | 2026-02-20 |
| RBC Capital | Maintain | Outperform | 2026-02-20 |
| TD Cowen | Maintain | Buy | 2026-01-07 |
| Susquehanna | Maintain | Positive | 2026-01-07 |
| Piper Sandler | Maintain | Overweight | 2025-12-18 |
| Jefferies | Maintain | Buy | 2025-11-03 |
| Citigroup | Maintain | Buy | 2025-10-29 |
| RBC Capital | Maintain | Outperform | 2025-10-28 |
| Barclays | Maintain | Overweight | 2025-10-27 |
Most analysts maintain positive outlooks, with several Buy and Outperform ratings. HSBC’s recent downgrade to Hold marks a cautious note amid otherwise steady confidence.
Consumer Opinions
Consumer sentiment around TechnipFMC plc reveals a mix of respect for its technical expertise and concerns about project delays.
| Positive Reviews | Negative Reviews |
|---|---|
| Strong engineering capabilities | Project timelines often slip |
| Innovative subsea technology | Customer service can be unresponsive |
| Commitment to safety standards | Pricing sometimes lacks transparency |
Overall, consumers appreciate TechnipFMC’s innovation and safety focus. However, recurring complaints about delays and service responsiveness could undermine client trust if unaddressed.
Risk Analysis
Below is a summary of key risks for TechnipFMC plc, highlighting their likelihood and potential impact:
| Category | Description | Probability | Impact |
|---|---|---|---|
| Market Volatility | Oil & gas sector exposure causes earnings sensitivity to commodity price fluctuations. | High | High |
| Leverage Risk | Moderate debt level with 0.6 D/E ratio, manageable but requires careful capital allocation. | Medium | Medium |
| Liquidity Risk | Current ratio at 1.13 and quick ratio at 0.89 indicate borderline liquidity position. | Medium | Medium |
| Valuation Risk | High P/B ratio of 5.55 suggests stock may be overvalued relative to book value. | Medium | Medium |
| Dividend Yield Risk | Low yield at 0.44% may deter income-focused investors amid volatile energy markets. | Medium | Low |
| Operational Risk | Complex global operations expose company to geopolitical and regulatory uncertainties. | Medium | High |
The most pressing risks stem from sector volatility and operational complexities. TechnipFMC’s exposure to oil price swings remains a key earnings driver. Despite a safe Altman Z-score of 3.18, liquidity ratios hint at cautious monitoring. The high price-to-book ratio warns of valuation premiums, increasing downside risk if market conditions worsen.
Should You Buy TechnipFMC plc?
TechnipFMC plc appears to be a profitable company with robust value creation and a durable competitive moat supported by a growing ROIC. Its leverage profile is manageable, suggesting operational efficiency. The overall rating of A- reflects a very favorable financial health profile.
Strength & Efficiency Pillars
TechnipFMC plc demonstrates solid operational efficiency with a net margin of 9.7% and return on equity of 28.66%. The company’s return on invested capital (ROIC) stands at 17.67%, well above its weighted average cost of capital (WACC) at 6.73%. This differential confirms TechnipFMC as a clear value creator. Additionally, sustained revenue growth of 55.11% over five years and a strong Piotroski score of 7 underscore robust financial health and improving profitability.
Weaknesses and Drawbacks
While TechnipFMC remains in the safe zone with an Altman Z-Score of 3.18, valuation metrics raise caution. The price-to-book ratio at 5.55 is notably high, signaling potential overvaluation relative to book value. The price-to-earnings ratio is moderate at 19.37 but could reflect market optimism. Liquidity ratios are neutral, with a current ratio of 1.13. These factors, combined with a low dividend yield of 0.44%, suggest the stock may face valuation pressure despite strong fundamentals.
Our Final Verdict about TechnipFMC plc
TechnipFMC plc displays a fundamentally sound profile with a compelling value creation track record and solid profitability. The bullish long-term price trend and strong buyer dominance (82.53%) over recent months may appear attractive for growth-oriented investors. However, elevated valuation multiples advise a cautious approach. For now, the profile suggests potential upside but might warrant waiting for a more favorable entry point.
Disclaimer: This content is for informational purposes only and does not constitute financial, investment, or other professional advice. Investing in financial markets involves a significant risk of loss, and past performance is not indicative of future results.
Additional Resources
- Cumberland Partners Ltd Has $1.38 Million Stake in TechnipFMC plc $FTI – MarketBeat (Feb 19, 2026)
- TechnipFMC PLC (FTI) Shares Gap Down to $59.66 on Feb 19 – GuruFocus (Feb 19, 2026)
- Cowen Maintains Buy on TechnipFMC (FTI) February 2026 – Meyka (Feb 20, 2026)
- TechnipFMC Plc Announces Increase In Q4 Bottom Line – Nasdaq (Feb 19, 2026)
- TechnipFMC Q4 Earnings Top Estimates, Revenues Miss, Both Increase Y/Y – Yahoo Finance (Feb 20, 2026)
For more information about TechnipFMC plc, please visit the official website: technipfmc.com