Home > Analyses > Technology > TE Connectivity Ltd.
TE Connectivity Ltd. powers the world’s most critical connections, enabling seamless communication and advanced sensing across industries. As a global leader in connectivity and sensor solutions, TE drives innovation in transportation, industrial, and communication markets with its cutting-edge products. Renowned for quality and technological prowess, the company shapes the future of hardware infrastructure. The key question for investors is whether TE Connectivity’s strong fundamentals and market presence still justify its current valuation and growth outlook.

Table of contents
Business Model & Company Overview
TE Connectivity Ltd., founded in 2000 and headquartered in Schaffhausen, Switzerland, stands as a global leader in the hardware and equipment sector. The company operates a cohesive ecosystem of connectivity and sensor solutions spanning Transportation, Industrial, and Communications markets. With a workforce of 85K employees, TE Connectivity integrates terminals, connectors, sensors, and related components into a unified mission of enabling reliable, high-performance connections worldwide.
TE Connectivity’s revenue engine is powered by a balanced portfolio of hardware products complemented by high-value application tooling and sensor solutions. It serves approximately 140 countries, leveraging direct sales and third-party distributors across the Americas, Europe, Asia, and beyond. This extensive global footprint and diversified segment approach constitute a formidable economic moat, positioning the company to shape the future of connectivity across critical industries.
Financial Performance & Fundamental Metrics
This section reviews TE Connectivity Ltd.’s income statement, key financial ratios, and dividend payout policy to assess its overall financial health and shareholder value.
Income Statement
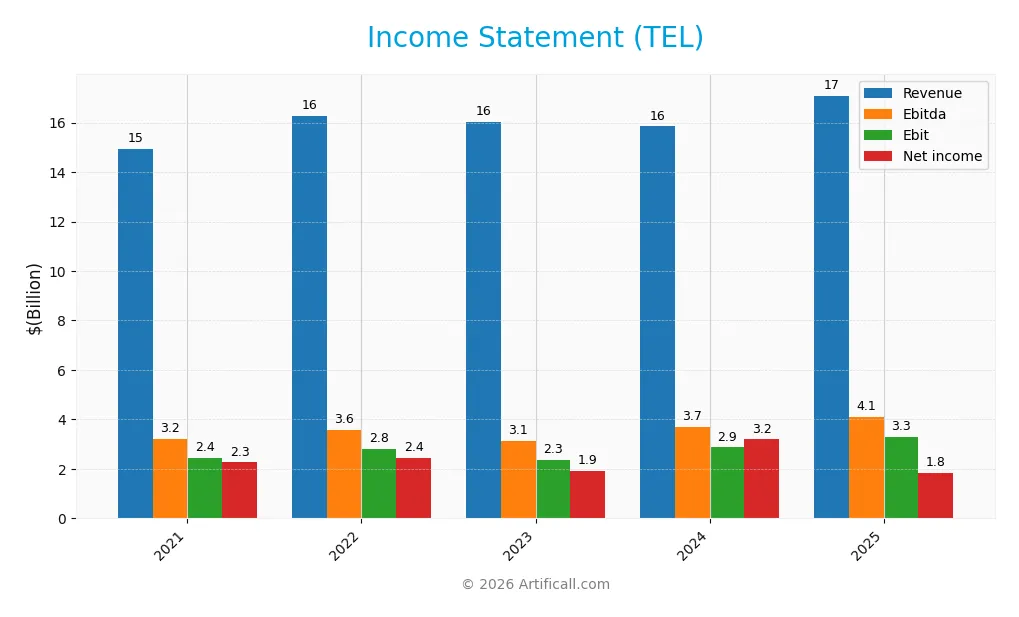
The table below summarizes TE Connectivity Ltd.’s key income statement figures for the fiscal years 2021 through 2025, reported in USD.
| 2021 | 2022 | 2023 | 2024 | 2025 | |
|---|---|---|---|---|---|
| Revenue | 14.9B | 16.3B | 16.0B | 15.8B | 17.1B |
| Cost of Revenue | 10.2B | 11.2B | 11.1B | 10.4B | 11.2B |
| Operating Expenses | 2.1B | 2.3B | 2.3B | 2.7B | 2.7B |
| Gross Profit | 4.7B | 5.1B | 5.0B | 5.5B | 5.9B |
| EBITDA | 3.2B | 3.6B | 3.1B | 3.7B | 4.1B |
| EBIT | 2.4B | 2.8B | 2.3B | 2.9B | 3.3B |
| Interest Expense | 56M | 66M | 80M | 70M | 77M |
| Net Income | 2.3B | 2.4B | 1.9B | 3.2B | 1.8B |
| EPS | 6.85 | 7.52 | 6.06 | 10.4 | 6.2 |
| Filing Date | 2021-11-09 | 2022-11-15 | 2023-11-13 | 2024-11-12 | 2025-11-10 |
Income Statement Evolution
From 2021 to 2025, TE Connectivity Ltd. showed a favorable revenue growth of 14.5%, with the latest year recording $17.1B, up 7.9% from 2024. Gross profit also increased by 8.3% year-over-year, supporting an improved gross margin of 34.6%. However, net income declined by 18.5% over the period, with a significant 46.5% drop in net margin in the latest year, indicating margin pressure despite stable operating expenses growth.
Is the Income Statement Favorable?
In 2025, TE Connectivity’s fundamentals remain generally favorable, supported by a strong EBIT margin of 19.2% and a low interest expense ratio of 0.45%. Although net margin and EPS contracted sharply last year, the company maintained solid gross profit growth and operating expense control. Overall, 57% of income statement metrics are positive, reflecting resilience amid some profitability challenges.
Financial Ratios
The following table presents key financial ratios for TE Connectivity Ltd. (TEL) over the fiscal years 2021 to 2025, providing insight into profitability, valuation, liquidity, leverage, and efficiency:
| Ratios | 2021 | 2022 | 2023 | 2024 | 2025 |
|---|---|---|---|---|---|
| Net Margin | 15.2% | 14.9% | 11.9% | 20.2% | 10.8% |
| ROE | 21.3% | 22.5% | 16.5% | 25.8% | 14.6% |
| ROIC | 14.2% | 14.8% | 12.6% | 14.6% | 8.8% |
| P/E | 21.0 | 14.7 | 20.4 | 14.5 | 35.0 |
| P/B | 4.47 | 3.30 | 3.37 | 3.76 | 5.12 |
| Current Ratio | 1.56 | 1.57 | 1.77 | 1.61 | 1.56 |
| Quick Ratio | 1.02 | 0.99 | 1.20 | 1.08 | 1.03 |
| D/E | 0.46 | 0.46 | 0.42 | 0.40 | 0.52 |
| Debt-to-Assets | 22.7% | 23.8% | 22.5% | 21.7% | 26.1% |
| Interest Coverage | 46.6x | 43.4x | 34.0x | 39.9x | 41.7x |
| Asset Turnover | 0.70 | 0.78 | 0.74 | 0.69 | 0.68 |
| Fixed Asset Turnover | 3.95 | 4.56 | 4.27 | 4.06 | 3.96 |
| Dividend Yield | 1.36% | 1.92% | 1.86% | 1.64% | 1.25% |
Evolution of Financial Ratios
TE Connectivity Ltd.’s Return on Equity (ROE) showed a decline from 25.84% in 2024 to 14.64% in 2025, indicating a slowdown in profitability. The Current Ratio remained stable around 1.56 in 2025, reflecting consistent short-term liquidity. The Debt-to-Equity Ratio slightly increased to 0.52 in 2025, suggesting a moderate rise in leverage but overall stability in financial structure.
Are the Financial Ratios Favorable?
In 2025, TE Connectivity’s profitability ratios show mixed signals: a favorable net profit margin at 10.78%, but a neutral ROE and return on invested capital near 9%. Liquidity ratios, including a 1.56 current ratio and 1.03 quick ratio, are favorable. Leverage indicators such as debt-to-assets at 26.12% and interest coverage around 42.6 support financial strength. Valuation ratios, however, appear unfavorable with a high P/E of 35.0 and P/B of 5.12. Overall, the financial ratios are slightly favorable.
Shareholder Return Policy
TE Connectivity Ltd. maintains a consistent dividend policy with a payout ratio around 28-44% over recent years and a dividend yield near 1.2-1.9%. Dividend coverage by free cash flow and capital expenditure remains strong, supported by stable operating margins and a dividend paid and capex coverage ratio above 2. The company also engages in share buybacks, adding to shareholder returns.
This balanced approach of dividends and buybacks appears sustainable given the company’s positive net profit margins and healthy cash flow metrics. The policy aligns with prudent capital allocation, preserving resources for growth while providing regular income, supporting long-term shareholder value creation without evident risks of over-distribution or excessive repurchases.
Score analysis
The following radar chart presents an overview of TE Connectivity Ltd.’s key financial scores to assist in evaluating its investment profile:
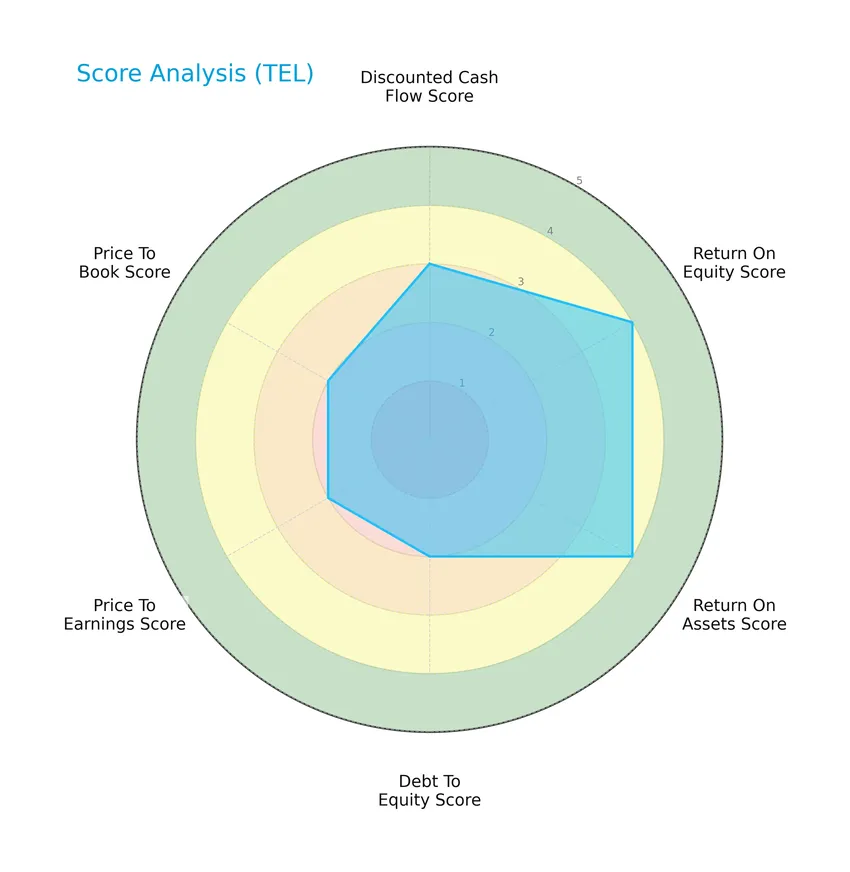
TE Connectivity shows favorable returns on equity and assets with scores of 4 each, while discounted cash flow is moderate at 3. Debt-to-equity, price-to-earnings, and price-to-book ratios all hold moderate scores of 2, indicating balanced but cautious financial metrics.
Analysis of the company’s bankruptcy risk
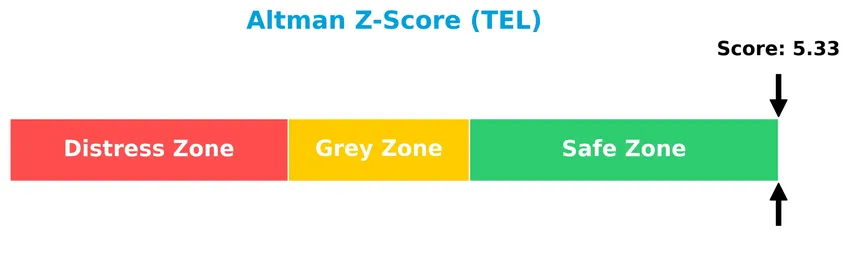
TE Connectivity’s Altman Z-Score places it firmly in the safe zone, indicating low bankruptcy risk and solid financial stability:
Is the company in good financial health?
The Piotroski diagram below illustrates TE Connectivity’s solid financial health status based on its score:
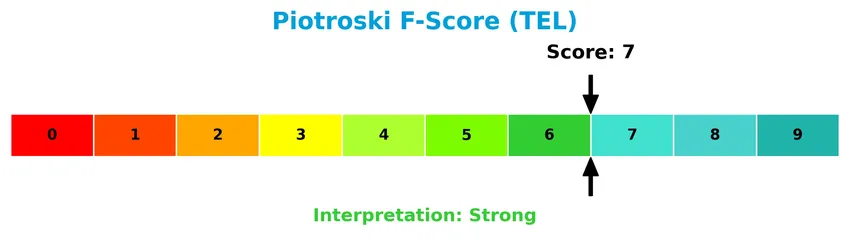
With a Piotroski Score of 7, TE Connectivity demonstrates strong financial strength, suggesting effective management of profitability, leverage, and efficiency metrics.
Competitive Landscape & Sector Positioning
This sector analysis will examine TE Connectivity Ltd.’s strategic positioning, revenue segments, key products, main competitors, and competitive advantages. I will assess whether the company holds a distinct competitive advantage over its industry peers.
Strategic Positioning
TE Connectivity Ltd. maintains a diversified product portfolio across three segments: Transportation, Industrial, and Communications Solutions, with Transportation Solutions leading revenue at $9.4B in 2025. Geographically, its exposure spans approximately 140 countries, with significant sales in China ($4.6B), the U.S. ($4.4B), and Continental Europe ($3.9B), reflecting a broad global footprint.
Revenue by Segment
This pie chart illustrates TE Connectivity Ltd.’s revenue distribution by product segments for the fiscal year 2025.
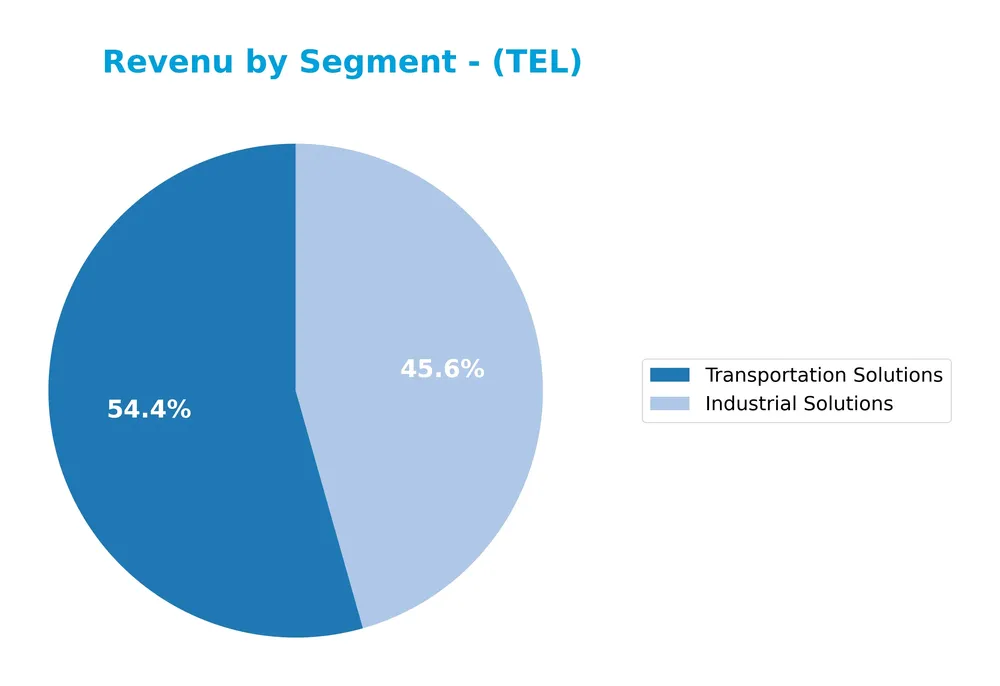
In 2025, TE Connectivity’s revenue was primarily driven by Transportation Solutions at 9.4B and Industrial Solutions at 7.9B. These two segments dominate the business, reflecting strong demand in transportation-related connectivity and industrial applications. Compared to previous years, Transportation Solutions showed steady growth, while Industrial Solutions also increased, indicating a solid expansion in core segments with limited exposure to smaller categories. This concentration suggests focused risk but stable segment leadership.
Key Products & Brands
The table below outlines TE Connectivity Ltd.’s key products and brand segments with their respective descriptions:
| Product | Description |
|---|---|
| Transportation Solutions | Provides terminals, connector systems and components, sensors, relays, antennas, heat shrink tubing, and application tooling for automotive, commercial transportation, and sensor markets. |
| Industrial Solutions | Offers terminals, connector systems and components; heat shrink tubing, interventional medical components, relays, and wires and cables for aerospace, defense, oil and gas, industrial equipment, medical, and energy markets. |
| Communications Solutions | Supplies electronic components including terminals, connector systems and components, relays, heat shrink tubing, and antennas for data devices and appliances markets. |
TE Connectivity’s product portfolio is organized mainly into three segments, catering to diverse industries from automotive to medical and communications, reflecting its broad market reach and specialized offerings.
Main Competitors
There are 20 competitors in total, with the table below listing the top 10 leaders by market capitalization:
| Competitor | Market Cap. |
|---|---|
| Amphenol Corporation | 171B |
| Corning Incorporated | 78B |
| TE Connectivity Ltd. | 69B |
| Sandisk Corporation | 40B |
| Garmin Ltd. | 39B |
| Keysight Technologies, Inc. | 35B |
| Celestica Inc. | 34B |
| Coherent, Inc. | 29B |
| Jabil Inc. | 26B |
| Teledyne Technologies Incorporated | 24B |
TE Connectivity Ltd. ranks 3rd among 20 competitors, with a market cap 38.51% the size of the leader, Amphenol Corporation. It stands above both the average market cap of the top 10 (54.4B) and the sector median (21.6B). The company maintains a competitive edge with an 18.05% gap to the next competitor above it, underscoring its strong position in the hardware, equipment, and parts industry.
Comparisons with competitors
Check out how we compare the company to its competitors:
Does TE Connectivity Ltd. have a competitive advantage?
TE Connectivity Ltd. currently does not present a competitive advantage, as its return on invested capital (ROIC) is below its weighted average cost of capital (WACC), indicating value destruction and declining profitability. The company’s ROIC trend over the 2021-2025 period is negative, reflecting worsening efficiency in capital use.
Looking ahead, TE Connectivity operates across diverse segments and geographies, which may offer opportunities in transportation, industrial, and communications sectors. Its broad market presence in approximately 140 countries could support growth through new products or expanded market penetration despite current challenges in profitability.
SWOT Analysis
This SWOT analysis highlights TE Connectivity Ltd.’s key internal and external factors to guide investment decisions.
Strengths
- diversified global presence
- strong gross and EBIT margins
- favorable liquidity ratios
Weaknesses
- declining net income and EPS over recent years
- high PE and PB ratios
- negative ROIC trend and value destruction
Opportunities
- growth in automotive and industrial IoT sectors
- expansion in Asia-Pacific markets
- increasing demand for connectivity solutions
Threats
- intense competition in hardware and sensor markets
- supply chain disruptions
- economic slowdown impacting key end markets
Overall, TE Connectivity demonstrates strong operational margins and liquidity but faces challenges from declining profitability and valuation concerns. Strategically, focusing on innovation and market expansion while managing costs and competitive pressures is crucial for sustainable growth.
Stock Price Action Analysis
The following weekly chart illustrates TE Connectivity Ltd. (TEL) stock price movements over the last 12 months, highlighting key fluctuations and trend phases:
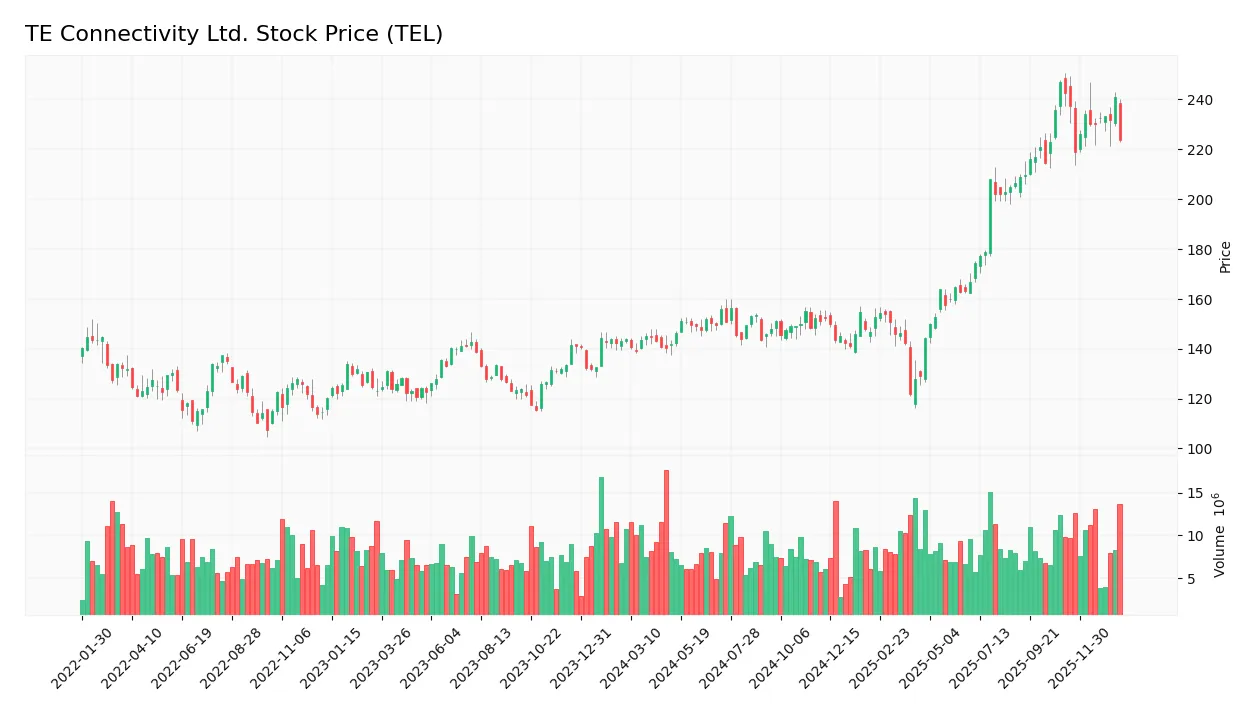
Trend Analysis
Over the past 12 months, TEL’s stock price increased by 55.73%, indicating a bullish trend. The price ranged between 122.0 and a peak of 247.01, with overall trend decelerating despite significant gains. Recent weeks show a short-term decline of -7.66% from November 2025 to January 2026, reflecting a slight negative slope.
Volume Analysis
In the last three months, trading volume increased, but sellers dominated with 69.43% of activity, signaling a seller-driven market. This shift suggests cautious investor sentiment and reduced buying interest despite overall volume growth, reflecting a possible short-term pullback phase.
Target Prices
The consensus target prices for TE Connectivity Ltd. (TEL) suggest a positive outlook from analysts.
| Target High | Target Low | Consensus |
|---|---|---|
| 306 | 238 | 270.33 |
Analysts expect TEL’s stock price to range between 238 and 306, with an average target around 270, indicating moderate upside potential.

Don’t Let Luck Decide Your Entry Point
Optimize your entry points with our advanced ProRealTime indicators. You’ll get efficient buy signals with precise price targets for maximum performance. Start outperforming now!
Analyst & Consumer Opinions
This section examines recent analyst ratings and consumer feedback regarding TE Connectivity Ltd. (TEL) to provide insight.
Stock Grades
Here is a summary of the latest verified stock grades for TE Connectivity Ltd. from recognized analysts and grading firms:
| Grading Company | Action | New Grade | Date |
|---|---|---|---|
| Barclays | Maintain | Overweight | 2026-01-23 |
| Wells Fargo | Maintain | Equal Weight | 2026-01-22 |
| Truist Securities | Maintain | Hold | 2026-01-22 |
| UBS | Maintain | Buy | 2026-01-14 |
| Truist Securities | Maintain | Hold | 2025-12-19 |
| Wells Fargo | Maintain | Equal Weight | 2025-12-09 |
| Barclays | Maintain | Overweight | 2025-11-21 |
| Truist Securities | Maintain | Hold | 2025-11-21 |
| TD Cowen | Maintain | Buy | 2025-11-17 |
| Barclays | Maintain | Overweight | 2025-11-04 |
The overall trend shows consistent maintenance of previous ratings with a balance between Buy/Overweight and Hold/Equal Weight grades. This indicates a stable outlook with some analysts favoring moderate optimism while others suggest caution.
Consumer Opinions
Consumer sentiment about TE Connectivity Ltd. reflects a balance of appreciation for product quality and concerns regarding customer service.
| Positive Reviews | Negative Reviews |
|---|---|
| High-quality, durable connectors that meet industry standards. | Customer support response times can be slow. |
| Reliable performance in harsh environments praised by many users. | Pricing is perceived as slightly high compared to competitors. |
| Wide product range offering innovative solutions. | Some complaints about shipment delays. |
Overall, consumers consistently value TE Connectivity’s robust and innovative products, while service speed and pricing remain areas for potential improvement.
Risk Analysis
Below is a summary table outlining the key risks associated with TE Connectivity Ltd., highlighting their probability and potential impact:
| Category | Description | Probability | Impact |
|---|---|---|---|
| Market Risk | Price volatility due to sector beta of 1.24 and recent 3.25% price decline amid tech shifts. | Medium | High |
| Valuation Risk | Elevated P/E of 35 and P/B of 5.12 suggest possible overvaluation concerns. | High | Medium |
| Operational Risk | Global supply chain disruptions affecting manufacturing and delivery across 140 countries. | Medium | High |
| Competitive Risk | Intense competition in connectivity and sensor solutions markets could pressure margins. | Medium | Medium |
| Financial Risk | Moderate debt-to-equity ratio (0.52) but strong interest coverage (42.6) reduces risk. | Low | Low |
| Regulatory Risk | Exposure to varying international regulations, especially in industrial and transportation sectors. | Medium | Medium |
The highest risks stem from market volatility and valuation pressures, given TEL’s elevated P/E ratio and recent share price pullback. Operational challenges remain relevant due to its extensive global footprint. However, strong liquidity and financial health, as indicated by a safe Altman Z-score (5.33) and a solid Piotroski score (7), help mitigate bankruptcy concerns. Overall, risks require cautious monitoring but are balanced by favorable financial stability.
Should You Buy TE Connectivity Ltd.?
TE Connectivity Ltd. appears to be navigating a challenging profitability landscape with declining returns on invested capital, suggesting an eroding competitive moat. Despite a manageable leverage profile and a moderate overall rating of B, its financial health could be seen as cautiously favorable yet warrants close risk monitoring.
Strength & Efficiency Pillars
TE Connectivity Ltd. exhibits solid financial health with an Altman Z-Score of 5.33, placing it comfortably in the safe zone, and a strong Piotroski Score of 7, indicating robust fundamentals. Profitability metrics are generally favorable, with a net margin of 10.78% and an EBIT margin of 19.2%. Return on equity is neutral at 14.64%, and return on invested capital (ROIC) stands at 8.82%, just below the weighted average cost of capital (WACC) at 9.13%, signaling that the company is currently not creating value but maintaining operational efficiency. Liquidity ratios such as a current ratio of 1.56 and interest coverage of 42.61 further underscore financial stability.
Weaknesses and Drawbacks
Valuation metrics highlight some concerns, with a relatively high price-to-earnings ratio of 35.0 and a price-to-book ratio of 5.12, both marked as unfavorable, suggesting the stock is trading at a premium that may not be fully justified by fundamentals. Additionally, the recent net margin growth over one year is negative at -46.51%, accompanied by a -40.37% decline in EPS growth, reflecting pressure on profitability. The recent market trend is seller-dominant, with buyers only accounting for 30.57% of volume since November 2025, indicating short-term headwinds. Moderate leverage with a debt-to-equity ratio of 0.52 also warrants careful monitoring.
Our Verdict about TE Connectivity Ltd.
TE Connectivity Ltd. presents a fundamentally favorable long-term profile characterized by strong financial health and decent profitability. However, despite a bullish overall stock trend with a 55.73% price appreciation, recent seller dominance and negative earnings momentum suggest caution. Therefore, while the company’s profile might appear attractive for long-term exposure, current market pressures could warrant a wait-and-see approach for a better entry point, especially given the premium valuation and declining profitability metrics.
Disclaimer: This content is for informational purposes only and does not constitute financial, investment, or other professional advice. Investing in financial markets involves a significant risk of loss, and past performance is not indicative of future results.
Additional Resources
- Strs Ohio Has $43.47 Million Stock Holdings in TE Connectivity Ltd. $TEL – MarketBeat (Jan 24, 2026)
- TE Connectivity plc (TEL) Benefitted from Secular Trends in Its Automotive and Industrial Sectors – Yahoo Finance (Jan 12, 2026)
- TE Connectivity Ltd. (NYSE:TEL) Q1 2026 Earnings Call Transcript – Insider Monkey (Jan 22, 2026)
- TE Connectivity: Fiscal Q1 Earnings Snapshot – kare11.com (Jan 21, 2026)
- TE Connectivity Earnings Call Highlights AI-Fueled Surge – The Globe and Mail (Jan 23, 2026)
For more information about TE Connectivity Ltd., please visit the official website: te.com