Home > Analyses > Consumer Defensive > Target Corporation
Target Corporation transforms everyday shopping into an experience that blends convenience, variety, and value. It commands the discount retail sector with a vast network of nearly 2,000 stores and a growing digital presence. Known for its curated product mix and in-store amenities, Target sets the standard for customer engagement and innovation. As the retail landscape evolves, I question whether Target’s fundamentals still support its current market valuation and growth trajectory.

Table of contents
Business Model & Company Overview
Target Corporation, founded in 1902 and headquartered in Minneapolis, Minnesota, stands as a dominant player in the U.S. discount retail sector. Its ecosystem blends diverse product categories—from perishables and apparel to electronics and household essentials—anchored by in-store amenities like Target Café and Starbucks. This cohesive approach crafts a unified shopping experience that resonates with millions of customers across approximately 2,000 stores.
The company’s revenue engine balances robust physical retail with growing digital channels, including Target.com. This dual approach fuels sales across the Americas, supported by a strategic footprint. Target’s competitive advantage lies in its ability to integrate product variety, convenience, and brand partnerships, creating a resilient economic moat that shapes the future of general merchandise retail.
Financial Performance & Fundamental Metrics
I will analyze Target Corporation’s income statement, key financial ratios, and dividend payout policy to reveal its operational strength and shareholder return strategy.
Income Statement
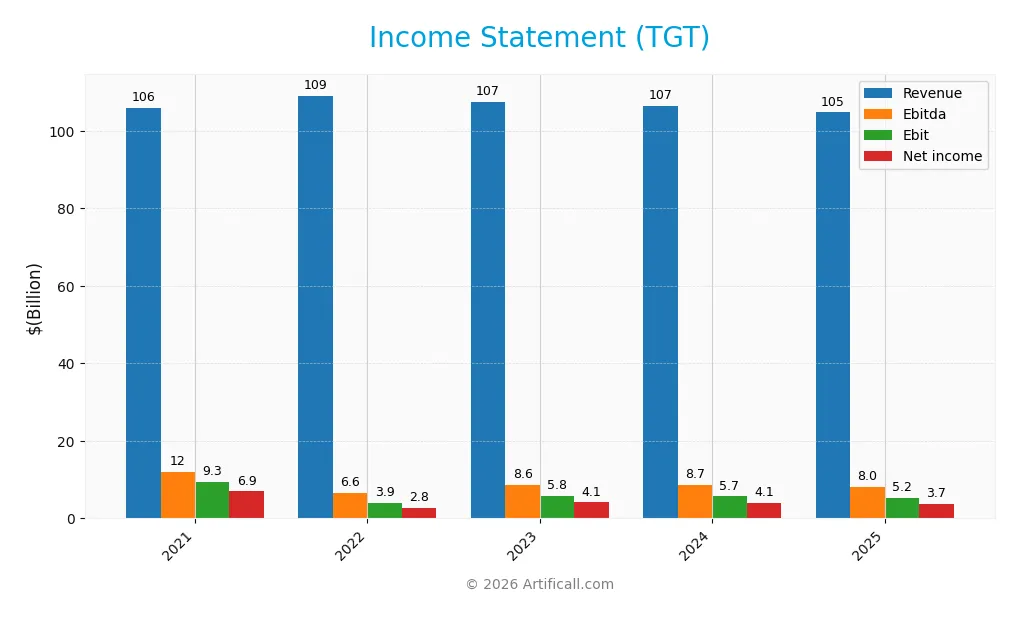
The table below summarizes Target Corporation’s key income statement figures over the past five fiscal years, highlighting revenue trends and profitability metrics.
| 2021 | 2022 | 2023 | 2024 | 2025 | |
|---|---|---|---|---|---|
| Revenue | 106B | 109B | 107B | 107B | 105B |
| Cost of Revenue | 75B | 82B | 78B | 77B | 76B |
| Operating Expenses | 22B | 23B | 24B | 24B | 24B |
| Gross Profit | 31B | 27B | 30B | 30B | 29B |
| EBITDA | 12B | 6.6B | 8.6B | 8.7B | 8.0B |
| EBIT | 9.3B | 3.9B | 5.8B | 5.7B | 5.2B |
| Interest Expense | 421M | 478M | 502M | 411M | 445M |
| Net Income | 6.9B | 2.8B | 4.1B | 4.1B | 3.7B |
| EPS | 14.23 | 6.02 | 8.96 | 8.89 | 8.16 |
| Filing Date | 2022-03-09 | 2023-03-08 | 2024-03-13 | 2025-03-12 | 2026-03-11 |
Income Statement Evolution
Target’s revenue declined slightly by 1.7% in 2025, continuing a subtle downward trend since 2021. Gross profit and operating expenses followed suit, both shrinking by around 2.6% and 1.7% respectively. Margins showed stability with a gross margin near 28%, but EBIT and net margins contracted, signaling pressure on profitability.
Is the Income Statement Favorable?
In 2025, Target reported $105B in revenue and $3.7B net income, yielding a 3.5% net margin—classified as neutral but trending lower year-over-year. EBIT margin held at 5%, also neutral, while interest expense remained low at 0.42% of revenue, a favorable factor. Overall, fundamentals reflect challenges with declining profitability and earnings growth across the period.
Financial Ratios
The table below summarizes Target Corporation’s key financial ratios from 2021 to 2025, reflecting profitability, leverage, liquidity, and valuation metrics:
| Ratios | 2021 | 2022 | 2023 | 2024 | 2025 |
|---|---|---|---|---|---|
| Net Margin | 6.6% | 2.5% | 3.9% | 3.8% | 3.5% |
| ROE | 54.2% | 24.8% | 30.8% | 27.9% | 22.9% |
| ROIC | 21.5% | 9.1% | 11.9% | 11.1% | 9.8% |
| P/E | 15.3 | 28.0 | 16.2 | 15.5 | 12.9 |
| P/B | 8.28 | 6.93 | 4.99 | 4.33 | 2.96 |
| Current Ratio | 0.99 | 0.92 | 0.91 | 0.94 | 0.94 |
| Quick Ratio | 0.35 | 0.22 | 0.29 | 0.32 | 0.36 |
| D/E | 1.28 | 1.70 | 1.46 | 1.36 | 0.35 |
| Debt-to-Assets | 31% | 36% | 35% | 34% | 9% |
| Interest Coverage | 21.2 | 8.1 | 11.4 | 13.5 | 11.5 |
| Asset Turnover | 2.0 | 2.0 | 1.9 | 1.8 | 1.8 |
| Fixed Asset Turnover | 3.4 | 3.2 | 2.9 | 2.9 | 2.8 |
| Dividend Yield | 1.5% | 2.4% | 3.0% | 3.2% | 4.3% |
Evolution of Financial Ratios
From 2021 to 2025, Target’s Return on Equity (ROE) showed a declining trend, falling from 54.15% in 2021 to 22.92% in 2025. The Current Ratio remained consistently below 1.0, indicating persistently tight liquidity. Meanwhile, the Debt-to-Equity Ratio improved markedly, decreasing from 1.28 in 2021 to 0.35 in 2025, signaling reduced leverage. Profitability margins stabilized but at lower levels by 2025.
Are the Financial Ratios Fovorable?
In 2025, profitability measured by ROE (22.92%) and price-to-earnings ratio (12.93) are favorable, reflecting efficient capital use and reasonable valuation. However, net profit margin (3.54%) and liquidity ratios, including Current Ratio (0.94) and Quick Ratio (0.36), are unfavorable, raising caution on cash management. Leverage ratios such as Debt-to-Equity (0.35) and Interest Coverage (11.71) are favorable, denoting manageable debt. Overall, the ratios appear slightly favorable with notable liquidity risks.
Shareholder Return Policy
Target Corporation maintains a consistent dividend policy with a payout ratio around 50-55%, delivering a 4.3% yield in 2025. Dividends per share have steadily increased, and share buybacks complement distributions, supported by free cash flow coverage above 1.1x, indicating prudent capital allocation.
The dividend and buyback strategy aligns with sustainable shareholder returns, balancing growth investments and cash returns. While the payout ratio is moderate, maintaining coverage by free cash flow reduces risk of over-distribution, supporting long-term value creation for investors.
Score analysis
The following radar chart presents a comprehensive overview of Target Corporation’s key financial scores:
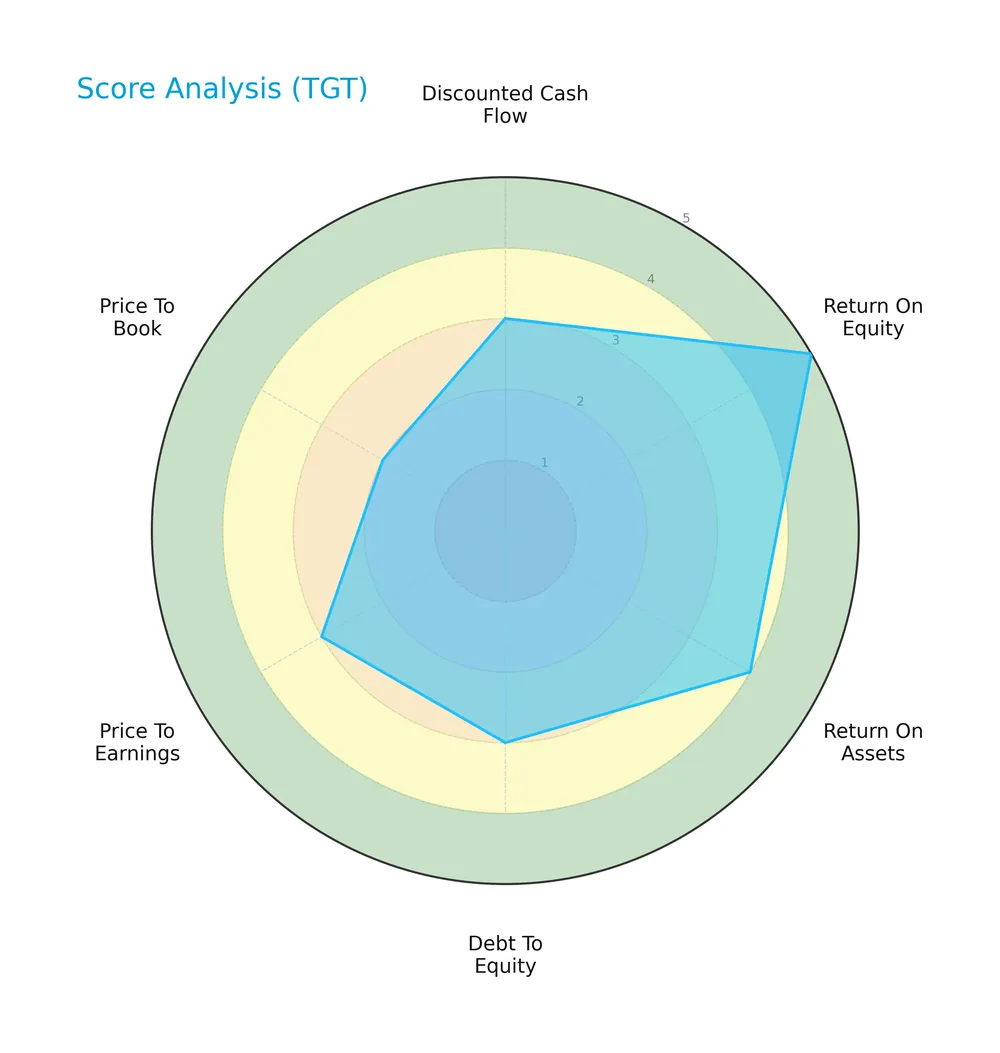
Target’s return on equity scores very favorably at 5, indicating strong shareholder returns. Return on assets is favorable at 4, showing efficient asset use. Debt-to-equity and price-to-earnings scores are moderate at 3. Discounted cash flow and price-to-book scores lag with unfavorable ratings of 2.
Analysis of the company’s bankruptcy risk
Target’s Altman Z-Score places it safely in the low bankruptcy risk zone, signaling strong financial stability:

Is the company in good financial health?
The Piotroski Score diagram illustrates Target’s moderate financial strength based on profitability, leverage, and efficiency metrics:
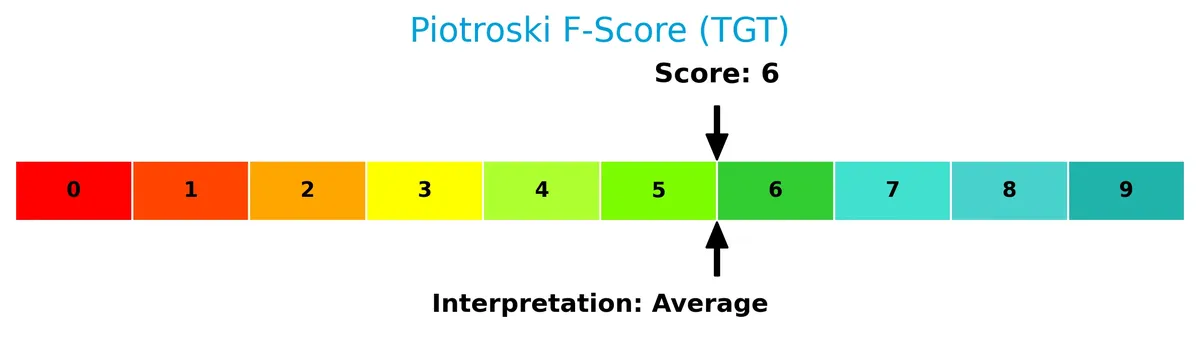
With a score of 6 categorized as average, Target shows reasonable financial health but leaves room for improvement to reach a stronger position.
Competitive Landscape & Sector Positioning
This section examines Target Corporation’s strategic positioning, revenue breakdown, key products, and competitive environment. I will evaluate whether Target holds a competitive advantage over its main rivals in the discount retail sector.
Strategic Positioning
Target Corporation maintains a concentrated geographic focus exclusively in the United States. Its product portfolio spans diverse categories, including food, apparel, beauty, home furnishings, and hardlines, reflecting a broad merchandise mix typical of discount retailers.
Revenue by Segment
The pie chart illustrates Target Corporation’s revenue distribution by segment for fiscal year 2025, highlighting key product categories that contribute to the company’s total sales.
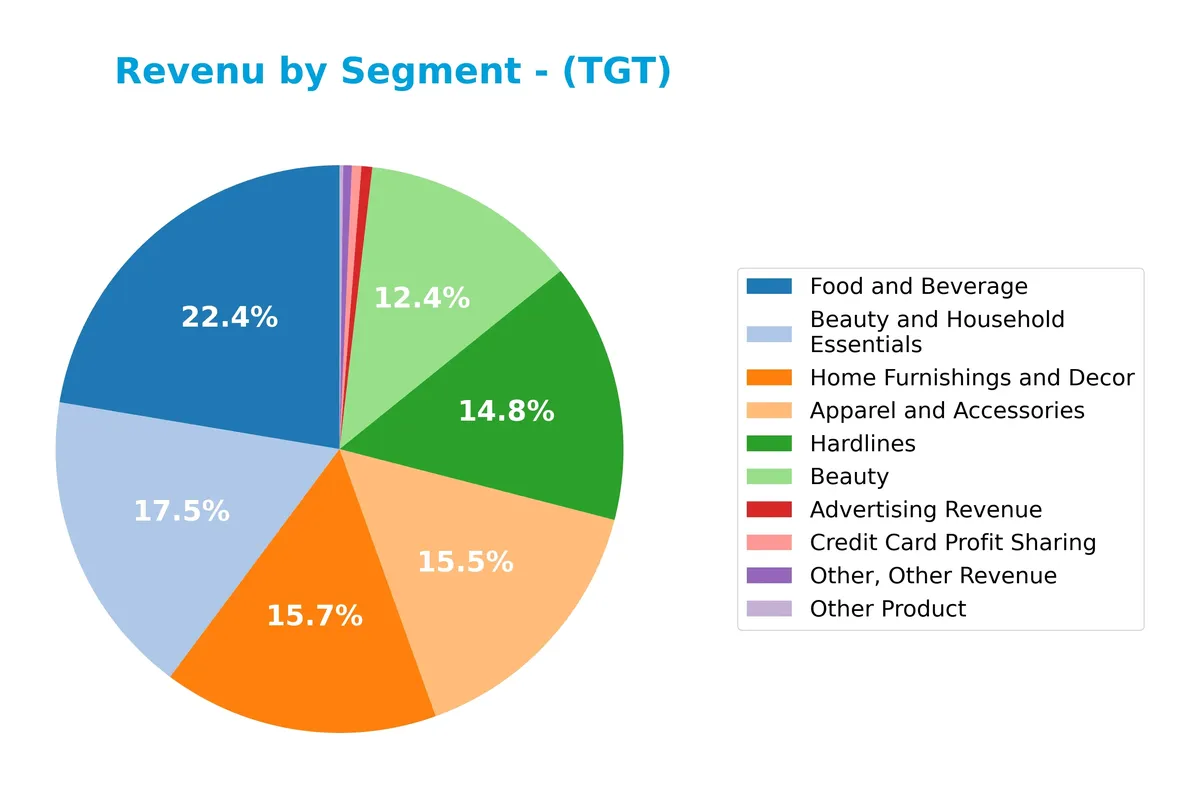
In 2025, Food and Beverage leads with $24.1B, followed closely by Beauty and Household Essentials at $18B, and Hardlines at $15.8B. Home Furnishings and Decor also remains significant at $15.6B. Advertising Revenue and Credit Card Profit Sharing are smaller but growing streams. The data shows a slight shift toward essential goods, reflecting consumer prioritization amid economic pressures and signaling concentration risks in a few large segments.
Key Products & Brands
The following table outlines Target Corporation’s principal product categories and brands:
| Product | Description |
|---|---|
| Food and Beverage | Includes perishables, dry grocery, dairy, frozen items, and other food assortments. |
| Apparel and Accessories | Clothing and related fashion accessories sold across stores and digital channels. |
| Beauty and Household Essentials | Beauty products and daily household necessities forming a significant revenue segment. |
| Hardlines | Electronics, toys, seasonal offerings, and other general merchandise outside apparel and food. |
| Home Furnishings and Decor | Home décor products, furniture, and related household items. |
| Advertising Revenue | Income generated from advertising on Target’s platforms and stores. |
| Credit Card Profit Sharing | Revenue from partnerships related to Target’s credit card programs. |
| Other Product | Miscellaneous product sales not classified under main categories. |
Target’s product mix spans essential consumer goods and discretionary categories. Food and Beverage and Beauty and Household Essentials dominate revenue, reflecting the company’s broad general merchandise retail model.
Main Competitors
There are 6 main competitors in the Discount Stores industry; the table lists the top 6 leaders by market capitalization:
| Competitor | Market Cap. |
|---|---|
| Walmart Inc. | 899B |
| Costco Wholesale Corporation | 379B |
| Target Corporation | 46B |
| Dollar General Corporation | 30B |
| Dollar Tree, Inc. | 27B |
| BJ’s Wholesale Club Holdings, Inc. | 12B |
Target Corporation ranks 3rd among its 6 main competitors. Its market cap is just 6.03% of the leader Walmart, showing a significant scale gap. Target sits below the average market cap of the top 10 competitors (232B) but above the sector median (38B). It holds a commanding 599% market cap lead over its nearest competitor above.
Comparisons with competitors
Check out how we compare the company to its competitors:
Does Target have a competitive advantage?
Target currently does not demonstrate a competitive advantage, as its return on invested capital (ROIC) is below its cost of capital (WACC), indicating value destruction and declining profitability. The company’s ROIC trend is negative, reflecting weakening efficiency in capital use over 2021-2025.
Looking ahead, Target’s broad product assortment and digital channels offer opportunities to expand market reach and enhance customer experience. However, recent unfavorable revenue and profit growth suggest challenges in leveraging these opportunities to rebuild sustained competitive strength.
SWOT Analysis
This SWOT analysis highlights Target Corporation’s core strategic factors to guide investment decisions.
Strengths
- Strong brand recognition
- Robust ROE at 22.9%
- Favorable dividend yield at 4.3%
Weaknesses
- Declining revenue over past years
- Low current and quick ratios signal liquidity risks
- ROIC below WACC indicates value erosion
Opportunities
- Expansion of digital channels
- Growth in private label products
- Enhanced in-store customer experiences
Threats
- Intense discount retail competition
- Economic downturns reducing consumer spending
- Supply chain disruptions impacting inventory
Target’s strengths in brand and profitability provide a stable base, but weakened margins and growth trends require strategic focus. The company must leverage digital and private label growth while managing liquidity and competitive pressures carefully.
Stock Price Action Analysis
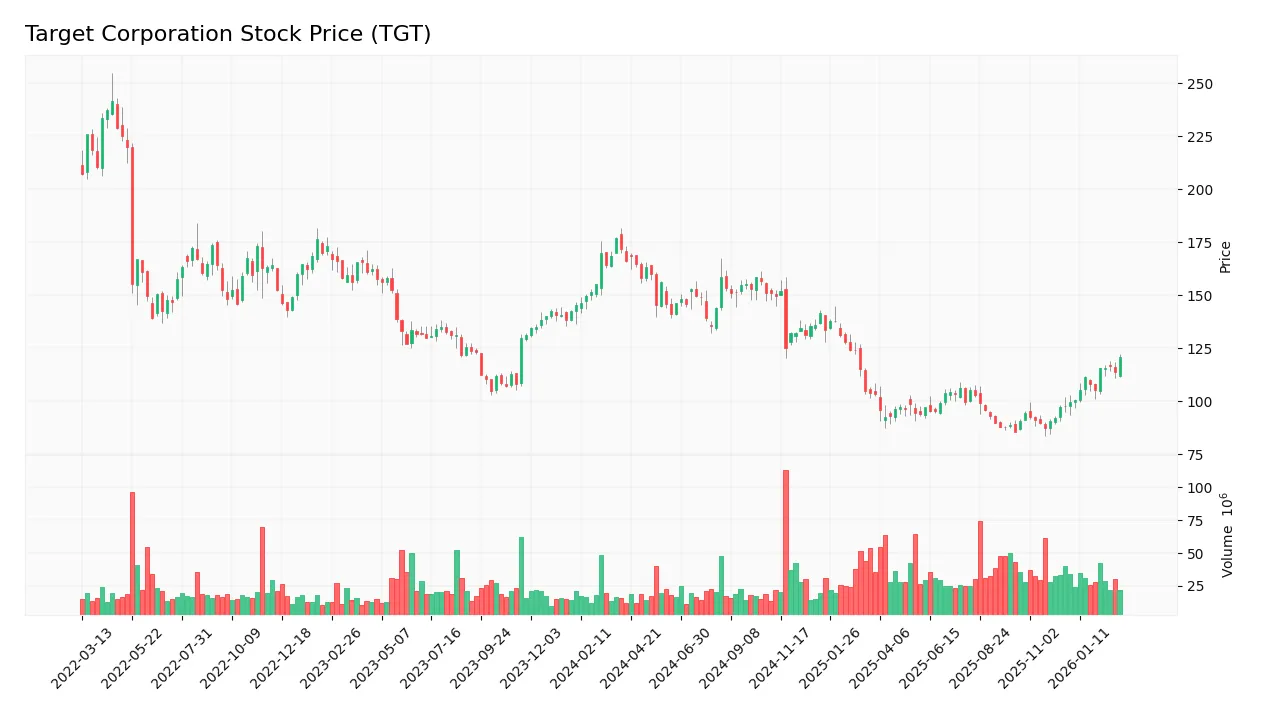
The following weekly stock chart for Target Corporation illustrates price action over the past 12 months, highlighting key fluctuations and trend shifts:
Trend Analysis
Over the past 12 months, Target’s stock declined by 24.17%, indicating a bearish trend with accelerating downward momentum. The price fluctuated widely, reaching a high of 163.13 and a low of 85.53, with volatility reflected in a 24.07 standard deviation. Recent months show a 13.57% rebound, suggesting a short-term recovery.
Volume Analysis
Trading volume has increased, with a total of 3.42B shares exchanged over the past year. Recently, buyer volume dominates at 60.44%, signaling buyer-driven activity from January to March 2026. This shift suggests growing investor interest and stronger market participation favoring accumulation.
Target Prices
Analysts present a clear consensus on Target Corporation’s valuation, reflecting moderate upside potential.
| Target Low | Target High | Consensus |
|---|---|---|
| 81 | 145 | 114.06 |
The target prices indicate expectations for a trading range between $81 and $145, with an average consensus near $114, suggesting cautious optimism among analysts.

Don’t Let Luck Decide Your Entry Point
Optimize your entry points with our advanced ProRealTime indicators. You’ll get efficient buy signals with precise price targets for maximum performance. Start outperforming now!
Analyst & Consumer Opinions
This section examines Target Corporation’s recent analyst ratings alongside consumer feedback to provide balanced insight.
Stock Grades
Below is a summary of recent stock grades from leading financial institutions for Target Corporation:
| Grading Company | Action | New Grade | Date |
|---|---|---|---|
| DA Davidson | Maintain | Buy | 2026-03-10 |
| Evercore ISI Group | Maintain | In Line | 2026-03-05 |
| Mizuho | Maintain | Neutral | 2026-03-05 |
| JP Morgan | Maintain | Neutral | 2026-03-05 |
| Telsey Advisory Group | Upgrade | Outperform | 2026-03-04 |
| Morgan Stanley | Maintain | Overweight | 2026-03-04 |
| Citigroup | Maintain | Neutral | 2026-03-04 |
| Truist Securities | Maintain | Hold | 2026-03-04 |
| BNP Paribas | Maintain | Underperform | 2026-03-04 |
| Oppenheimer | Maintain | Outperform | 2026-03-04 |
The consensus reveals a balanced view, with a slight tilt toward cautious optimism. Most firms maintain neutral or hold ratings, while a few have upgraded to outperform or buy, reflecting mixed but generally stable sentiment.
Consumer Opinions
Consumer sentiment around Target Corporation reflects a blend of appreciation for convenience and concerns over recent service consistency.
| Positive Reviews | Negative Reviews |
|---|---|
| “Target’s product selection is excellent and diverse.” | “Long checkout lines have become frustrating.” |
| “Clean stores and friendly staff enhance my shopping.” | “Some locations struggle with stock shortages.” |
| “Great deals and promotions keep me coming back.” | “Online orders sometimes arrive late or incorrect.” |
Overall, shoppers praise Target’s variety and store experience but frequently note operational issues like stocking and checkout delays. These weaknesses could impact brand loyalty if not addressed promptly.
Risk Analysis
Below is a table summarizing the key risks impacting Target Corporation’s financial and operational outlook:
| Category | Description | Probability | Impact |
|---|---|---|---|
| Liquidity Risk | Current ratio at 0.94 and quick ratio 0.36 indicate tight short-term liquidity. | High | Moderate |
| Profitability Risk | Net margin is low at 3.54%, signaling pressure on earnings despite solid ROE of 22.92%. | Moderate | High |
| Market Volatility | Beta of 1.105 suggests sensitivity to market swings, affecting stock price stability. | Moderate | Moderate |
| Competitive Pressure | Intense competition in discount retail limits pricing power and margin expansion. | High | High |
| Leverage Risk | Debt-to-equity ratio of 0.35 is manageable, but must be monitored amid economic shifts. | Low | Low |
I observe that liquidity constraints pose the most immediate concern, given Target’s current ratio below 1. Profitability pressure from narrow net margins also stands out, especially as industry peers often achieve higher profitability. However, Target’s solid Altman Z-Score (3.05) reassures financial stability. Investors should weigh these risks carefully in 2026’s challenging retail environment.
Should You Buy Target Corporation?
Target Corporation appears to be a moderately profitable company with declining operational efficiency, reflected in a slightly unfavorable moat due to value erosion. Despite a manageable leverage profile and safe Altman Z-Score, its overall B+ rating suggests cautious optimism.
Strength & Efficiency Pillars
Target Corporation posts a favorable return on equity at 22.92%, reflecting solid profitability. The net margin, though only 3.54%, remains stable in a challenging retail environment. ROIC stands at 9.85%, slightly above the WACC of 8.99%, signaling modest value creation. Interest coverage at 11.71 times and asset turnover of 1.76 confirm operational efficiency. These metrics show the company is managing capital well despite margin pressures.
Weaknesses and Drawbacks
Target faces notable headwinds with declining revenue and profit growth over the past year and longer term. The gross margin is favorable at 27.93%, but net margin and EPS growth are negative, signaling margin compression and profitability challenges. The current ratio of 0.94 indicates liquidity concerns, falling below the safe threshold of 1. The price-to-book ratio near 3.0 suggests a stretched valuation relative to book value, adding risk amid bearish overall market trends and seller dominance historically.
Our Final Verdict about Target Corporation
Target’s fundamental profile appears mixed, with operational strengths offset by shrinking profitability and liquidity risks. Despite a safe Altman Z-Score of 3.05, recent bearish price trends and moderate valuation caution suggest prudence. However, the recent buyer dominance and improving short-term price slope may indicate a tentative recovery. Overall, the stock might appear suitable for investors with a tolerance for volatility but calls for a measured, wait-and-see approach.
Disclaimer: This content is for informational purposes only and does not constitute financial, investment, or other professional advice. Investing in financial markets involves a significant risk of loss, and past performance is not indicative of future results.
Additional Resources
- Waycross Partners LLC Sells 150,749 Shares of Target Corporation $TGT – MarketBeat (Mar 28, 2026)
- Investors heavily search Target Corporation (TGT): Here is what you need to know – MSN (Mar 23, 2026)
- Target Corporation Reports Fourth Quarter and Full-Year 2025 Earnings – PR Newswire (Mar 03, 2026)
- Target Stock Is Down 15% This Year. Here’s Why Growth Concerns Persist – TIKR.com (Mar 24, 2026)
- Target Corporation – Britannica (Mar 17, 2026)
For more information about Target Corporation, please visit the official website: corporate.target.com