Home > Analyses > Energy > Targa Resources Corp.
Targa Resources Corp. powers the flow of energy that fuels North America’s homes and industries. As a dominant player in oil and gas midstream, it commands an extensive network of pipelines and processing plants, setting industry standards for operational efficiency and innovation. Its integrated services in natural gas and liquids position it for steady demand amid energy transitions. The key question remains: can Targa’s robust asset base and strategy sustain its premium valuation in evolving markets?
Table of contents
Business Model & Company Overview
Targa Resources Corp., founded in 2005 and headquartered in Houston, TX, dominates the Oil & Gas Midstream sector with a vast ecosystem of midstream energy assets. Its core business integrates gathering, processing, and transportation of natural gas, NGLs, and crude oil, creating a seamless energy supply chain. This integrated approach positions Targa as a critical backbone in North America’s energy infrastructure.
The company’s revenue engine balances recurring fees from 28,400 miles of pipelines and 42 processing plants with logistics and transportation services across the Americas. It supports global energy flows through NGL balancing and export services, backed by 76M barrels of storage capacity. Targa’s robust asset network and scale form a formidable economic moat, shaping the future of midstream energy logistics.
Financial Performance & Fundamental Metrics
I analyze Targa Resources Corp.’s income statement, key financial ratios, and dividend payout policy to assess its underlying financial health and value proposition.
Income Statement
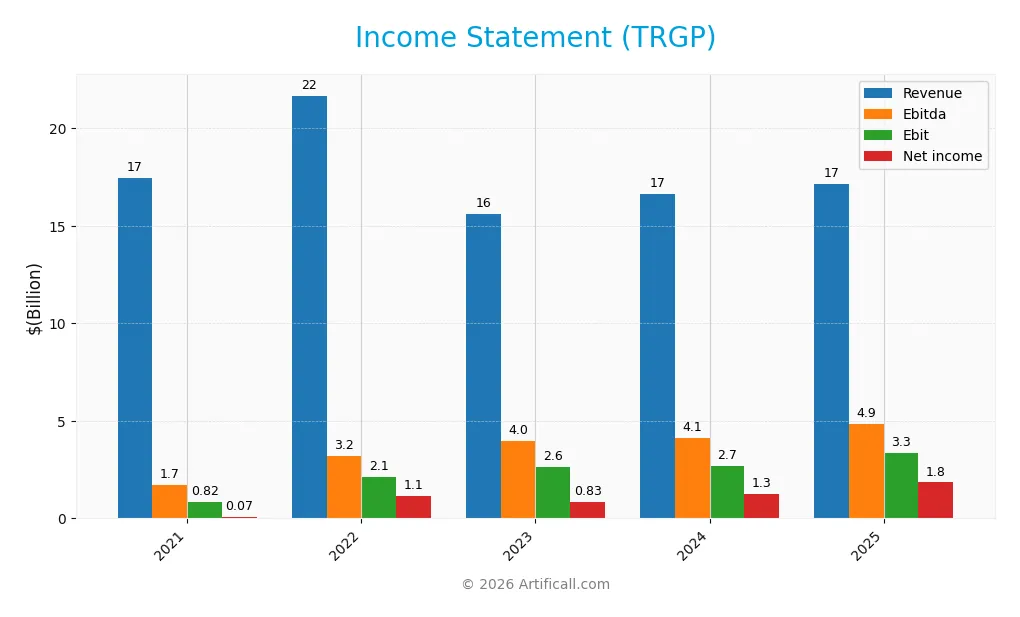
The table below summarizes Targa Resources Corp.’s key income statement figures for fiscal years 2021 through 2025, reflecting revenue growth and profitability trends.
| 2021 | 2022 | 2023 | 2024 | 2025 | |
|---|---|---|---|---|---|
| Revenue | 17.4B | 21.7B | 15.6B | 16.6B | 17.1B |
| Cost of Revenue | 15.3B | 18.9B | 13.1B | 13.3B | 12.6B |
| Operating Expenses | 273M | 310M | 349M | 381M | 1.10B |
| Gross Profit | 2.1B | 2.8B | 2.5B | 3.3B | 4.5B |
| EBITDA | 1.7B | 3.2B | 4.0B | 4.1B | 4.9B |
| EBIT | 825M | 2.1B | 2.6B | 2.7B | 3.3B |
| Interest Expense | 388M | 446M | 688M | 767M | 853M |
| Net Income | 71M | 1.1B | 828M | 1.3B | 1.8B |
| EPS | -0.07 | 3.95 | 3.69 | 5.77 | 8.54 |
| Filing Date | 2022-02-24 | 2023-02-22 | 2024-02-15 | 2025-02-20 | 2026-02-19 |
Income Statement Evolution
From 2021 to 2025, Targa Resources’ revenue showed slight volatility, declining overall by 1.7%. However, gross profit surged 36.6% in the latest year, lifting gross margins to a favorable 26.5%. EBIT and net income margins also improved, reflecting better operational efficiency and stronger profitability despite modest revenue growth.
Is the Income Statement Favorable?
The 2025 income statement reveals solid fundamentals. Revenue rose 3.1%, while net income jumped 49%, pushing net margin above 10.7%. Interest expense remains well-controlled under 5% of revenue, supporting favorable leverage metrics. Operating expenses grew in line with revenue, slightly unfavorable, but strong earnings growth and margin expansion underscore a generally favorable income profile.
Financial Ratios
The following table presents key financial ratios for Targa Resources Corp. from 2021 to 2025, reflecting profitability, valuation, liquidity, leverage, efficiency, and dividend metrics:
| Ratios | 2021 | 2022 | 2023 | 2024 | 2025 |
|---|---|---|---|---|---|
| Net Margin | 0.4% | 5.3% | 5.3% | 7.6% | 10.8% |
| ROE | 3.5% | 43% | 30.2% | 49% | 60.1% |
| ROIC | 13.5% | 13.2% | 9.6% | 11.8% | 12.1% |
| P/E | 168 | 15 | 24 | 31 | 22 |
| P/B | 5.9 | 6.3 | 7.1 | 15.2 | 12.9 |
| Current Ratio | 0.77 | 0.77 | 0.79 | 0.72 | 0.67 |
| Quick Ratio | 0.70 | 0.64 | 0.66 | 0.62 | 0.55 |
| D/E | 3.3 | 4.3 | 4.7 | 5.5 | 5.7 |
| Debt-to-Assets | 44% | 59% | 63% | 63% | 69% |
| Interest Coverage | 4.7 | 5.6 | 3.2 | 3.8 | 4.0 |
| Asset Turnover | 1.15 | 1.11 | 0.76 | 0.73 | 0.68 |
| Fixed Asset Turnover | 1.49 | 1.53 | 0.99 | 0.92 | 0.83 |
| Dividend Yield | 1.6% | 2.3% | 2.2% | 1.6% | 2.0% |
Evolution of Financial Ratios
Return on Equity (ROE) surged sharply from 3.54% in 2021 to 60.12% in 2025, signaling a significant boost in profitability. The Current Ratio steadily declined from 0.77 to 0.67, reflecting reduced short-term liquidity. Meanwhile, the Debt-to-Equity Ratio increased notably from 3.30 to 5.68, indicating a heavier reliance on leverage over the period.
Are the Financial Ratios Fovorable?
Profitability metrics, including ROE at 60.12% and net margin at 10.76%, are favorable compared to industry norms. However, liquidity ratios such as the Current Ratio (0.67) and Quick Ratio (0.55) remain below 1.0, raising caution. Leverage is high, with Debt-to-Equity at 5.68 and Debt-to-Assets at 69.13%. Market valuation ratios are mixed, with a neutral P/E of 21.51 but an unfavorable P/B of 12.93. Overall, the financial ratios are slightly unfavorable.
Shareholder Return Policy
Targa Resources Corp. pays dividends with a payout ratio averaging around 44%, alongside a dividend yield near 2%. The dividend per share has steadily increased from $0.82 in 2021 to $3.75 in 2025, supported by coverage from free cash flow.
The company also engages in share buybacks, balancing distributions with capital needs. While the payout appears sustainable, Targa’s high leverage and low liquidity ratios suggest cautious monitoring to ensure long-term value creation remains uninterrupted.
Score analysis
The following radar chart illustrates key financial metrics evaluating the company’s performance and valuation:

The discounted cash flow score stands at a moderate 3, contrasting sharply with very unfavorable scores of 1 in return on equity, return on assets, debt to equity, price to earnings, and price to book. This disparity highlights significant operational and valuation challenges.
Analysis of the company’s bankruptcy risk
The Altman Z-Score positions the company in the grey zone, indicating a moderate risk of bankruptcy based on its financial ratios:

Is the company in good financial health?
The Piotroski Score diagram presents a snapshot of the company’s financial health based on nine criteria:

With a Piotroski Score of 6, the company reflects average financial strength, suggesting some resilience but also areas requiring improvement to boost investor confidence.
Competitive Landscape & Sector Positioning
This sector analysis examines Targa Resources Corp.’s strategic positioning, revenue by segment, key products, main competitors, and competitive advantages. I will assess whether Targa Resources holds a competitive edge over its industry peers.
Strategic Positioning
Targa Resources concentrates in North America, focusing on midstream oil and gas operations. Its portfolio spans two core segments: Gathering and Processing, and Logistics and Transportation, with the latter generating nearly twice the revenue, signaling a strategic emphasis on transportation infrastructure.
Revenue by Segment
This pie chart displays Targa Resources Corp.’s revenue distribution by segment for the fiscal year 2025, highlighting contributions from Gathering and Processing and Logistics and Transportation.
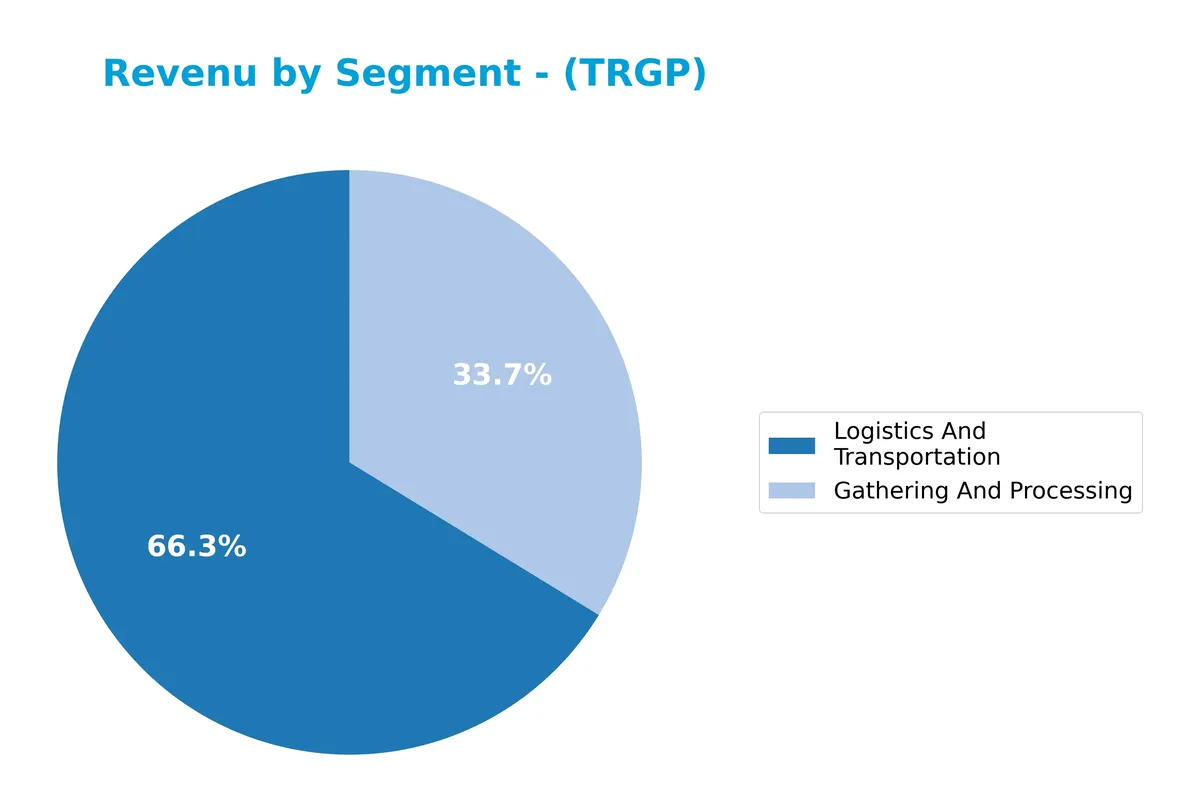
In 2025, Logistics and Transportation drives Targa’s revenue at $14.6B, showing steady growth from $14B in 2024. Gathering and Processing also advances to $7.4B, reflecting operational resilience. The combined segments reveal a concentration in transportation services, while the corporate elimination remains a minor drag. Recent trends indicate moderate acceleration in Logistics, signaling its strategic dominance amid cyclical energy market pressures.
Key Products & Brands
The following table outlines Targa Resources Corp.’s main products and services by segment:
| Product | Description |
|---|---|
| Gathering and Processing | Gathering, compressing, treating, and processing natural gas, including 42 owned processing plants. |
| Logistics and Transportation | Transporting, storing, fractionating, and selling natural gas liquids (NGLs), crude oil, and related logistics. |
| NGL Products and Services | Storage, fractionation, treatment, and sale of NGLs, plus wholesale propane and related logistics services. |
| Crude Oil Operations | Gathering, storing, terminaling, purchasing, and selling crude oil across multiple facilities. |
| Transportation Services | Services to refineries and petrochemical companies, including railcar leasing and NGL barge operations. |
Targa Resources operates a diversified portfolio of midstream energy assets, emphasizing natural gas and liquids processing alongside extensive transportation and storage infrastructure. This broad product base supports its role as a key energy logistics provider.
Main Competitors
There are 4 main competitors in the Oil & Gas Midstream industry. The table lists the top 4 leaders by market capitalization:
| Competitor | Market Cap. |
|---|---|
| The Williams Companies, Inc. | 74.3B |
| Kinder Morgan, Inc. | 61.6B |
| ONEOK, Inc. | 46.8B |
| Targa Resources Corp. | 40.1B |
Targa Resources ranks 4th among its peers with a market cap at 66.8% of the leader’s size. It sits below both the average market cap of the top competitors (55.7B) and the sector median (54.2B). The 5.78% gap from the next competitor above highlights a relatively close contest just ahead in scale.
Comparisons with competitors
Check out how we compare the company to its competitors:
Does TRGP have a competitive advantage?
Targa Resources Corp. presents a competitive advantage by generating returns on invested capital (ROIC) consistently above its cost of capital (WACC) by 5.7%, indicating value creation. However, its ROIC trend is declining, signaling a potential erosion of profitability despite favorable income margins and strong net margin growth.
Looking ahead, TRGP’s extensive midstream asset base, including 28.4K miles of pipelines and 42 processing plants, supports steady cash flow. Expansion opportunities exist in natural gas liquids logistics and transportation, leveraging its integrated operations across North America’s energy infrastructure.
SWOT Analysis
This analysis identifies Targa Resources Corp.’s key internal strengths and weaknesses, alongside external opportunities and threats shaping its strategic outlook.
Strengths
- Strong midstream asset portfolio
- Favorable profitability metrics (ROIC 12.1% vs. WACC 6.4%)
- Robust net income growth over 5 years
Weaknesses
- High leverage (D/E 5.68, debt to assets 69%)
- Low liquidity ratios (current 0.67, quick 0.55)
- Declining ROIC trend
Opportunities
- Expansion in natural gas and NGL demand
- Potential for infrastructure modernization
- Growing logistics segment revenues
Threats
- Commodity price volatility
- Regulatory risks in energy sector
- Competition from alternative energy sources
Targa Resources benefits from a valuable asset base and solid profitability, but its heavy debt and liquidity constraints pose financial risks. Strategic focus should balance growth opportunities with prudent debt management and operational efficiency.
Stock Price Action Analysis
The weekly stock price chart below captures Targa Resources Corp.’s performance over the past 12 months:
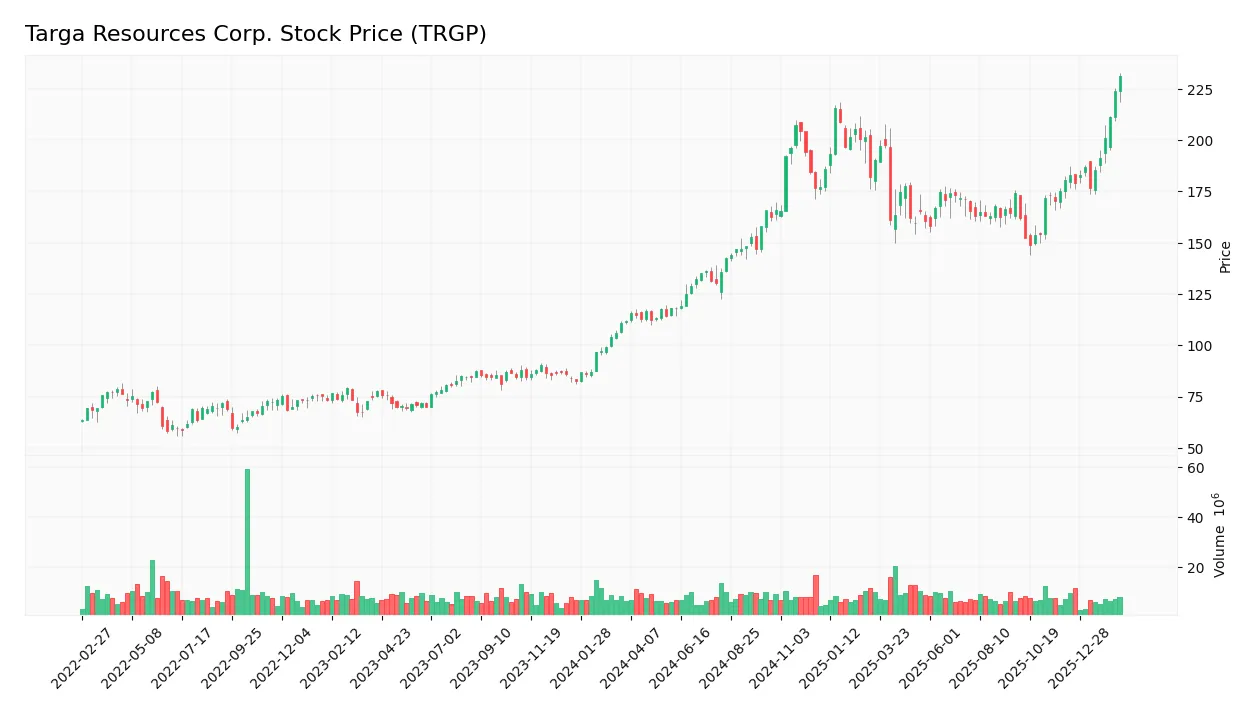
Trend Analysis
Over the past year, TRGP’s stock price rose by 106.58%, indicating a clear bullish trend with accelerating momentum. The price ranged from a low of 112 to a high of 231, reflecting notable volatility with a standard deviation of 28.06. Recent months show a continued uptrend with a 28% gain and a strong positive slope.
Volume Analysis
Trading volume for TRGP is decreasing despite persistent buyer dominance, with buyers accounting for 59.7% overall and 77.4% in recent months. This buyer-driven activity amid falling volume suggests cautious optimism and selective market participation by investors.
Target Prices
Analysts set a clear price range reflecting moderate optimism for Targa Resources Corp.
| Target Low | Target High | Consensus |
|---|---|---|
| 207 | 266 | 230.27 |
The target prices suggest analysts expect a potential upside near 15% from current levels, signaling confidence in TRGP’s strategic positioning.

Don’t Let Luck Decide Your Entry Point
Optimize your entry points with our advanced ProRealTime indicators. You’ll get efficient buy signals with precise price targets for maximum performance. Start outperforming now!
Analyst & Consumer Opinions
This section examines analyst ratings and consumer feedback to provide a balanced view of Targa Resources Corp. (TRGP).
Stock Grades
Below is a summary of recent analyst grades for Targa Resources Corp., reflecting consistent market sentiment:
| Grading Company | Action | New Grade | Date |
|---|---|---|---|
| Stifel | Maintain | Buy | 2026-02-20 |
| Wells Fargo | Maintain | Overweight | 2026-02-20 |
| Wells Fargo | Maintain | Overweight | 2025-12-18 |
| Scotiabank | Maintain | Sector Outperform | 2025-12-17 |
| RBC Capital | Maintain | Outperform | 2025-12-03 |
| RBC Capital | Maintain | Outperform | 2025-11-18 |
| Scotiabank | Maintain | Sector Outperform | 2025-11-13 |
| Goldman Sachs | Maintain | Buy | 2025-11-13 |
| Morgan Stanley | Maintain | Overweight | 2025-11-12 |
| BMO Capital | Maintain | Outperform | 2025-11-06 |
Analyst ratings for TRGP have remained stable, predominantly favoring buy and outperform categories. No downgrades or negative outlooks appeared in this recent period.
Consumer Opinions
Targa Resources Corp. generates mixed but insightful consumer sentiment, reflecting its operational strengths and areas needing improvement.
| Positive Reviews | Negative Reviews |
|---|---|
| Reliable energy supply with consistent output | Customer service response times can be slow |
| Strong safety record in operations | Pricing fluctuations create budgeting challenges |
| Transparent communication during outages | Limited online account management features |
Overall, consumers praise Targa Resources for operational reliability and safety. However, recurring complaints about customer service and digital tools suggest room for improvement in client experience.
Risk Analysis
The following table summarizes key risk categories facing Targa Resources Corp. in 2026:
| Category | Description | Probability | Impact |
|---|---|---|---|
| Leverage Risk | High debt-to-assets ratio at 69.13% increases financial strain during downturns. | High | High |
| Liquidity Risk | Low current ratio (0.67) and quick ratio (0.55) indicate potential cash flow issues. | Medium | Medium |
| Market Volatility | Beta of 0.868 suggests moderate sensitivity to energy sector swings and economic cycles. | Medium | Medium |
| Valuation Risk | Unfavorable price-to-book ratio (12.93) signals possible overvaluation. | Medium | Medium |
| Operational Risk | Fixed asset turnover at 0.83 points to less efficient asset use versus peers. | Medium | Medium |
| Bankruptcy Risk | Altman Z-Score of 2.54 places company in grey zone, indicating moderate bankruptcy risk. | Medium | High |
Leverage and liquidity risks stand out as the most pressing concerns. The company’s heavy debt load and weak liquidity ratios raise red flags in a rising interest rate environment. The Altman Z-Score confirms a moderate risk of financial distress. Meanwhile, valuation remains stretched compared to sector norms. Investors must weigh these risks against the company’s solid ROIC (12.09%) above WACC (6.42%), which supports operational profitability despite balance sheet vulnerabilities.
Should You Buy Targa Resources Corp.?
Targa Resources Corp. appears to be generating strong value creation, supported by a slightly favorable moat despite a declining ROIC trend. While its leverage profile and profitability metrics suggest caution, the overall C- rating reflects a complex risk-return profile.
Strength & Efficiency Pillars
Targa Resources Corp. delivers solid operational efficiency, with a net margin of 10.76% and a robust return on equity of 60.12%. Its return on invested capital stands at 12.09%, comfortably above the weighted average cost of capital at 6.42%, confirming that the company is a clear value creator. These metrics underscore effective capital allocation despite a declining ROIC trend, reflecting resilience in profitability and value generation over the 2021-2025 period.
Weaknesses and Drawbacks
The Altman Z-Score places Targa Resources in the grey zone at 2.54, signaling moderate bankruptcy risk that warrants caution. The company faces leverage concerns with a debt-to-equity ratio of 5.68 and a current ratio of 0.67, highlighting liquidity strain. Additionally, the price-to-book ratio at 12.93 suggests an expensive valuation relative to book value. These factors combine to elevate financial risk and could pressure the stock, despite a bullish overall trend.
Our Final Verdict about Targa Resources Corp.
Targa Resources may appear attractive due to its strong profitability and value creation, yet its moderate solvency risk in the grey zone advises prudence. Despite a bullish stock trend and strong buyer dominance in recent periods, the leverage and liquidity weaknesses suggest a cautious, wait-and-see approach for potential investors seeking a safer entry point.
Disclaimer: This content is for informational purposes only and does not constitute financial, investment, or other professional advice. Investing in financial markets involves a significant risk of loss, and past performance is not indicative of future results.
Additional Resources
- 7,388 Shares in Targa Resources, Inc. $TRGP Purchased by Stevens Capital Management LP – MarketBeat (Feb 21, 2026)
- Targa Resources Corp. Announces Form 10-K Available – Energy Digital Magazine (Feb 20, 2026)
- Targa Resources Corp. (TRGP): The Midstream Powerhouse Powering the AI Infrastructure Boom – FinancialContent (Feb 19, 2026)
- Targa Resources Corp. Reports Record Fourth Quarter and Full Year 2025 Financial Results – Quiver Quantitative (Feb 19, 2026)
- Decoding Targa Resources Corp (TRGP): A Strategic SWOT Insight – GuruFocus (Feb 20, 2026)
For more information about Targa Resources Corp., please visit the official website: targaresources.com