Home > Analyses > Consumer Cyclical > Tapestry, Inc.
Tapestry, Inc. weaves luxury into everyday life through its iconic brands—Coach, Kate Spade, and Stuart Weitzman—shaping the global fashion accessories market with style and sophistication. As a dominant player in luxury goods, Tapestry is renowned for its innovative designs, quality craftsmanship, and strong brand loyalty. With a robust retail and digital presence, the company continuously evolves to capture emerging trends. The key question for investors is whether Tapestry’s current fundamentals support its premium valuation and future growth prospects.

Table of contents
Business Model & Company Overview
Tapestry, Inc., founded in 1941 and headquartered in New York City, stands as a leading player in the luxury goods sector. Its core mission revolves around a cohesive ecosystem of premium lifestyle brands—Coach, Kate Spade, and Stuart Weitzman—offering a broad array of products from handbags and footwear to accessories and apparel. This diverse portfolio caters to global consumers seeking stylish and high-quality luxury items.
The company’s revenue engine balances physical retail with digital channels, operating nearly 1,443 stores worldwide alongside e-commerce platforms. Its geographic footprint spans the Americas, Europe, and Asia, leveraging brand strength and licensing agreements to generate recurring income. Tapestry’s competitive advantage lies in its multi-brand strategy and global presence, shaping the future of luxury retail through innovation and market adaptability.
Financial Performance & Fundamental Metrics
In this section, I analyze Tapestry, Inc.’s income statement, key financial ratios, and dividend payout policy to assess its overall financial health and stability.
Income Statement
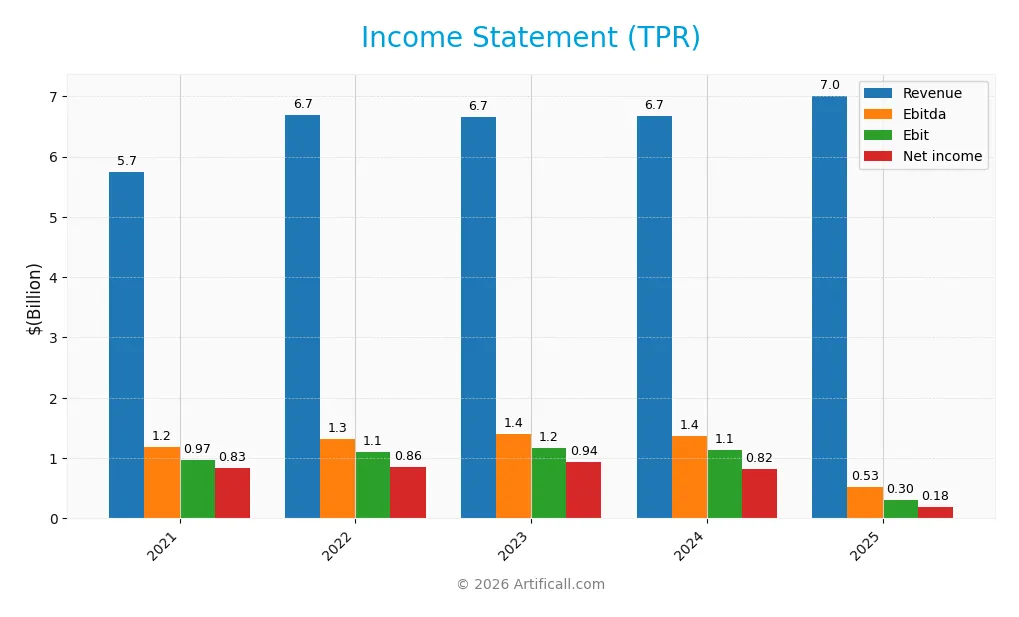
The table below presents Tapestry, Inc.’s income statement figures for fiscal years 2021 through 2025, showing key metrics including revenue, expenses, and earnings per share.
| 2021 | 2022 | 2023 | 2024 | 2025 | |
|---|---|---|---|---|---|
| Revenue | 5.75B | 6.68B | 6.66B | 6.67B | 7.01B |
| Cost of Revenue | 1.66B | 2.03B | 1.95B | 1.78B | 1.72B |
| Operating Expenses | 3.11B | 3.47B | 3.54B | 3.75B | 4.87B |
| Gross Profit | 4.08B | 4.65B | 4.71B | 4.89B | 5.29B |
| EBITDA | 1.19B | 1.31B | 1.39B | 1.37B | 526.4M |
| EBIT | 969M | 1.11B | 1.17B | 1.14B | 301.5M |
| Interest Expense | 71.4M | 58.7M | 27.6M | 125M | 85.4M |
| Net Income | 834M | 856M | 936M | 816M | 183M |
| EPS | 3.00 | 3.24 | 3.96 | 3.56 | 0.85 |
| Filing Date | 2021-08-19 | 2022-08-18 | 2023-08-17 | 2024-08-15 | 2025-08-14 |
Income Statement Evolution
From 2021 to 2025, Tapestry, Inc. experienced a 22.0% growth in revenue, reaching 7.01B in 2025, indicating a generally positive top-line trend. However, net income declined by 78.0% over the same period, reflecting significant margin compression. Gross margin remained favorable at 75.44%, while EBIT and net margins showed neutral to unfavorable trends, signaling rising costs relative to revenue.
Is the Income Statement Favorable?
In 2025, Tapestry posted revenue growth of 5.09%, but EBIT dropped 73.5%, and net margin contracted to 2.61%. Operating expenses increased proportionally with revenue, contributing to a net income of only 183M, down sharply from prior years. Interest expense was low at 1.22% of revenue, a favorable aspect, yet overall fundamentals for the year are generally unfavorable due to diminished profitability and earnings per share.
Financial Ratios
The table below presents key financial ratios for Tapestry, Inc. (TPR) over the fiscal years 2021 to 2025, highlighting profitability, valuation, liquidity, leverage, efficiency, and dividend metrics:
| Ratios | 2021 | 2022 | 2023 | 2024 | 2025 |
|---|---|---|---|---|---|
| Net Margin | 14.52% | 12.81% | 14.05% | 12.23% | 2.61% |
| ROE | 25.59% | 37.47% | 41.09% | 28.17% | 21.36% |
| ROIC | 12.37% | 15.72% | 15.60% | 7.48% | 6.59% |
| P/E | 14.48 | 9.42 | 10.81 | 11.79 | 103.09 |
| P/B | 3.71 | 3.53 | 4.44 | 3.32 | 22.02 |
| Current Ratio | 2.37 | 1.75 | 1.84 | 5.14 | 1.87 |
| Quick Ratio | 1.85 | 1.08 | 1.12 | 4.66 | 1.31 |
| D/E | 1.05 | 1.43 | 1.45 | 3.03 | 4.55 |
| Debt-to-Assets | 41.0% | 44.9% | 46.3% | 65.4% | 59.3% |
| Interest Coverage | 13.56 | 20.03 | 42.48 | 9.12 | 4.86 |
| Asset Turnover | 0.69 | 0.92 | 0.94 | 0.50 | 1.07 |
| Fixed Asset Turnover | 2.64 | 3.66 | 3.43 | 3.65 | 3.85 |
| Dividend Yield | 0.00% | 3.28% | 2.80% | 3.34% | 1.58% |
Evolution of Financial Ratios
Over the period, Tapestry, Inc.’s Return on Equity (ROE) showed volatility, peaking above 40% in 2023 and settling at 21.36% in 2025, indicating a decline in profitability efficiency. The Current Ratio fluctuated from a high of 5.14 in 2024 to 1.87 in 2025, reflecting reduced liquidity but remaining above 1. The Debt-to-Equity Ratio increased significantly, reaching 4.55 in 2025, signaling a rise in financial leverage and potential risk.
Are the Financial Ratios Favorable?
In 2025, Tapestry’s profitability shows mixed signals: a favorable ROE at 21.36% contrasts with an unfavorable net margin of 2.61%. Liquidity ratios like Current (1.87) and Quick Ratio (1.31) are favorable, supporting short-term financial stability. However, leverage ratios are unfavorable with a high debt-to-equity of 4.55 and debt-to-assets at 59.25%. Market valuation ratios, including P/E of 103.09 and P/B of 22.02, are also unfavorable, while efficiency ratios such as asset and fixed asset turnover remain favorable. Overall, the ratio profile is slightly unfavorable.
Shareholder Return Policy
Tapestry, Inc. has consistently paid dividends over the past four fiscal years, with dividend payout ratios ranging from approximately 30% to 160%, and a dividend yield fluctuating between 1.58% and 3.34%. The most recent year shows a high payout ratio of 163%, indicating dividends exceed net income, potentially signaling reliance on cash reserves or debt.
The company’s dividend payments appear supported by free cash flow, which remains positive and sufficient to cover dividends and capital expenditures. There is no explicit mention of share buyback programs. The current policy suggests a commitment to shareholder returns, but the elevated payout ratio may pose sustainability risks if earnings do not improve, warranting close monitoring for long-term value preservation.
Score analysis
The following radar chart presents a comprehensive overview of Tapestry, Inc.’s key financial scores:
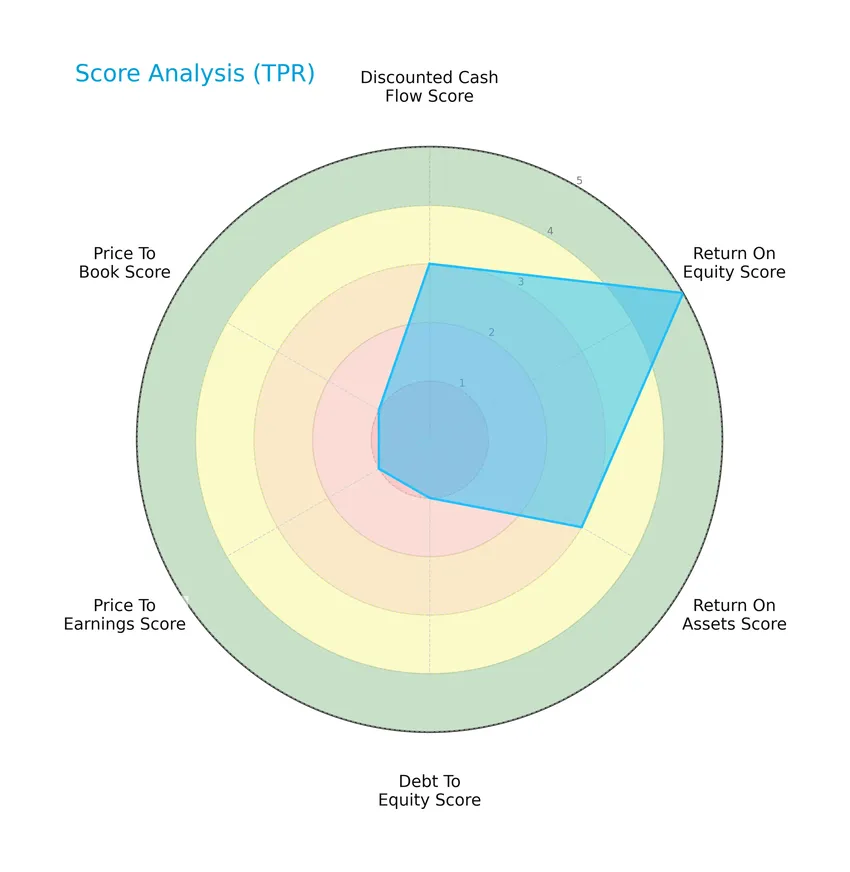
Tapestry shows a mixed score profile with a very favorable return on equity (5) contrasting sharply with very unfavorable valuations and leverage metrics (debt to equity, price to earnings, price to book each at 1). Discounted cash flow and return on assets scores are moderate at 3.
Analysis of the company’s bankruptcy risk
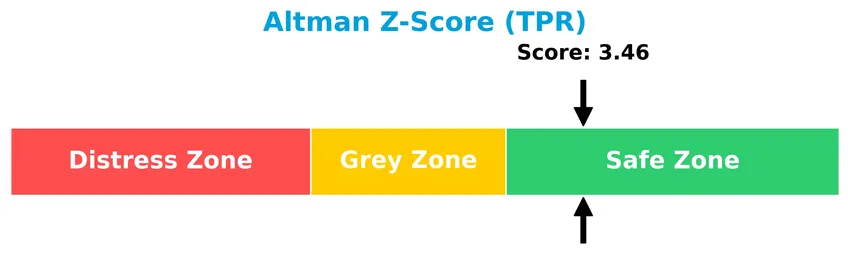
Tapestry, Inc. currently resides in the safe zone according to its Altman Z-Score, indicating a low risk of bankruptcy:
Is the company in good financial health?
The Piotroski Score diagram below illustrates the company’s strong financial health:
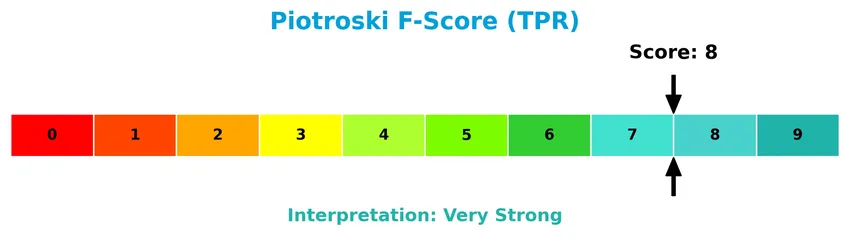
With a Piotroski Score of 8, Tapestry demonstrates very strong financial fundamentals, suggesting solid profitability, liquidity, and operational efficiency.
Competitive Landscape & Sector Positioning
This sector analysis will examine Tapestry, Inc.’s strategic positioning, revenue by segment, key products, main competitors, competitive advantages, and SWOT analysis. I will assess whether the company holds a competitive advantage over its peers in the luxury goods industry.
Strategic Positioning
Tapestry, Inc. operates a diversified luxury portfolio with three main segments—Coach ($5.6B), Kate Spade ($1.2B), and Stuart Weitzman ($215M) in FY 2025. Geographically, it focuses on North America ($4.2B) while expanding in Greater China ($1.1B) and other Asian markets, balancing concentrated brand strength with broad regional exposure.
Revenue by Segment
This pie chart illustrates the revenue distribution of Tapestry, Inc. by product segment for the fiscal year 2025, highlighting the contribution of each brand to the total sales.
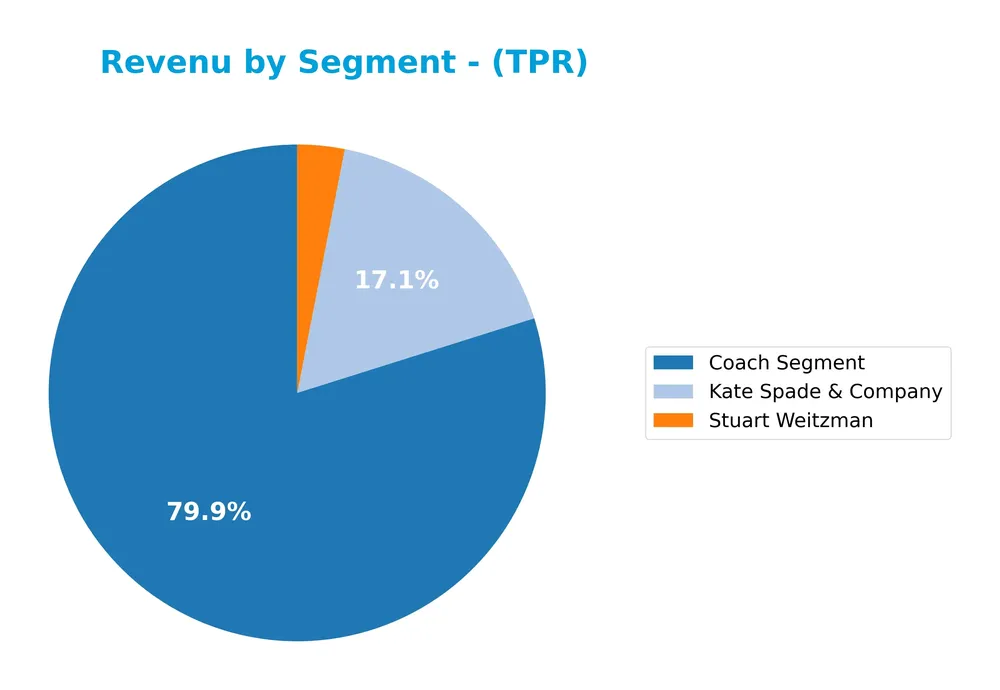
In 2025, the Coach segment dominated with $5.6B in revenue, showing a solid growth from $5.1B in 2024, reinforcing its role as the main driver of Tapestry’s business. Kate Spade & Company generated $1.2B, experiencing a slight decline compared to previous years, indicating some pressure in that segment. Stuart Weitzman contributed $215M, continuing a downward trend from earlier years. The business remains concentrated in Coach, with recent growth signaling a strategic focus but also potential concentration risk.
Key Products & Brands
The following table summarizes Tapestry, Inc.’s main product segments and brand offerings:
| Product | Description |
|---|---|
| Coach Segment | Luxury women’s accessories including handbags, wallets, small leather goods, footwear, watches, fragrances, sunglasses, and apparel. Operates 945 stores and includes licensing for tech and soft accessories, jewelry, eyewear, and fragrances. |
| Kate Spade & Company | Women’s accessories and lifestyle products such as handbags, footwear, apparel, housewares, stationery, and gifts. Operates 398 stores and licenses tableware, fashion beddings, tech accessories, watches, sleepwear, eyewear, stationery, gifts, and fragrances. |
| Stuart Weitzman | Primarily women’s footwear, operating 100 stores, with additional offerings in accessories. |
Tapestry, Inc. operates through three main luxury brands with a combined global retail and e-commerce presence, offering a diverse range of accessories, footwear, and lifestyle products.
Main Competitors
There are 56 competitors in total, with the table below listing the top 10 leaders by market capitalization:
| Competitor | Market Cap. |
|---|---|
| Amazon.com, Inc. | 2.42T |
| Tesla, Inc. | 1.41T |
| The Home Depot, Inc. | 344B |
| Alibaba Group Holding Limited | 340B |
| McDonald’s Corporation | 217B |
| The TJX Companies, Inc. | 172B |
| Booking Holdings Inc. | 172B |
| PDD Holdings Inc. | 159B |
| Lowe’s Companies, Inc. | 138B |
| MercadoLibre, Inc. | 102B |
Tapestry, Inc. ranks 33rd among 56 competitors, with a market cap approximately 1.11% the size of the leader, Amazon.com, Inc. It is positioned below both the average market cap of the top 10 competitors (547B) and the sector median (38B). The company is separated from its closest competitor above by a margin of +3.28%, indicating a modest gap in scale.
Comparisons with competitors
Check out how we compare the company to its competitors:
Aucun article trouvé pour ces critères.
Does TPR have a competitive advantage?
Tapestry, Inc. currently does not present a competitive advantage, as its return on invested capital (ROIC) is significantly below its weighted average cost of capital (WACC), indicating value destruction and declining profitability. The company’s ROIC trend over 2021-2025 is negative, reflecting decreasing efficiency in using invested capital.
Looking ahead, Tapestry operates established luxury brands Coach, Kate Spade, and Stuart Weitzman across key markets including North America and Greater China, supporting steady revenue growth. The company’s extensive product portfolio and global presence offer opportunities to expand e-commerce and penetrate new international markets.
SWOT Analysis
This SWOT analysis highlights the key internal and external factors affecting Tapestry, Inc. to guide strategic investment decisions.
Strengths
- Strong brand portfolio with Coach, Kate Spade, Stuart Weitzman
- Solid market presence in North America and Greater China
- Favorable gross margin at 75.44%
Weaknesses
- Declining profitability with net margin down to 2.61%
- High debt levels with debt-to-equity ratio at 4.55
- Unfavorable valuation metrics, including PE of 103 and PB of 22.02
Opportunities
- Growth potential in Greater China and Other Asia markets
- Expansion of e-commerce and digital sales channels
- Innovation in lifestyle and luxury product segments
Threats
- Intense competition in luxury goods sector
- Macroeconomic risks impacting consumer spending
- Currency fluctuations affecting international revenue
Tapestry’s strong brand recognition and regional market footholds provide a solid foundation, but the company faces challenges with profitability and high leverage. Strategic focus should be on managing debt, improving operational efficiency, and capitalizing on growth in Asia and digital channels to mitigate competitive and economic risks.
Stock Price Action Analysis
The following weekly stock chart illustrates Tapestry, Inc.’s price movements over the last 12 months, highlighting key highs and lows:
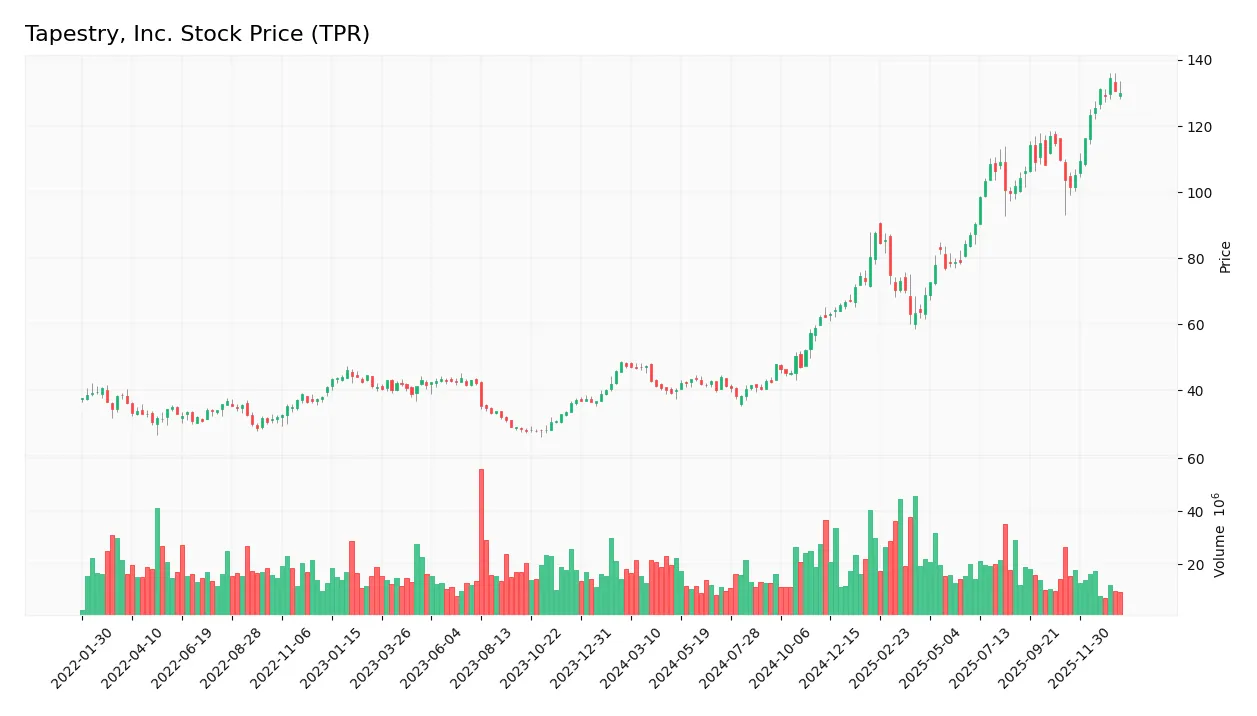
Trend Analysis
Over the past 12 months, Tapestry, Inc.’s stock price increased by 175.39%, indicating a strong bullish trend with acceleration. The price ranged from a low of 38.13 to a high of 134.35, with a notable volatility reflected in a standard deviation of 29.06. Recent months show continued upward momentum with a 25.42% gain over the last 2.5 months.
Volume Analysis
Trading volume over the last three months is increasing, with a total buyer volume of 98M against seller volume of 68M, reflecting a slightly buyer-dominant environment at 58.89%. This suggests growing investor participation and positive market sentiment supporting the price uptrend.
Target Prices
The consensus target prices for Tapestry, Inc. reflect moderate upside potential based on analyst estimates.
| Target High | Target Low | Consensus |
|---|---|---|
| 155 | 123 | 139 |
Analysts generally expect Tapestry’s stock price to trade between $123 and $155, with a consensus target around $139, indicating cautious optimism.

Don’t Let Luck Decide Your Entry Point
Optimize your entry points with our advanced ProRealTime indicators. You’ll get efficient buy signals with precise price targets for maximum performance. Start outperforming now!
Analyst & Consumer Opinions
This section examines the latest analyst ratings and consumer feedback regarding Tapestry, Inc. (TPR).
Stock Grades
Here is a summary of the latest stock grades for Tapestry, Inc. from recognized financial institutions:
| Grading Company | Action | New Grade | Date |
|---|---|---|---|
| Citigroup | Maintain | Buy | 2026-01-20 |
| Jefferies | Downgrade | Hold | 2026-01-14 |
| Barclays | Maintain | Overweight | 2026-01-12 |
| UBS | Maintain | Neutral | 2026-01-08 |
| Wells Fargo | Maintain | Overweight | 2025-12-16 |
| Jefferies | Maintain | Buy | 2025-12-12 |
| JP Morgan | Maintain | Overweight | 2025-11-17 |
| Telsey Advisory Group | Maintain | Outperform | 2025-11-07 |
| JP Morgan | Maintain | Overweight | 2025-11-07 |
| Wells Fargo | Maintain | Overweight | 2025-11-07 |
The consensus among these grades leans towards a positive outlook with several “Buy” and “Overweight” ratings maintained over recent months, though Jefferies’ recent downgrade to “Hold” indicates some caution. Overall, the trend reflects moderate confidence in the stock’s prospects.
Consumer Opinions
Consumers of Tapestry, Inc. express a blend of admiration and constructive criticism, reflecting a nuanced view of the brand’s value and service.
| Positive Reviews | Negative Reviews |
|---|---|
| High-quality materials and craftsmanship in products | Some items are priced on the higher side |
| Stylish and trendy designs that appeal to many | Occasional delays in customer service response |
| Strong brand reputation and reliability | Limited availability of certain popular styles |
| Enjoyable in-store shopping experience | Sizing inconsistencies across different product lines |
Overall, consumer feedback highlights Tapestry’s strength in product quality and style, while pointing out pricing and service response times as areas needing improvement.
Risk Analysis
Below is a summary table of the key risks associated with investing in Tapestry, Inc., highlighting their probability and potential impact:
| Category | Description | Probability | Impact |
|---|---|---|---|
| Financial Leverage | High debt-to-equity ratio (4.55) increasing financial risk and interest burden | High | High |
| Valuation Risk | Elevated price-to-earnings (103.09) and price-to-book (22.02) ratios suggest overvaluation | High | High |
| Market Volatility | Beta of 1.643 indicates sensitivity to market fluctuations affecting stock price | Medium | Medium |
| Profitability | Low net margin (2.61%) reflects limited profitability despite strong ROE | Medium | Medium |
| Economic Cyclicality | Exposure to consumer cyclical sector, vulnerable to economic downturns | Medium | Medium |
| Supply Chain | Potential disruptions impacting luxury goods production and distribution | Medium | Medium |
| Competitive Pressure | Intense competition in luxury goods may impact market share and pricing | Medium | Medium |
The most significant risks for Tapestry are its high financial leverage and elevated valuation metrics, which pose threats if earnings do not meet expectations. Despite a safe Altman Z-score (3.46) and a strong Piotroski score (8), investors should remain cautious about debt levels and market valuation in this volatile luxury goods sector.
Should You Buy Tapestry, Inc.?
Tapestry, Inc. appears to be facing a challenging profile with declining operational efficiency and a deteriorating competitive moat, indicating value erosion. Despite a substantial leverage profile and mixed valuation metrics, the overall B- rating suggests moderate financial health with cautious outlooks.
Strength & Efficiency Pillars
Tapestry, Inc. presents a solid financial foundation marked by a return on equity of 21.36%, reflecting effective shareholder value generation. The company’s Altman Z-Score of 3.46 places it safely in the non-distress zone, affirming financial stability, while a strong Piotroski score of 8 underscores robust operational health. Liquidity metrics such as a current ratio of 1.87 and a quick ratio of 1.31 further support its capacity to meet short-term obligations. Although the return on invested capital (6.59%) falls below the weighted average cost of capital (10.6%), signaling value erosion, overall profitability and balance sheet strength remain commendable pillars.
Weaknesses and Drawbacks
Despite these strengths, Tapestry faces significant valuation and leverage concerns. The price-to-earnings ratio of 103.09 and price-to-book ratio of 22.02 indicate a market premium that may not be justified by fundamentals, posing valuation risk. The debt-to-equity ratio of 4.55 and debt-to-assets at 59.25% highlight elevated financial leverage, potentially increasing vulnerability to interest rate fluctuations and credit tightening. Furthermore, net margin stands at a modest 2.61% with a declining trend in profitability metrics, raising questions about operational efficiency. These factors represent notable headwinds that investors should weigh carefully.
Our Verdict about Tapestry, Inc.
The long-term fundamental profile of Tapestry appears mixed with favorable financial health but challenged profitability and stretched valuation. The bullish overall stock trend coupled with a slightly buyer-dominant recent period suggests positive market sentiment. Therefore, the company’s profile might appear attractive for investors seeking exposure to a resilient brand with stable balance sheet metrics, yet caution is warranted given profitability pressures and elevated leverage. Prospective investors could consider a watchful approach to identify more favorable entry points.
Disclaimer: This content is for informational purposes only and does not constitute financial, investment, or other professional advice. Investing in financial markets involves a significant risk of loss, and past performance is not indicative of future results.
Additional Resources
- Tapestry, Inc. (TPR) to Release Q2 Fiscal 2026 Results on February 5, 2026 – Intellectia AI (Jan 22, 2026)
- What Is Tapestry, Inc.’s (NYSE:TPR) Share Price Doing? – simplywall.st (Jan 04, 2026)
- Reinhart Partners LLC. Sells 62,514 Shares of Tapestry, Inc. $TPR – MarketBeat (Jan 17, 2026)
- Tapestry (TPR) Emerges as a Leading Idea in Telsey’s 2026 Outlook – Yahoo Finance (Jan 02, 2026)
- Tapestry, Inc. Reports Fiscal 2026 First Quarter Results and Raises Full Year Outlook – Business Wire (Nov 06, 2025)
For more information about Tapestry, Inc., please visit the official website: tapestry.com