Home > Analyses > Technology > Take-Two Interactive Software, Inc.
Take-Two Interactive Software, Inc. crafts immersive worlds that captivate millions, redefining interactive entertainment with blockbuster franchises like Grand Theft Auto and Red Dead Redemption. As a powerhouse in electronic gaming, it blends innovation and quality across consoles, PCs, and mobile platforms, maintaining a stronghold in diverse gaming genres. With a robust portfolio and a reputation for market influence, the key question for investors in 2026 is whether Take-Two’s fundamentals continue to support its ambitious growth and premium valuation.
Table of contents
Business Model & Company Overview
Take-Two Interactive Software, Inc., founded in 1993 and headquartered in New York City, stands as a dominant player in the electronic gaming and multimedia industry. Its ecosystem centers around high-profile franchises like Grand Theft Auto, Red Dead Redemption, and NBA 2K, delivered through diverse platforms including consoles, PCs, and mobile devices. This cohesive portfolio spans action, sports, strategy, and casual gaming, positioning the company as a versatile entertainment powerhouse.
The company’s revenue engine balances blockbuster game sales, downloadable content, and recurring services such as online platforms and cloud streaming. With strategic market penetration across the Americas, Europe, and Asia, Take-Two leverages a broad footprint to maximize global reach. Its competitive advantage lies in a robust intellectual property portfolio and diversified distribution channels, solidifying its economic moat and shaping the future of interactive entertainment.
Financial Performance & Fundamental Metrics
In this section, I analyze Take-Two Interactive Software, Inc.’s income statement, key financial ratios, and dividend payout policy to assess its overall financial health.
Income Statement
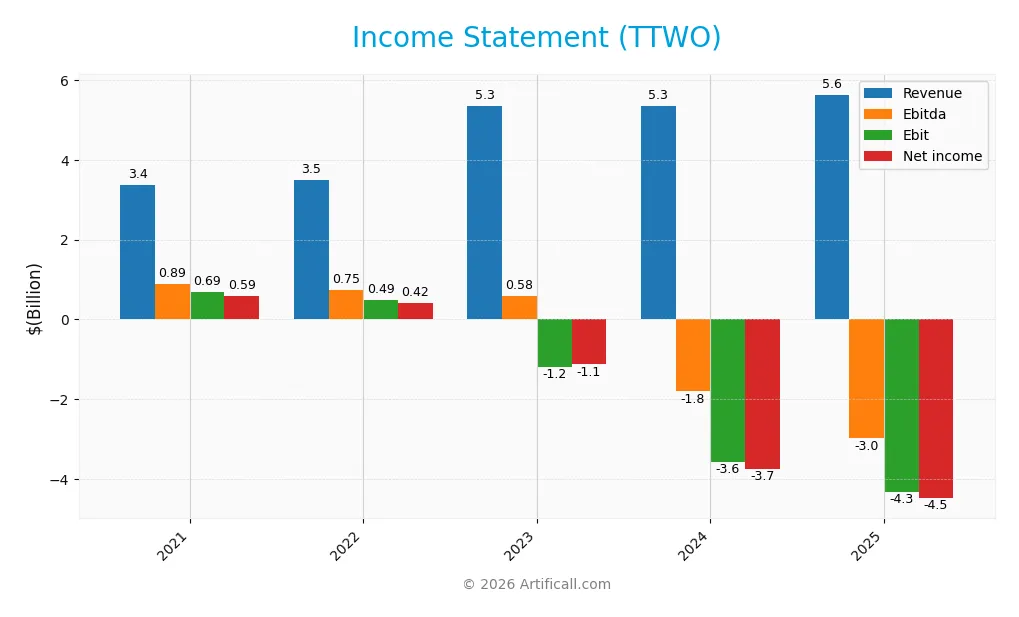
The table below summarizes Take-Two Interactive Software, Inc.’s key income statement figures for the fiscal years 2021 through 2025, illustrating trends in revenue, profitability, and earnings per share.
| 2021 | 2022 | 2023 | 2024 | 2025 | |
|---|---|---|---|---|---|
| Revenue | 3.37B | 3.50B | 5.35B | 5.35B | 5.63B |
| Cost of Revenue | 1.54B | 1.54B | 3.06B | 3.11B | 2.57B |
| Operating Expenses | 1.21B | 1.50B | 3.45B | 5.83B | 7.45B |
| Gross Profit | 1.84B | 1.97B | 2.29B | 2.24B | 3.06B |
| EBITDA | 891M | 747M | 583M | -1.80B | -2.98B |
| EBIT | 688M | 490M | -1.19B | -3.56B | -4.32B |
| Interest Expense | 11M | 25M | 144M | 141M | 169M |
| Net Income | 589M | 418M | -1.12B | -3.74B | -4.48B |
| EPS | 5.14 | 3.62 | -7.03 | -22.01 | -25.58 |
| Filing Date | 2021-05-19 | 2022-05-17 | 2023-05-26 | 2024-05-22 | 2025-05-20 |
Income Statement Evolution
From 2021 to 2025, Take-Two Interactive’s revenue rose by 67.03%, signaling solid top-line growth, though this slowed to a neutral 5.31% increase in the latest year. Gross profit improved significantly by 36.6% in the last year, reflecting an enhanced gross margin of 54.36%, which is favorable. However, operating expenses and net income margins deteriorated, leading to negative EBIT and net margins, indicating worsening profitability despite revenue growth.
Is the Income Statement Favorable?
In fiscal 2025, the company reported a revenue of $5.63B with a strong gross margin, yet it posted a substantial net loss of $4.48B and a negative EPS of -$25.58. EBIT margin was deeply negative at -76.72%, overshadowing the favorable gross margin. Interest expenses remained low at 3.01% of revenue, a positive aspect. Overall, the fundamentals are unfavorable, with most profitability metrics declining and significant operating losses reflecting structural challenges.
Financial Ratios
The table below presents key financial ratios for Take-Two Interactive Software, Inc. over the fiscal years 2021 to 2025, offering insight into profitability, valuation, liquidity, leverage, and operational efficiency:
| Ratios | 2021 | 2022 | 2023 | 2024 | 2025 |
|---|---|---|---|---|---|
| Net Margin | 17% | 12% | -21% | -70% | -80% |
| ROE | 18% | 11% | -12% | -66% | -210% |
| ROIC | 14% | 9% | -7% | -36% | -65% |
| P/E | 34.4 | 42.5 | -17.0 | -6.8 | -8.1 |
| P/B | 6.1 | 4.7 | 2.1 | 4.5 | 17.0 |
| Current Ratio | 1.89 | 1.84 | 0.65 | 0.94 | 0.78 |
| Quick Ratio | 1.88 | 1.83 | 0.65 | 0.94 | 0.78 |
| D/E | 0.06 | 0.07 | 0.39 | 0.62 | 1.92 |
| Debt-to-Assets | 3% | 4% | 22% | 29% | 45% |
| Interest Coverage | 59.4 | 19.3 | -8.1 | -25.5 | -25.9 |
| Asset Turnover | 0.56 | 0.54 | 0.34 | 0.44 | 0.61 |
| Fixed Asset Turnover | 10.7 | 7.6 | 7.8 | 7.3 | 7.3 |
| Dividend Yield | 0% | 0% | 0% | 0% | 0% |
Evolution of Financial Ratios
Over the period, Take-Two Interactive’s Return on Equity (ROE) significantly declined, reaching -209.52% in 2025, reflecting deteriorated profitability. The Current Ratio weakened from a strong position above 1.8 in 2021 to 0.78 in 2025, indicating reduced short-term liquidity. Meanwhile, the Debt-to-Equity Ratio rose sharply from 0.06 in 2021 to 1.92 in 2025, signaling increased leverage and financial risk.
Are the Financial Ratios Fovorable?
In 2025, profitability ratios such as net margin (-79.5%) and ROE (-209.52%) were unfavorable, showing negative earnings performance. Liquidity ratios including current and quick ratios at 0.78 were also unfavorable, suggesting potential short-term financial strain. Leverage ratios, particularly debt-to-equity at 1.92, were unfavorable, while asset turnover (0.61) remained neutral. Market valuation ratios presented mixed signals with a high price-to-book ratio (16.98) deemed unfavorable, but a favorable price-to-earnings ratio (-8.1). Overall, 64% of the ratios were unfavorable, indicating a challenging financial profile.
Shareholder Return Policy
Take-Two Interactive Software, Inc. has not paid dividends over the past fiscal years, reflecting its negative net profit margins and ongoing reinvestment in operations. The company does not currently engage in share buybacks either, indicating a focus on growth or managing financial challenges rather than returning capital to shareholders.
This absence of distributions aligns with a strategy that prioritizes reinvestment and potentially R&D or acquisitions, aiming to build long-term shareholder value despite short-term losses. However, the lack of tangible shareholder returns and negative free cash flow highlight risks that investors should monitor regarding sustainability.
Score analysis
The radar chart below presents a comprehensive view of Take-Two Interactive Software, Inc.’s key financial scores:
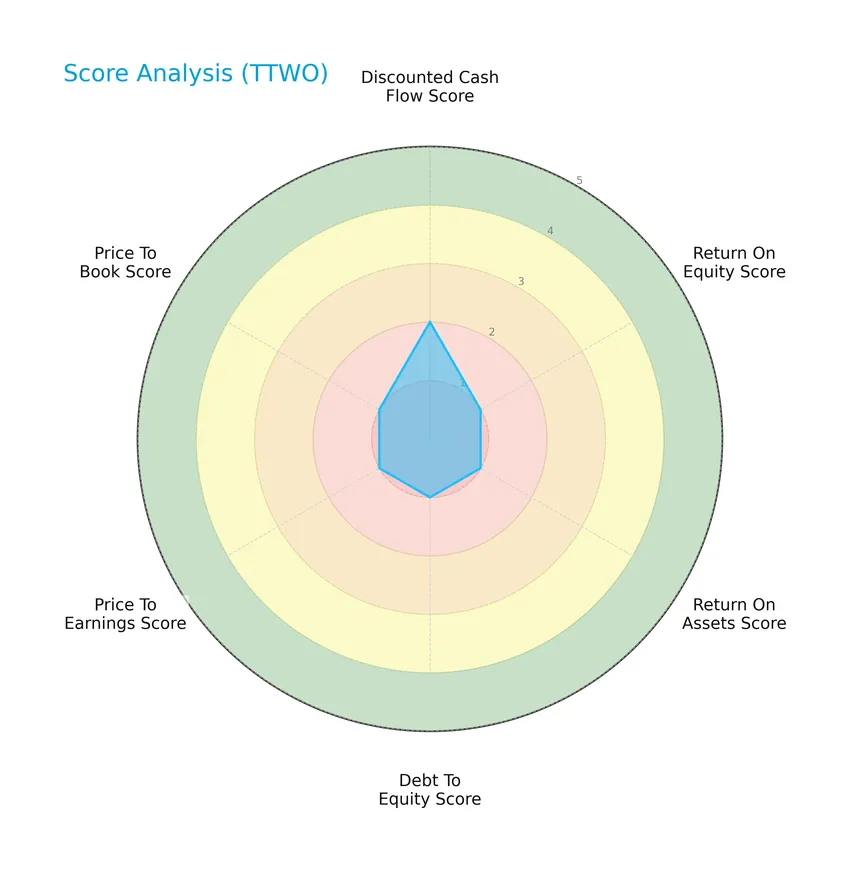
The company’s discounted cash flow score is moderate at 2, while all other scores—including return on equity, return on assets, debt to equity, price to earnings, and price to book—are very unfavorable, each with a score of 1, indicating overall weak financial ratios.
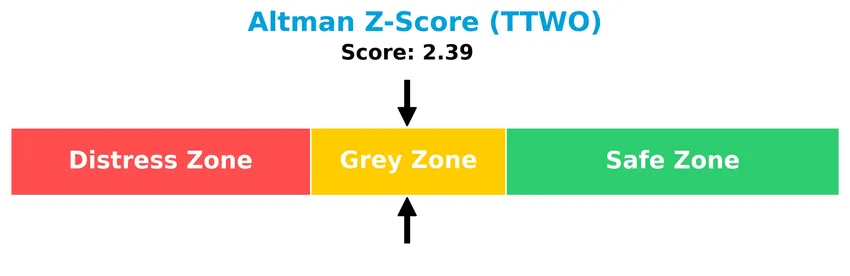
Analysis of the company’s bankruptcy risk
The Altman Z-Score places Take-Two Interactive in the grey zone, suggesting a moderate risk of bankruptcy based on its current financial metrics:
Is the company in good financial health?
The Piotroski Score diagram provides insight into the company’s financial strength and operational efficiency:
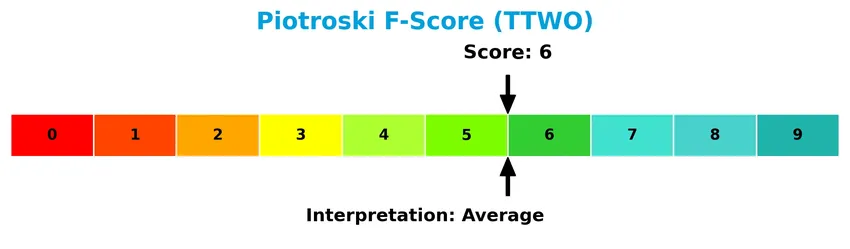
With a Piotroski Score of 6, Take-Two Interactive shows average financial health, reflecting moderate strength but not reaching the levels associated with strong or very strong financial conditions.
Competitive Landscape & Sector Positioning
This sector analysis will examine Take-Two Interactive Software’s strategic positioning, revenue segments, key products, and main competitors. I will assess whether the company holds competitive advantages over its industry peers.
Strategic Positioning
Take-Two Interactive maintains a diversified product portfolio spanning console, mobile, and PC gaming, with mobile revenues reaching $2.94B in 2025. Geographically, it balances exposure between the US ($3.41B) and international markets ($2.23B), reflecting broad market penetration in electronic gaming and multimedia.
Revenue by Segment
This pie chart illustrates Take-Two Interactive Software, Inc.’s revenue distribution by segment for the fiscal year 2025, highlighting Console, Mobile, and PC & Other Products.
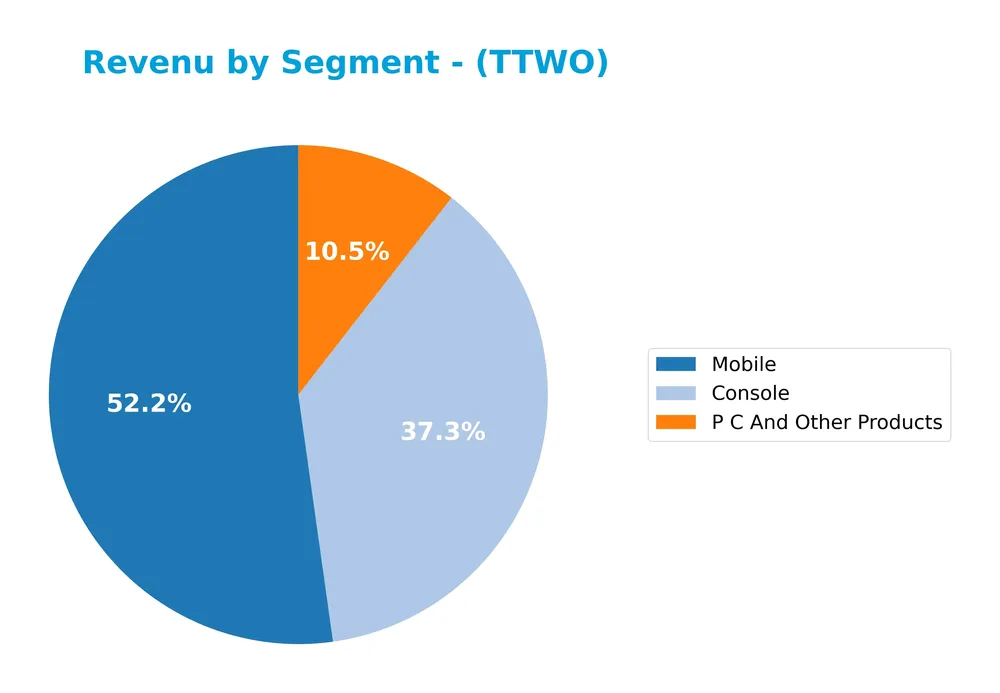
In 2025, Mobile emerged as the leading revenue segment with $2.94B, surpassing Console at $2.10B, which previously dominated. The PC & Other Products segment contributed a smaller $593M, showing steady growth. Over recent years, Mobile has gained momentum, reflecting a strategic shift and diversification in Take-Two’s portfolio, while Console revenue slightly declined, signaling a potential change in consumer preferences and platform focus.
Key Products & Brands
The table below outlines Take-Two Interactive’s primary products and brands with their descriptions:
| Product | Description |
|---|---|
| Rockstar Games | Developer and publisher of action/adventure titles like Grand Theft Auto, Max Payne, Midnight Club, and Red Dead Redemption. |
| 2K | Publisher of diverse entertainment properties including BioShock, Mafia, Sid Meier’s Civilization, XCOM, and Borderlands. |
| Private Division | Publisher of games such as Kerbal Space Program, OlliOlli World, The Outer Worlds, and Ancestors: The Humankind Odyssey. |
| T2 Mobile Games | Developer and publisher of free-to-play mobile games including Dragon City, Monster Legends, Two Dots, and Top Eleven. |
| NBA 2K Series | Sports simulation basketball video game under the 2K brand. |
| WWE 2K Series | Professional wrestling video game series under the 2K brand. |
| PGA TOUR 2K | Sports simulation golf video game under the 2K brand. |
Take-Two Interactive focuses on a broad portfolio of gaming products across multiple platforms, including consoles, PC, and mobile devices, under well-known brands targeting various game genres from action to sports simulation.
Main Competitors
In the Electronic Gaming & Multimedia industry, there are 2 main competitors; below is a list of the top 10 leaders by market capitalization:
| Competitor | Market Cap. |
|---|---|
| Electronic Arts Inc. | 51B |
| Take-Two Interactive Software, Inc. | 46.5B |
Take-Two Interactive Software ranks 2nd among its competitors, with a market cap approximately 89.1% that of the leader, Electronic Arts Inc. The company’s market capitalization is below both the average market cap of the top 10 competitors (48.7B) and the sector median (48.7B). It trails its closest rival by 12.28%, indicating a moderate gap in scale.
Comparisons with competitors
Check out how we compare the company to its competitors:
Does TTWO have a competitive advantage?
Take-Two Interactive Software, Inc. does not currently present a competitive advantage, as its return on invested capital (ROIC) is significantly below its weighted average cost of capital (WACC), indicating value destruction and declining profitability. The company’s income statement shows unfavorable EBIT and net margins, despite a favorable gross margin and moderate revenue growth.
Looking ahead, Take-Two continues to leverage well-known franchises such as Grand Theft Auto and NBA 2K, with operations across multiple platforms including consoles, PCs, and mobile. This broad product portfolio and geographic expansion, especially outside the US, may offer future growth opportunities, although current financial performance highlights ongoing challenges in operational efficiency.
SWOT Analysis
This SWOT analysis highlights Take-Two Interactive Software, Inc.’s key internal strengths and weaknesses, along with external opportunities and threats, to guide strategic investment decisions.
Strengths
- Strong brand portfolio including Rockstar and 2K
- Diverse gaming genres and platforms
- Solid revenue growth over recent years
Weaknesses
- Negative net margin and EBIT margin
- Declining profitability and ROIC
- High debt-to-equity ratio and liquidity concerns
Opportunities
- Expansion in mobile and cloud gaming
- Growth in international markets, especially Non-US revenue
- Increasing demand for live services and digital content
Threats
- Intense industry competition and rapid tech changes
- Potential regulatory challenges in gaming
- Economic downturns affecting consumer spending
Overall, Take-Two demonstrates robust brand strength and revenue momentum but faces significant financial and operational challenges. The company must focus on improving profitability and managing debt while capitalizing on market expansion and digital innovation to enhance shareholder value.
Stock Price Action Analysis
The weekly stock chart for Take-Two Interactive Software, Inc. (TTWO) over the past 12 months highlights price movements and volatility patterns clearly:
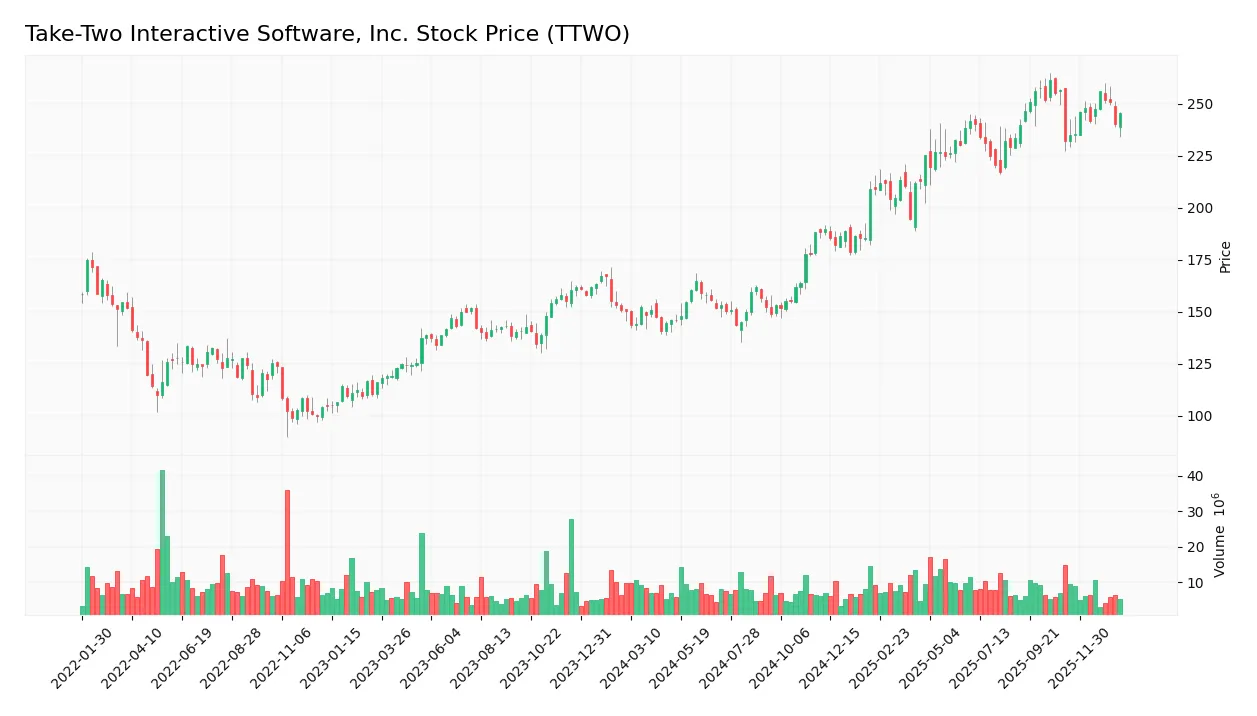
Trend Analysis
Over the past 12 months, TTWO’s stock price increased by 63.45%, indicating a bullish trend with deceleration in momentum. The stock reached a high of 261.35 and a low of 140.6, exhibiting significant volatility with a standard deviation of 39.22. Recent weeks show a moderate uptrend of 5.92% with lower volatility (std dev 7.08).
Volume Analysis
Trading volume over the last three months shows a decreasing trend, with total volume around 87M shares. Buyer volume slightly dominates at 56.27%, suggesting cautious but positive investor sentiment. This moderate buyer dominance amid declining volume indicates tempered market participation.
Target Prices
Analysts present a confident target price consensus for Take-Two Interactive Software, Inc.
| Target High | Target Low | Consensus |
|---|---|---|
| 300 | 252 | 283.44 |
The target prices suggest a bullish outlook, with most analysts expecting the stock to trade between 252 and 300, centering around 283.44.

Don’t Let Luck Decide Your Entry Point
Optimize your entry points with our advanced ProRealTime indicators. You’ll get efficient buy signals with precise price targets for maximum performance. Start outperforming now!
Analyst & Consumer Opinions
This section examines recent analyst ratings and consumer feedback related to Take-Two Interactive Software, Inc. (TTWO).
Stock Grades
The following table presents the latest verified stock grades for Take-Two Interactive Software, Inc. from reputable financial institutions:
| Grading Company | Action | New Grade | Date |
|---|---|---|---|
| Morgan Stanley | Maintain | Overweight | 2026-01-13 |
| Wells Fargo | Maintain | Overweight | 2026-01-08 |
| UBS | Maintain | Buy | 2025-11-07 |
| BMO Capital | Maintain | Outperform | 2025-11-07 |
| Wedbush | Maintain | Outperform | 2025-11-07 |
| Jefferies | Maintain | Buy | 2025-11-03 |
| Benchmark | Maintain | Buy | 2025-10-16 |
| DA Davidson | Maintain | Buy | 2025-10-09 |
| Wells Fargo | Maintain | Overweight | 2025-10-07 |
| UBS | Maintain | Buy | 2025-08-08 |
The consensus across these ratings is notably positive, with all firms maintaining Buy, Overweight, or Outperform grades. This consistency indicates sustained confidence in the stock’s prospects by major analysts.
Consumer Opinions
Consumers are expressing mixed but insightful views on Take-Two Interactive Software, Inc., reflecting both enthusiasm for its creative offerings and concerns about certain service aspects.
| Positive Reviews | Negative Reviews |
|---|---|
| “Innovative game titles with immersive storytelling.” | “Occasional bugs and delayed patches frustrate me.” |
| “Regular content updates keep the experience fresh.” | “High in-game purchase prices feel excessive.” |
| “Strong community engagement and support teams.” | “Some games suffer from server instability.” |
Overall, consumers appreciate Take-Two’s creativity and ongoing content updates but frequently point out issues with game stability and the cost of in-game purchases as notable drawbacks.
Risk Analysis
The table below summarizes the key risks associated with Take-Two Interactive Software, Inc., highlighting their probability and potential impact on investors:
| Category | Description | Probability | Impact |
|---|---|---|---|
| Financial Health | Negative net margin (-79.5%) and ROE (-209.52%) indicate ongoing profitability challenges. | High | High |
| Leverage Risk | High debt-to-equity ratio (1.92) and unfavorable interest coverage (-25.53) may strain finances. | Medium | High |
| Liquidity Risk | Current and quick ratios both at 0.78 suggest limited short-term liquidity. | Medium | Medium |
| Market Valuation | Elevated price-to-book ratio (16.98) could signal overvaluation risk. | Medium | Medium |
| Bankruptcy Risk | Altman Z-Score of 2.39 places the company in the grey zone, implying moderate bankruptcy risk. | Medium | High |
| Operational Risk | Dependence on popular game franchises exposes the company to market preference shifts. | Medium | Medium |
The most significant risks for Take-Two stem from its weak profitability and high leverage, which increase financial distress concerns despite a favorable weighted average cost of capital. The Altman Z-Score in the grey zone and an average Piotroski Score reinforce caution, signaling moderate bankruptcy risk and financial instability that investors should carefully monitor.
Should You Buy Take-Two Interactive Software, Inc.?
Take-Two Interactive appears to be facing significant challenges, with declining operational efficiency and a deteriorating competitive moat suggesting value destruction. Despite a manageable leverage profile indicated by negative net debt to EBITDA, its overall rating remains very unfavorable, reflecting caution in the investment case.
Strength & Efficiency Pillars
Take-Two Interactive Software, Inc. displays mixed efficiency signals. Its gross margin remains robust at 54.36%, reflecting solid core profitability. The Altman Z-Score of 2.39 places the company in the grey zone, indicating moderate financial stability without immediate distress. The Piotroski score of 6 suggests average financial health. However, return on equity (-209.52%) and return on invested capital (-64.98%) are deeply negative and well below the weighted average cost of capital (7.82%), meaning the company is currently destroying value rather than creating it.
Weaknesses and Drawbacks
Significant weaknesses cloud Take-Two’s investment case. Negative net margin (-79.5%) and EBIT margin (-76.72%) highlight unprofitable operations, while a high price-to-book ratio of 16.98 signals an expensive valuation despite poor earnings. The company’s leverage is concerning with a debt-to-equity ratio of 1.92 and a strained liquidity position, evidenced by current and quick ratios at 0.78, below the healthy threshold of 1. Seller dominance is absent, with buyers controlling 56.27% of recent volume, but overall volume is decreasing, which may limit price momentum.
Our Verdict about Take-Two Interactive Software, Inc.
The fundamental profile of Take-Two appears unfavorable due to persistent unprofitability and value destruction. However, the bullish overall stock trend paired with slight buyer dominance in recent weeks suggests cautious optimism. Despite the company’s long-term financial challenges, the moderate technical strength may imply that the stock could present selective opportunities, but investors might prefer a wait-and-see approach for a more compelling entry point.
Disclaimer: This content is for informational purposes only and does not constitute financial, investment, or other professional advice. Investing in financial markets involves a significant risk of loss, and past performance is not indicative of future results.
Additional Resources
- UniSuper Management Pty Ltd Has $27.62 Million Stock Position in Take-Two Interactive Software, Inc. $TTWO – MarketBeat (Jan 24, 2026)
- A Look At Take Two Interactive Software (TTWO) Valuation After Recent Share Price Weakness – Yahoo Finance (Jan 20, 2026)
- Here’s Why Take-Two Interactive (TTWO) is a Strong Growth Stock – Nasdaq (Jan 23, 2026)
- Did Concerns Over Earnings Quality and Dilution Just Shift Take-Two Interactive Software’s (TTWO) Investment Narrative? – Sahm (Jan 23, 2026)
- Take-Two Interactive stock forecast 2026–2031: Will the share price fall over the coming year? – Esports Insider (Jan 22, 2026)
For more information about Take-Two Interactive Software, Inc., please visit the official website: take2games.com