Home > Analyses > Technology > Taiwan Semiconductor Manufacturing Company Limited
Taiwan Semiconductor Manufacturing Company Limited (TSMC) drives the digital age by powering the chips at the heart of smartphones, high-performance computing, and automotive technologies. As the world’s leading semiconductor foundry, TSMC is renowned for its cutting-edge wafer fabrication processes and unwavering commitment to innovation and quality. With its dominant market position and extensive global footprint, I explore whether TSMC’s strong fundamentals continue to support its premium valuation and growth prospects in an evolving tech landscape.
Table of contents
Business Model & Company Overview
Taiwan Semiconductor Manufacturing Company Limited, founded in 1987 and headquartered in Hsinchu City, Taiwan, stands as a global leader in the semiconductor industry. The company operates a comprehensive ecosystem that encompasses wafer fabrication, integrated circuit manufacturing, packaging, and testing, serving diverse sectors such as high-performance computing, smartphones, IoT, and automotive electronics. Its extensive product range reflects a core mission to advance semiconductor technology worldwide.
The company’s revenue engine balances advanced manufacturing processes with robust customer and engineering support services, creating value through both hardware and recurring service streams. TSMC’s strategic footprint spans Taiwan, China, Europe, the Middle East, Africa, Japan, and the United States, enabling it to capture global demand efficiently. Its ability to integrate cutting-edge technology and global market reach forms a formidable economic moat, positioning it at the forefront of the semiconductor industry’s future.
Financial Performance & Fundamental Metrics
In this section, I analyze Taiwan Semiconductor Manufacturing Company Limited’s income statement, key financial ratios, and dividend payout policy to assess its financial health.
Income Statement
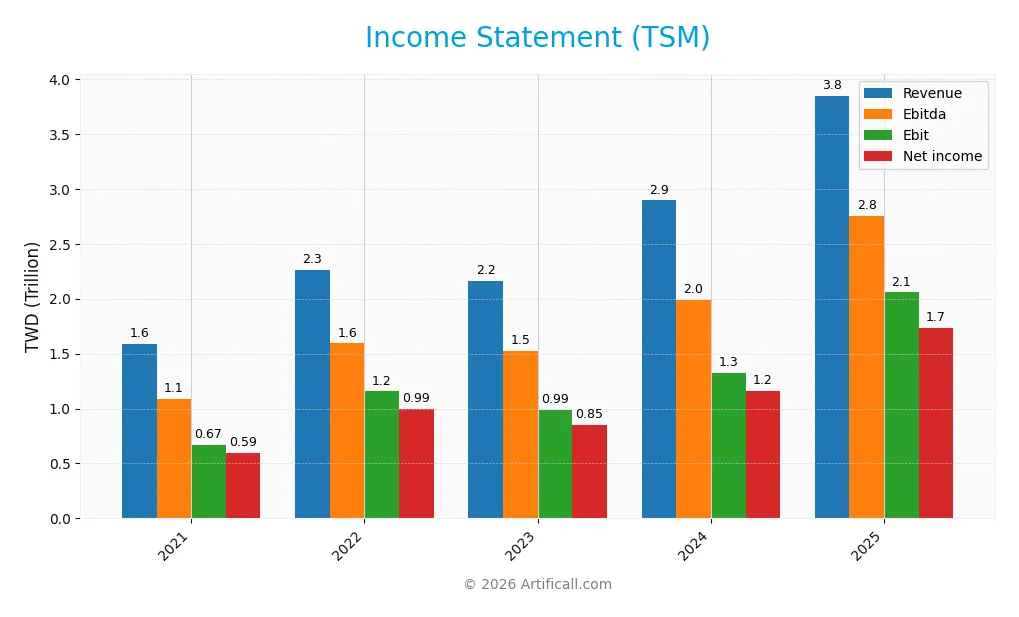
The table below presents Taiwan Semiconductor Manufacturing Company Limited’s key income statement figures for the fiscal years 2021 through 2025, reported in TWD.
| 2021 | 2022 | 2023 | 2024 | 2025 | |
|---|---|---|---|---|---|
| Revenue | 1.59T | 2.26T | 2.16T | 2.89T | 3.85T |
| Cost of Revenue | 768B | 916B | 987B | 1.27T | 1.54T |
| Operating Expenses | 170B | 227B | 254B | 302B | 349B |
| Gross Profit | 820B | 1.35T | 1.18T | 1.62T | 2.30T |
| EBITDA | 1.09T | 1.59T | 1.52T | 1.98T | 2.75T |
| EBIT | 668B | 1.16T | 991B | 1.32T | 2.06T |
| Interest Expense | 5.41B | 11.75B | 12.0B | 10.5B | 0 |
| Net Income | 592B | 993B | 852B | 1.16T | 1.74T |
| EPS | 114.2 | 191.45 | 164.25 | 223.4 | 334.6 |
| Filing Date | 2022-04-14 | 2023-04-20 | 2024-04-18 | 2025-04-17 | 2025-12-31 |
Income Statement Evolution
From 2021 to 2025, Taiwan Semiconductor Manufacturing Company Limited (TSM) exhibited strong revenue growth, rising 142% overall, with a 33% increase in the latest year. Net income surged 193% over the period, with a 13% rise in the most recent year. Margins improved steadily, with gross margin reaching 59.9% and net margin 45.1%, reflecting enhanced profitability and efficient cost management.
Is the Income Statement Favorable?
In 2025, TSM reported revenue of approximately 3.85T TWD and net income of 1.74T TWD, supported by a solid EBIT margin of 53.5%. Operating expenses grew in line with revenue, maintaining favorable operational leverage. The absence of interest expense and significant EPS growth of nearly 50% reinforce the strong earnings quality. Overall, the income statement fundamentals for 2025 are assessed as favorable, reflecting robust growth and margin expansion.
Financial Ratios
The following table presents key financial ratios for Taiwan Semiconductor Manufacturing Company Limited (TSM) over the past five fiscal years, illustrating profitability, valuation, liquidity, leverage, efficiency, and dividend metrics:
| Ratios | 2021 | 2022 | 2023 | 2024 | 2025 |
|---|---|---|---|---|---|
| Net Margin | 37% | 44% | 39% | 40% | 45% |
| ROE | 28% | 34% | 25% | 27% | 32% |
| ROIC | 19% | 24% | 17% | 20% | 25% |
| P/E | 29.1 | 11.9 | 19.4 | 29.0 | 28.5 |
| P/B | 8.0 | 4.1 | 4.8 | 7.9 | 9.1 |
| Current Ratio | 2.12 | 2.08 | 2.33 | 2.36 | 2.62 |
| Quick Ratio | 1.86 | 1.86 | 2.06 | 2.14 | 2.42 |
| D/E | 0.35 | 0.31 | 0.28 | 0.25 | 0.18 |
| Debt-to-Assets | 20% | 18% | 17% | 16% | 13% |
| Interest Coverage | 120x | 95x | 77x | 126x | 0 |
| Asset Turnover | 0.43 | 0.46 | 0.39 | 0.43 | 0.49 |
| Fixed Asset Turnover | 0.79 | 0.83 | 0.70 | 0.88 | 1.05 |
| Dividend Yield | 1.54% | 2.41% | 1.76% | 1.08% | 0.95% |
*Ratios are rounded for clarity. Interest coverage for 2025 is reported as zero.*
Evolution of Financial Ratios
Taiwan Semiconductor Manufacturing Company Limited (TSM) demonstrated an improving trend in Return on Equity (ROE), rising from 27.3% in 2021 to 32.1% in 2025, indicating enhanced profitability. The Current Ratio steadily increased from 2.12 to 2.62, reflecting stronger short-term liquidity. Meanwhile, the Debt-to-Equity Ratio consistently declined from 0.35 to 0.18, signifying reduced leverage and improved financial stability.
Are the Financial Ratios Favorable?
In 2025, TSM’s profitability ratios, including a 45.1% net margin and 32.1% ROE, are favorable, alongside a solid Return on Invested Capital of 24.9%. Liquidity ratios such as the Current Ratio (2.62) and Quick Ratio (2.42) are also favorable, supporting operational efficiency. Leverage remains low with a Debt-to-Equity of 0.18 and debt-to-assets at 12.5%, both favorable. However, valuation multiples like Price-to-Earnings (28.45) and Price-to-Book (9.14) are unfavorable, as is the asset turnover ratio (0.49), while dividend yield remains low at 0.95%. Overall, the global assessment is favorable.
Shareholder Return Policy
Taiwan Semiconductor Manufacturing Company Limited maintains a consistent dividend payout ratio around 27-34%, with dividends per share rising steadily from 51.25 TWD in 2021 to 90.92 TWD in 2025. The annual dividend yield remains below 2.5%, supported by strong free cash flow coverage and moderate share buybacks.
This balanced approach between dividends and buybacks suggests a commitment to sustainable shareholder returns without overextending cash resources. The policy reflects prudent risk management, aiming to preserve long-term value through disciplined distributions aligned with solid profitability and cash generation.
Score analysis
The radar chart below presents an overview of Taiwan Semiconductor Manufacturing Company Limited’s key financial scores:
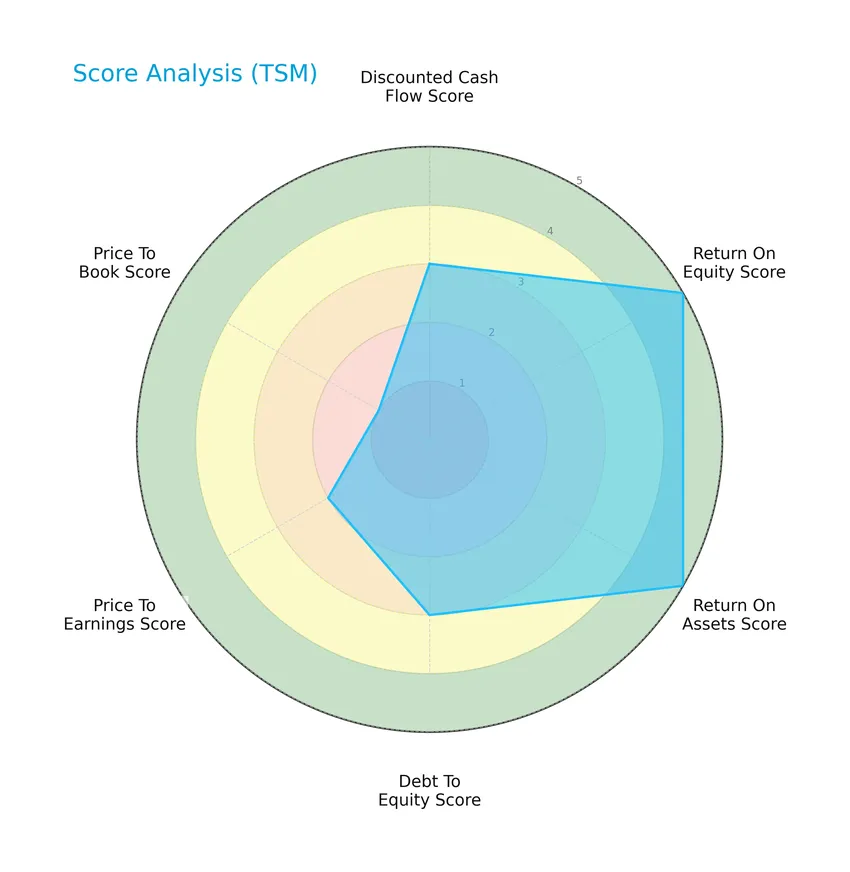
The company demonstrates very favorable profitability scores with return on equity and assets both rated 5. Leverage and valuation metrics are mixed: debt-to-equity is moderate at 3, price-to-earnings is moderate at 2, while price-to-book is very unfavorable at 1, indicating some valuation concerns.
Analysis of the company’s bankruptcy risk
Taiwan Semiconductor Manufacturing Company Limited’s Altman Z-Score places it in the grey zone, suggesting a moderate risk of bankruptcy that warrants close monitoring:

Is the company in good financial health?
The Piotroski Score diagram illustrates Taiwan Semiconductor Manufacturing Company Limited’s strong financial health status:

With a Piotroski Score of 8, the company exhibits very strong financial strength, reflecting solid profitability, efficiency, and liquidity metrics that support its overall financial stability.
Competitive Landscape & Sector Positioning
This sector analysis will explore Taiwan Semiconductor Manufacturing Company Limited’s strategic positioning, revenue by segment, key products, main competitors, and competitive advantages. I will also conduct a SWOT analysis to provide a comprehensive view. The goal is to determine whether the company holds a competitive advantage over its rivals in the semiconductor industry.
Strategic Positioning
Taiwan Semiconductor Manufacturing Company Limited maintains a concentrated product portfolio focused on wafer fabrication, which dominated revenue with over 1.9T TWD in 2022, alongside smaller other product lines. Geographically, its exposure is diversified, with significant sales in the United States (1.99T TWD in 2024), China (331B TWD), Taiwan (270B TWD), Japan, and EMEA regions.
Revenue by Segment
This pie chart illustrates Taiwan Semiconductor Manufacturing Company Limited’s revenue distribution by product segment for the fiscal year 2024.
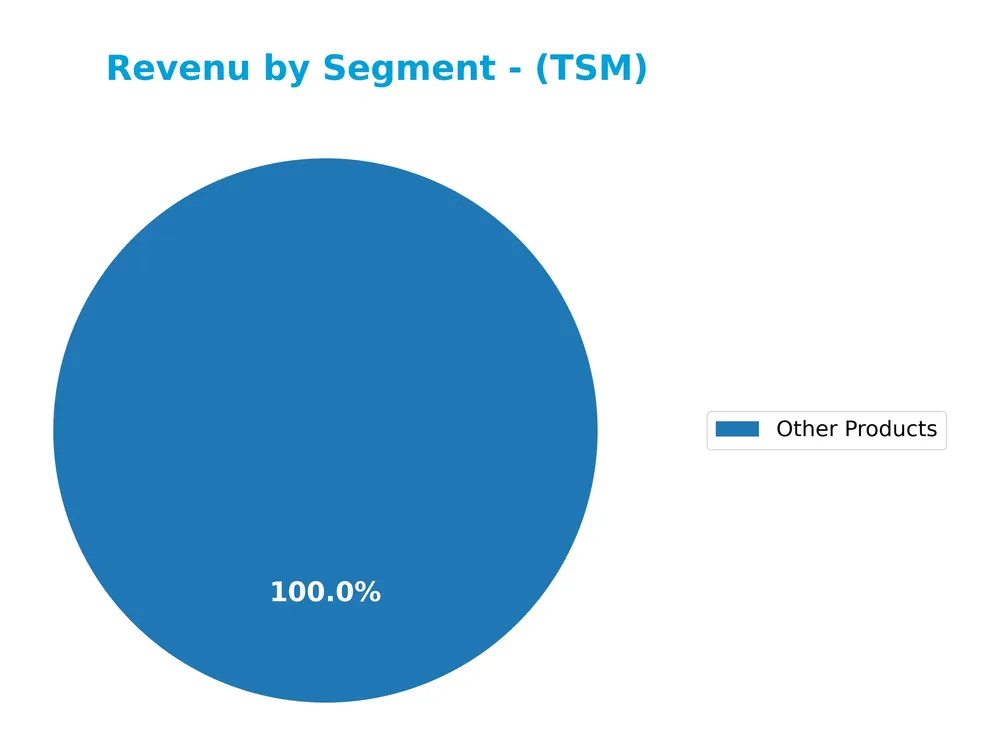
The wafer segment consistently dominates TSM’s revenue, reaching 1.99T TWD in 2022, showing strong growth from 874B TWD in 2017. Other Products, while smaller, have increased from 103B TWD in 2017 to 380B TWD in 2024. The recent data suggests a concentration risk as wafer revenue remains the core driver, with Other Products growing but still secondary.
Key Products & Brands
The following table outlines the main products and brands offered by Taiwan Semiconductor Manufacturing Company Limited:
| Product | Description |
|---|---|
| Wafer | Semiconductor wafers manufactured using various fabrication processes including CMOS logic and mixed-signal. |
| Other Products | Includes integrated circuits, masks, color filters, packaging, testing, and engineering support services. |
Taiwan Semiconductor Manufacturing Company Limited primarily generates revenue from wafer fabrication complemented by other semiconductor-related products and services, supporting diverse industries such as high-performance computing and smartphones.
Main Competitors
There are 38 competitors in the semiconductors sector; below are the top 10 leaders by market capitalization:
| Competitor | Market Cap. |
|---|---|
| NVIDIA Corporation | 4.60T |
| Broadcom Inc. | 1.64T |
| Taiwan Semiconductor Manufacturing Company Limited | 1.58T |
| ASML Holding N.V. | 415B |
| Advanced Micro Devices, Inc. | 363B |
| Micron Technology, Inc. | 353B |
| Lam Research Corporation | 232B |
| Applied Materials, Inc. | 214B |
| QUALCOMM Incorporated | 185B |
| Intel Corporation | 173B |
Taiwan Semiconductor Manufacturing Company Limited ranks 3rd among 38 competitors, with a market cap about 38% that of the sector leader, NVIDIA. It stands above both the average market cap of the top 10 competitors (975B) and the median market cap in the sector (31B). The company maintains a roughly 5.7% gap below its closest competitor, Broadcom, indicating a solid but competitive position in the industry.
Comparisons with competitors
Check out how we compare the company to its competitors:
Does TSM have a competitive advantage?
Taiwan Semiconductor Manufacturing Company Limited (TSM) presents a clear competitive advantage, demonstrated by a very favorable moat status and a ROIC exceeding WACC by over 15%, indicating consistent value creation. The company’s growing ROIC trend of 32% over the 2021-2025 period underscores its increasing profitability and efficient capital use.
Looking ahead, TSM’s future outlook includes continued innovation in semiconductor wafer fabrication and expansion across multiple global markets, including high-growth regions such as the United States, China, and Europe. Its broad product range serves diverse applications like high-performance computing, smartphones, IoT, automotive, and digital consumer electronics, suggesting ongoing opportunities for growth.
SWOT Analysis
This analysis highlights the key internal and external factors impacting Taiwan Semiconductor Manufacturing Company Limited (TSMC) to inform strategic investment decisions.
Strengths
- Market leader in semiconductor manufacturing
- Strong profitability with 45.1% net margin
- Robust global presence including US, China, Taiwan
- Consistent revenue and earnings growth above 30% annually
Weaknesses
- High price-to-book ratio of 9.14 indicating possible overvaluation
- Moderate asset turnover of 0.49 limiting operational efficiency
- Dividend yield under 1% may deter income-focused investors
Opportunities
- Growing demand for advanced chips in AI, automotive, IoT sectors
- Expansion potential in emerging markets and technology startups
- Increasing ROIC vs WACC shows value creation and durable moat
Threats
- Geopolitical risks from China-Taiwan-US tensions
- Intense competition from global chipmakers and tech shifts
- Cyclical semiconductor market volatility affecting demand
TSMC’s strong financial performance and competitive moat position it well for growth, yet investors should weigh valuation concerns and geopolitical risks carefully. The company’s strategy should focus on innovation and diversification to capitalize on rising chip demand while managing external uncertainties.
Stock Price Action Analysis
The following weekly stock chart illustrates Taiwan Semiconductor Manufacturing Company Limited’s price movements over the past 12 months:
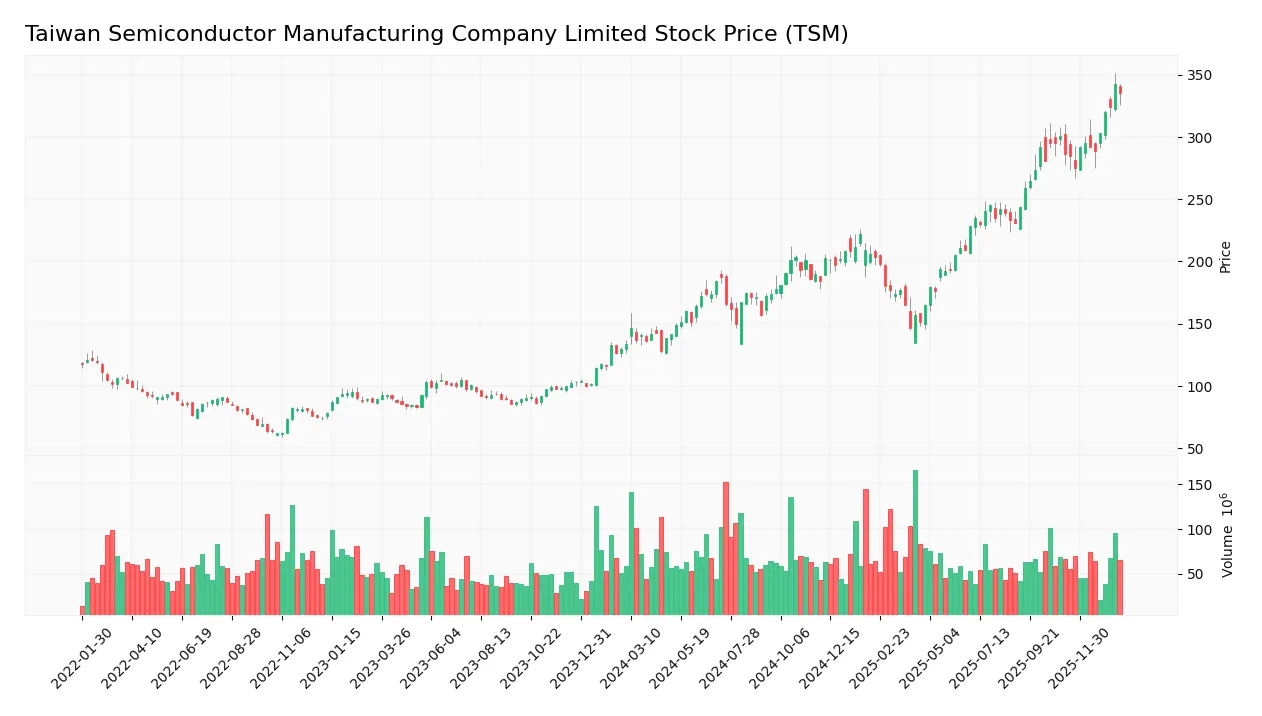
Trend Analysis
Over the past 12 months, TSM’s stock price increased by 150.09%, indicating a strong bullish trend with clear acceleration. The price ranged between a low of 127.7 and a high of 342.4, supported by a high volatility level reflected in a standard deviation of 52.69. Recent months show continued positive momentum.
Volume Analysis
In the last three months, trading volume has been decreasing overall, with buyer volume at 314M and seller volume at 396M, indicating slight seller dominance of 44.19%. This suggests cautious investor sentiment and a moderate reduction in market participation during the recent period.
Target Prices
The consensus target prices for Taiwan Semiconductor Manufacturing Company Limited (TSM) indicate a positive outlook among analysts.
| Target High | Target Low | Consensus |
|---|---|---|
| 450 | 330 | 397.5 |
Analysts expect the stock to trade between 330 and 450, with a consensus target around 397.5, reflecting moderate confidence in its growth potential.

Don’t Let Luck Decide Your Entry Point
Optimize your entry points with our advanced ProRealTime indicators. You’ll get efficient buy signals with precise price targets for maximum performance. Start outperforming now!
Analyst & Consumer Opinions
This section examines recent analyst ratings and consumer feedback related to Taiwan Semiconductor Manufacturing Company Limited (TSM).
Stock Grades
The following table presents the most recent verified stock grades for Taiwan Semiconductor Manufacturing Company Limited from recognized financial institutions:
| Grading Company | Action | New Grade | Date |
|---|---|---|---|
| TD Cowen | Maintain | Hold | 2026-01-16 |
| Barclays | Maintain | Overweight | 2026-01-16 |
| Needham | Maintain | Buy | 2026-01-15 |
| Bernstein | Maintain | Outperform | 2025-12-08 |
| Needham | Maintain | Buy | 2025-10-27 |
| Barclays | Maintain | Overweight | 2025-10-17 |
| Needham | Maintain | Buy | 2025-10-16 |
| Susquehanna | Maintain | Positive | 2025-10-10 |
| Barclays | Maintain | Overweight | 2025-10-09 |
| Barclays | Maintain | Overweight | 2025-09-16 |
The overall trend in these grades indicates a consistent positive outlook, with multiple firms maintaining buy or overweight ratings. No recent downgrades have been recorded, reflecting stable confidence in the company’s prospects.
Consumer Opinions
When it comes to Taiwan Semiconductor Manufacturing Company Limited (TSM), consumer sentiment reveals a mix of admiration for innovation and concerns about pricing.
| Positive Reviews | Negative Reviews |
|---|---|
| “TSM consistently delivers cutting-edge chip technology with impressive performance.” | “The cost of some semiconductor products can be quite high for smaller businesses.” |
| “Excellent customer support and reliable supply chain management.” | “Occasional delays in product delivery during peak demand periods.” |
| “Strong commitment to sustainability and advanced manufacturing processes.” | “Limited customization options for specific client needs.” |
Overall, consumers appreciate TSM’s technological leadership and robust support but express concerns about pricing and occasional delivery delays. These insights highlight the company’s strengths in innovation and service, balanced by areas for operational improvement.
Risk Analysis
The following table summarizes key risks facing Taiwan Semiconductor Manufacturing Company Limited (TSM) and their likelihood and potential impact:
| Category | Description | Probability | Impact |
|---|---|---|---|
| Market Valuation | Elevated price-to-book ratio (9.14) and PE ratio (28.45) may limit upside. | Medium | Medium |
| Geopolitical Risk | Taiwan’s political tensions with China could disrupt operations or supply. | High | High |
| Industry Cyclicality | Semiconductor demand fluctuates with global economic cycles. | Medium | Medium |
| Technology Risk | Rapid innovation requires continuous investment to maintain leadership. | Medium | High |
| Currency Fluctuation | Exposure to multiple currencies may affect reported earnings. | Medium | Low |
The most pressing risks are geopolitical tensions impacting Taiwan, given the company’s Taiwan base, and the need to maintain technological edge amid fast innovation. Despite a strong Piotroski score of 8, TSM’s Altman Z-score in the grey zone (2.94) calls for cautious monitoring of financial stability. Elevated valuation metrics also suggest limited margin for valuation expansion.
Should You Buy Taiwan Semiconductor Manufacturing Company Limited?
Taiwan Semiconductor Manufacturing Company Limited appears to be characterized by robust profitability and a durable competitive moat supported by growing ROIC, while maintaining a manageable leverage profile. Despite mixed valuation signals, its overall B+ rating suggests a generally favorable financial health with moderate risk considerations.
Strength & Efficiency Pillars
Taiwan Semiconductor Manufacturing Company Limited (TSM) showcases robust profitability with a net margin of 45.1% and a return on equity (ROE) of 32.12%. The company is a clear value creator, as its return on invested capital (ROIC) stands at 24.92%, significantly surpassing its weighted average cost of capital (WACC) at 9.74%. Financial health is solid, with an Altman Z-Score of 2.94 placing it in the grey zone but supported by a very strong Piotroski Score of 8, reflecting excellent operational efficiency and low bankruptcy risk.
Weaknesses and Drawbacks
Despite strong fundamentals, TSM faces valuation and market pressure challenges. Its price-to-earnings (P/E) ratio of 28.45 and a notably high price-to-book (P/B) ratio of 9.14 suggest a premium valuation that may limit upside potential. Market dynamics show a slight seller dominance recently, with buyer volume at 44.19%, potentially signaling short-term headwinds. Additionally, asset turnover is relatively low at 0.49, indicating less efficient use of assets compared to peers, and the dividend yield is modest at 0.95%, which might not attract income-focused investors.
Our Verdict about Taiwan Semiconductor Manufacturing Company Limited
TSM’s long-term fundamental profile appears favorable, supported by strong profitability and value creation metrics. However, despite an overall bullish price trend and solid financial health, recent market behavior shows slight seller dominance, suggesting a cautious stance. This combination implies that while TSM may appear attractive for long-term exposure, investors could consider waiting for a more favorable entry point amid short-term market pressures.
Disclaimer: This content is for informational purposes only and does not constitute financial, investment, or other professional advice. Investing in financial markets involves a significant risk of loss, and past performance is not indicative of future results.
Additional Resources
- Modera Wealth Management LLC Trims Holdings in Taiwan Semiconductor Manufacturing Company Ltd. $TSM – MarketBeat (Jan 24, 2026)
- Taiwan Semiconductor Shrinks Old Chip Lines, Goes All-In On Next-Gen Tech – Sahm (Jan 24, 2026)
- Trek Financial LLC Buys 11,640 Shares of Taiwan Semiconductor Manufacturing Company Ltd. $TSM – MarketBeat (Jan 24, 2026)
- Taiwan Semiconductor Manufacturing Company Ltd. $TSM Shares Acquired by Jennison Associates LLC – MarketBeat (Jan 24, 2026)
- Union Heritage Capital LLC Boosts Stock Position in Taiwan Semiconductor Manufacturing Company Ltd. $TSM – MarketBeat (Jan 23, 2026)
For more information about Taiwan Semiconductor Manufacturing Company Limited, please visit the official website: tsmc.com