Home > Analyses > Financial Services > T. Rowe Price Group, Inc.
T. Rowe Price Group, Inc. shapes the financial futures of millions by expertly managing global investments. Renowned for its disciplined, bottom-up approach, it blends fundamental and quantitative analysis to deliver consistent asset management. The firm’s legacy in innovation and commitment to ESG principles underpin its industry leadership. As markets evolve, I ask: does T. Rowe Price’s robust foundation still justify its growth prospects and valuation in 2026?

Table of contents
Business Model & Company Overview
T. Rowe Price Group, Inc. stands as a dominant force in asset management, founded in 1937 and headquartered in Baltimore, MD. The firm operates a cohesive ecosystem of equity and fixed income mutual funds, serving individuals, institutions, and retirement plans. Its disciplined, bottom-up investment approach integrates fundamental and quantitative analysis with a focus on environmental, social, and governance principles, shaping a resilient and forward-looking portfolio.
The company’s revenue engine balances management fees from actively managed mutual funds with strategic global reach across the Americas, Europe, and Asia. Its presence in key financial hubs supports in-house and external research, driving consistent value creation. With 8K+ employees worldwide, T. Rowe Price’s economic moat lies in its trusted brand and integrated investment process, securing its pivotal role in the evolving asset management landscape.
Financial Performance & Fundamental Metrics
I analyze T. Rowe Price Group’s income statement, key financial ratios, and dividend payout policy to assess its core financial health and shareholder value.
Income Statement
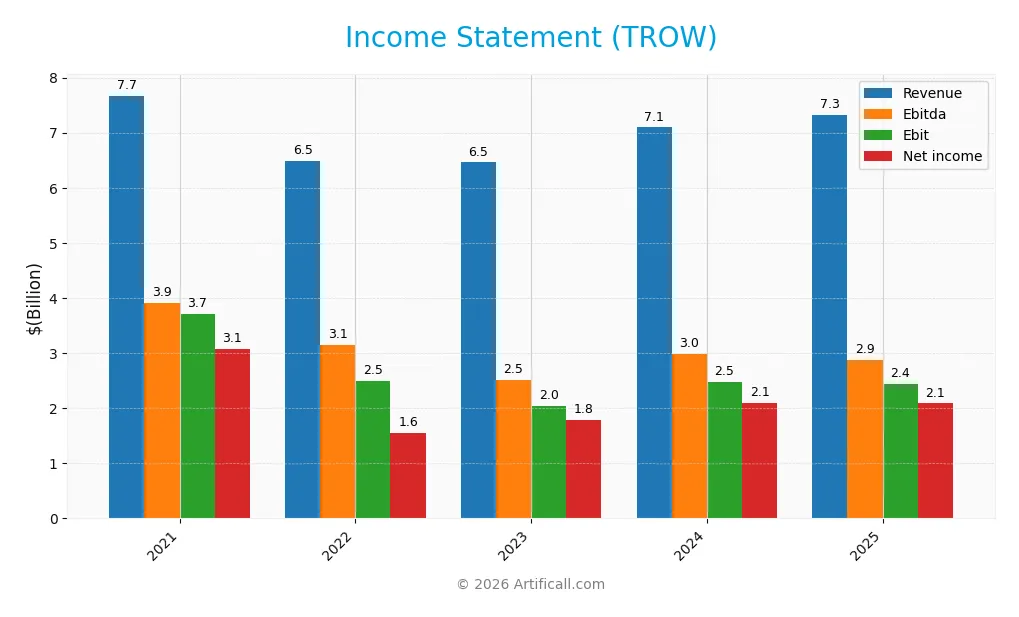
The table below summarizes T. Rowe Price Group, Inc.’s key income statement figures for fiscal years 2021 through 2025, showing revenue, expenses, and profitability metrics.
| 2021 | 2022 | 2023 | 2024 | 2025 | |
|---|---|---|---|---|---|
| Revenue | 7.67B | 6.49B | 6.46B | 7.09B | 7.31B |
| Cost of Revenue | 2.99B | 2.92B | 3.25B | 3.41B | 2.73B |
| Operating Expenses | 969M | 1.19B | 1.22B | 1.35B | 2.40B |
| Gross Profit | 4.68B | 3.57B | 3.21B | 3.68B | 4.58B |
| EBITDA | 3.91B | 3.14B | 2.52B | 2.98B | 2.88B |
| EBIT | 3.71B | 2.50B | 2.04B | 2.48B | 2.45B |
| Interest Expense | 0 | 0 | 0 | 0 | 0 |
| Net Income | 3.08B | 1.56B | 1.79B | 2.10B | 2.09B |
| EPS | 13.25 | 6.73 | 7.78 | 9.18 | 9.26 |
| Filing Date | 2022-02-24 | 2023-02-15 | 2024-02-16 | 2025-02-14 | 2026-02-13 |
Income Statement Evolution
From 2021 to 2025, T. Rowe Price’s revenue declined by 4.65%, signaling headwinds in top-line growth. Net income fell 32.3%, reflecting margin compression. Gross margin remained strong at 62.7%, but net margin shrank nearly 29%, indicating rising costs or lower pricing power. The one-year trend shows modest revenue growth of 3.1% but weaker EBIT and net margin results.
Is the Income Statement Favorable?
The 2025 income statement reveals solid profitability with a 28.5% net margin and zero interest expense, favorable for a financial firm. However, EBIT declined 1.2% year-over-year despite a 24.4% jump in gross profit. Operating expenses grew in line with revenue, weighing on margins. Overall, fundamentals appear mixed with cost pressures limiting earnings growth despite revenue resilience.
Financial Ratios
The table below presents key financial ratios for T. Rowe Price Group, Inc. over the past five fiscal years, offering a snapshot of its profitability, valuation, liquidity, leverage, and efficiency:
| Ratios | 2021 | 2022 | 2023 | 2024 | 2025 |
|---|---|---|---|---|---|
| Net Margin | 40% | 24% | 28% | 30% | 29% |
| ROE | 34% | 18% | 19% | 20% | 19% |
| ROIC | 24% | 16% | 12% | 14% | 22% |
| P/E | 14.5x | 15.8x | 13.5x | 12.0x | 11.0x |
| P/B | 4.9x | 2.8x | 2.5x | 2.4x | 2.1x |
| Current Ratio | 5.1x | 5.5x | 5.9x | 8.0x | 6.7x |
| Quick Ratio | 5.1x | 5.5x | 5.9x | 8.0x | 6.7x |
| D/E | 0.03x | 0.03x | 0.03x | 0.03x | 0.04x |
| Debt-to-Assets | 2.0% | 2.8% | 2.5% | 2.1% | 3.1% |
| Interest Coverage | 0 | 0 | 0 | 0 | 0 |
| Asset Turnover | 0.61x | 0.56x | 0.53x | 0.53x | 0.51x |
| Fixed Asset Turnover | 8.2x | 6.3x | 6.2x | 5.9x | 6.0x |
| Dividend Yield | 3.8% | 4.5% | 4.6% | 4.5% | 5.0% |
Evolution of Financial Ratios
T. Rowe Price Group’s Return on Equity (ROE) fluctuated, peaking near 34% in 2021, then moderating to 19.2% by 2025. The Current Ratio showed variability, rising from 5.07 in 2021 to 8.01 in 2024 before settling at 6.73 in 2025. Debt-to-Equity remained consistently low, around 0.03 to 0.04, indicating stable leverage. Profitability margins exhibited some volatility but generally stayed strong.
Are the Financial Ratios Favorable?
In 2025, profitability ratios like net margin (28.5%) and ROE (19.2%) are favorable, reflecting efficient capital use. Liquidity is mixed; the high current ratio (6.73) is unfavorable, possibly indicating excess short-term assets, yet the quick ratio is favorable. Leverage metrics remain low and favorable. Market valuation multiples show neutrality to favorability, supporting a generally favorable overall financial profile.
Shareholder Return Policy
T. Rowe Price Group, Inc. maintains a consistent dividend payout ratio near 54%, with a dividend yield around 4.9% in 2025. The company supports dividends through robust free cash flow and manages share buybacks to enhance shareholder value.
This disciplined distribution aligns with sustainable long-term value creation. The coverage of dividends and capital expenditures by cash flows remains strong, mitigating risks of overextension in payouts or repurchases.
Score analysis
The radar chart below presents a comprehensive view of T. Rowe Price Group’s key financial scores:
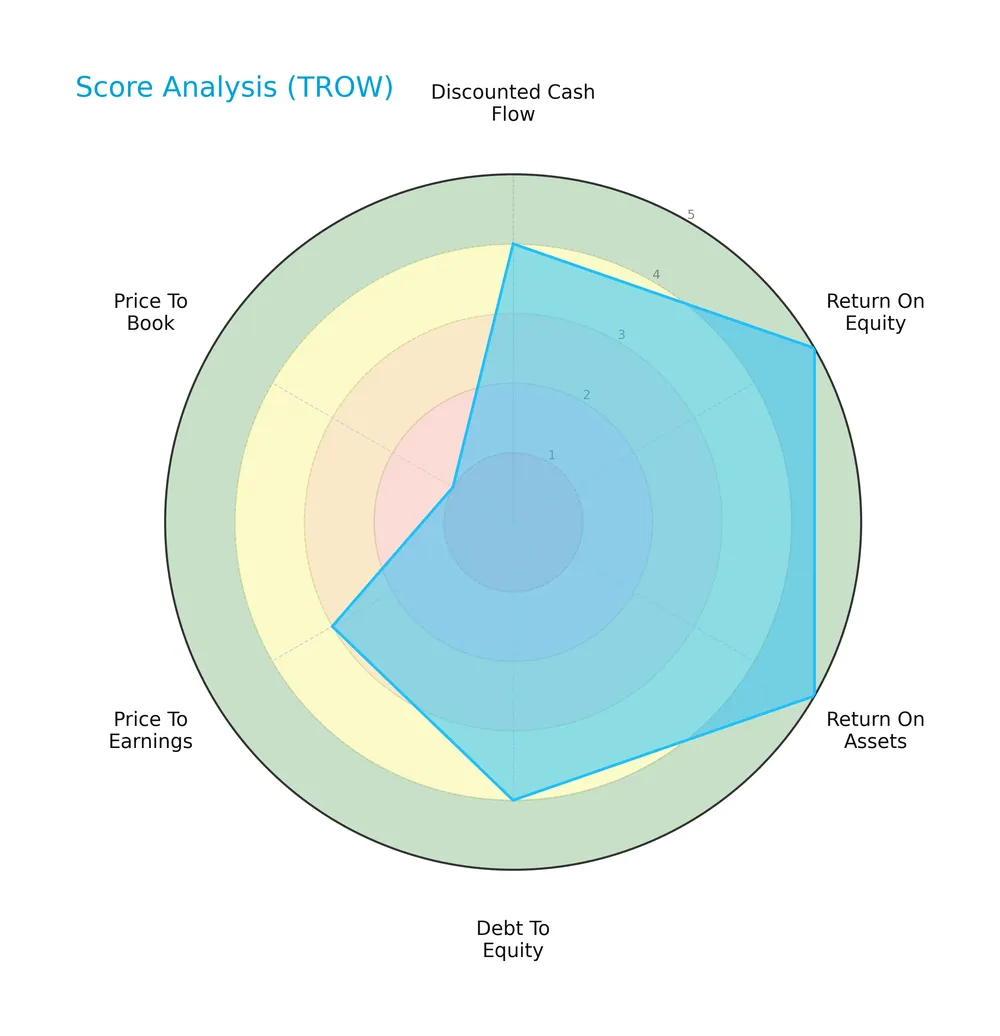
T. Rowe Price scores very favorably on return on equity and assets, indicating strong profitability. Debt to equity and discounted cash flow scores are favorable. However, price to book is very unfavorable, and price to earnings is moderate, reflecting valuation challenges.
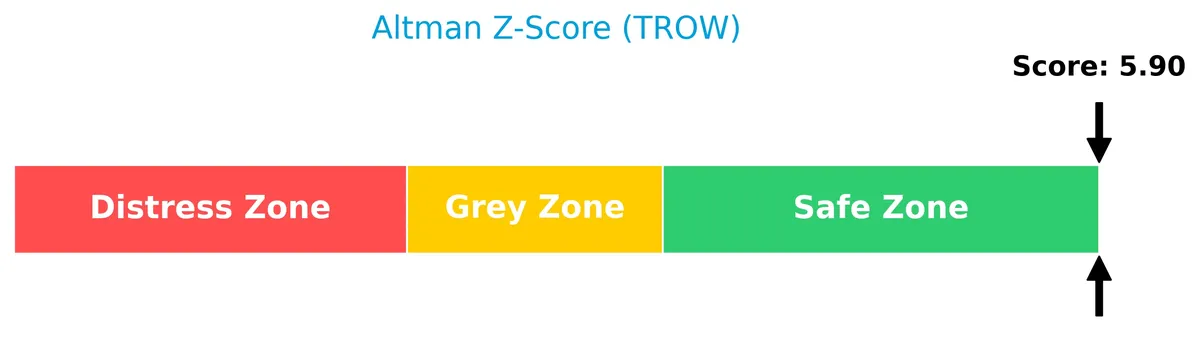
Analysis of the company’s bankruptcy risk
The Altman Z-Score places the company firmly in the safe zone, signaling a low risk of bankruptcy:
Is the company in good financial health?
The Piotroski diagram illustrates the company’s financial health based on nine criteria:

With a Piotroski score of 4, the company’s financial strength is average, suggesting moderate operational and financial robustness but room for improvement.
Competitive Landscape & Sector Positioning
This sector analysis examines T. Rowe Price Group, Inc.’s strategic positioning, revenue segments, key products, and main competitors. I will assess whether the company holds a competitive advantage in the asset management industry.
Strategic Positioning
T. Rowe Price Group concentrates primarily on asset management, generating $6.6B in 2025, with minor contributions from administrative services and capital allocation income. Its geographic presence spans major financial hubs globally, reflecting a focused yet internationally diversified investment management strategy.
Revenue by Segment
The pie chart illustrates T. Rowe Price Group’s revenue distribution by segment for the fiscal year 2025, highlighting the company’s primary income sources and relative scale.
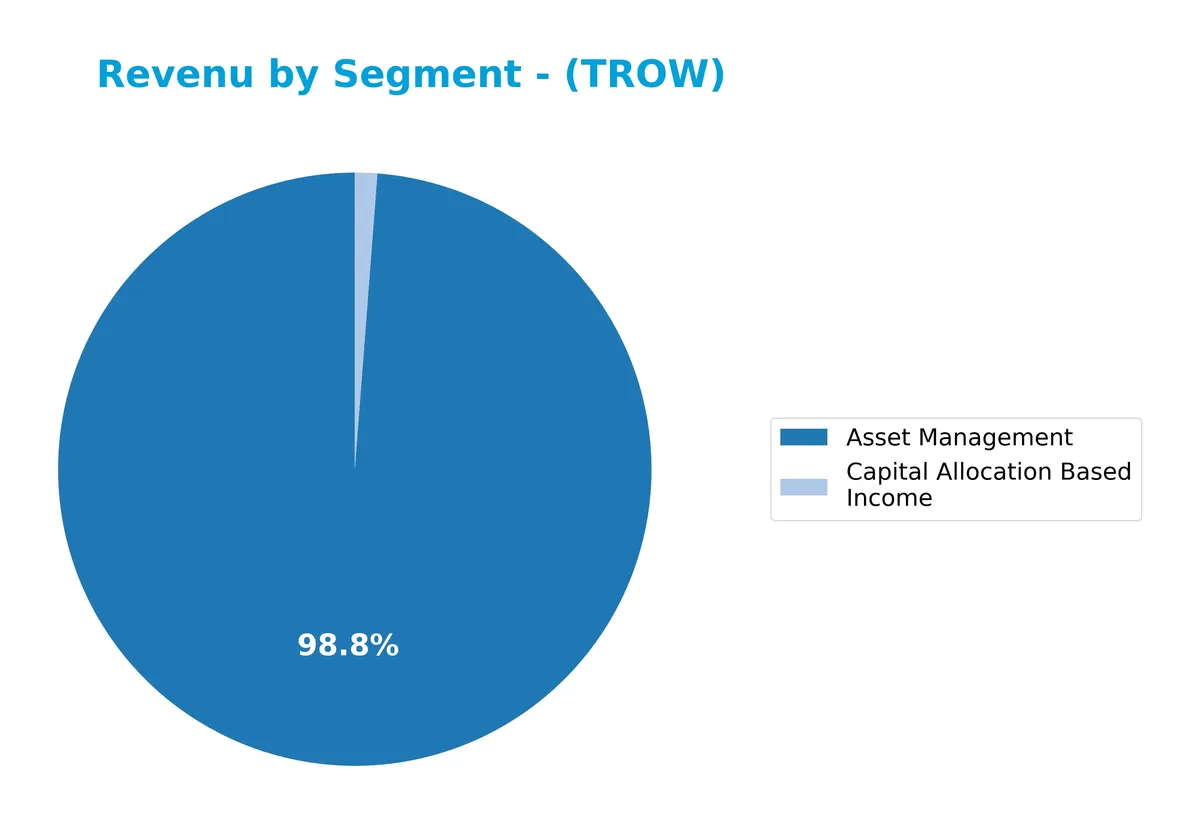
Asset Management remains the dominant revenue driver at $6.6B in 2025, showing steady growth from $4.9B in 2018. Administrative Service revenue, once a stable $500M+ segment, has nearly vanished from 2025 reporting, signaling a possible strategic shift or consolidation. Capital Allocation Based Income, while still modest at $81M, has rebounded from a negative in 2022, suggesting cautious but improving returns on invested capital.
Key Products & Brands
T. Rowe Price Group’s revenue streams from its core products and services include:
| Product | Description |
|---|---|
| Asset Management | Manages equity and fixed income mutual funds for individuals, institutions, and retirement plans. |
| Administrative Service | Provides support services related to investment management operations. |
| Capital Allocation Based Income | Generates income from strategic investments, including late-stage venture capital transactions. |
T. Rowe Price’s primary revenue driver remains asset management, consistently contributing over $6.6B in 2025. Administrative services offer steady supplementary income, while capital allocation income fluctuates, reflecting investment cycle dynamics.
Main Competitors
There are 11 competitors in total; this table lists the top 10 leaders by market capitalization:
| Competitor | Market Cap. |
|---|---|
| Blackstone Inc. | 191B |
| BlackRock, Inc. | 168B |
| KKR & Co. Inc. | 115B |
| The Bank of New York Mellon Corporation | 82B |
| Ares Management Corporation | 55B |
| Ameriprise Financial, Inc. | 46B |
| State Street Corporation | 36B |
| Northern Trust Corporation | 26B |
| T. Rowe Price Group, Inc. | 23B |
| Franklin Resources, Inc. | 12B |
T. Rowe Price Group ranks 9th among its competitors, holding 10.75% of the market cap of the leader, Blackstone Inc. It stands below both the average market cap of the top 10 (75B) and the sector median (46B). The company maintains a 28.5% gap from the next competitor above, Northern Trust Corporation.
Comparisons with competitors
Check out how we compare the company to its competitors:
Does TROW have a competitive advantage?
T. Rowe Price Group, Inc. demonstrates a competitive advantage by creating value, as its ROIC exceeds WACC by 11.6%. However, profitability shows a declining trend, signaling caution.
Future opportunities include expanding its global footprint and leveraging its expertise in equity and fixed income funds, alongside socially responsible investing and late-stage venture capital transactions.
SWOT Analysis
This analysis highlights T. Rowe Price Group’s internal capabilities and external market factors shaping its strategic outlook.
Strengths
- strong ROIC at 22.35% well above WACC
- robust net margin near 29%
- low debt levels with 0.04 D/E ratio
Weaknesses
- declining ROIC trend signals weakening profitability
- negative net income growth over 5 years
- moderate Piotroski score of 4 signals average financial strength
Opportunities
- growing demand for ESG and socially responsible investing
- expansion in late-stage venture capital investments
- opportunity to leverage global footprint for new markets
Threats
- rising operational expenses impacting EBIT growth
- intense competition in asset management sector
- macroeconomic volatility affecting asset flows and fees
T. Rowe Price has a solid value-creating moat but faces profitability pressures and growth challenges. Its strategy must focus on operational efficiency and capitalizing on ESG trends to sustain competitive advantage.
Stock Price Action Analysis
The weekly stock chart for T. Rowe Price Group, Inc. displays price movements and volatility over the past 12 months:
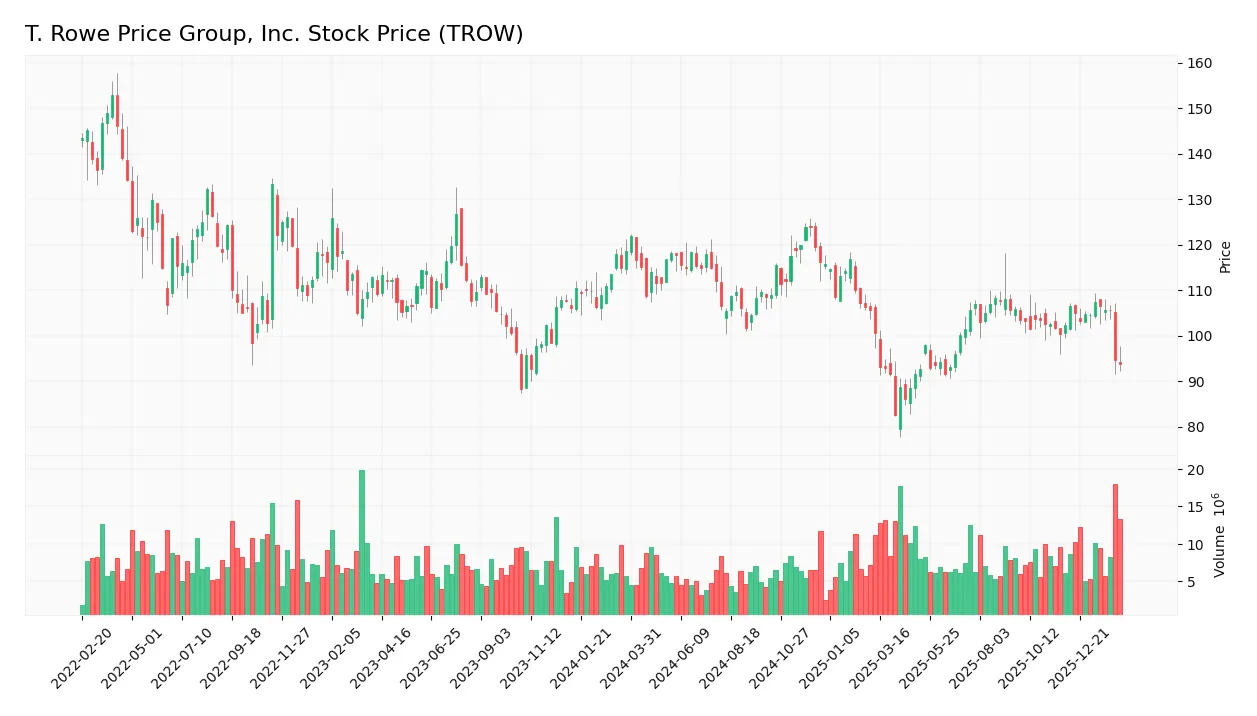
Trend Analysis
Over the past year, TROW’s stock price declined sharply by 20.96%, indicating a bearish trend. The price moved from a high of 123.84 to a low of 82.6, with volatility measured by an 8.91% standard deviation. The downtrend shows signs of deceleration.
Volume Analysis
Trading volume has increased overall, totaling 888M shares, with sellers slightly outnumbering buyers at 52.3%. In the recent three months, seller dominance intensified, with buyer volume at 38M versus seller volume at 74M. This suggests weakening investor confidence and heightened selling pressure.
Target Prices
Analysts set a clear target price consensus for T. Rowe Price Group, Inc.
| Target Low | Target High | Consensus |
|---|---|---|
| 94 | 115 | 106.25 |
The consensus target range indicates moderate upside potential, reflecting analysts’ confidence in steady growth for TROW.

Don’t Let Luck Decide Your Entry Point
Optimize your entry points with our advanced ProRealTime indicators. You’ll get efficient buy signals with precise price targets for maximum performance. Start outperforming now!
Analyst & Consumer Opinions
This section examines the latest analyst ratings and consumer feedback for T. Rowe Price Group, Inc. (TROW).
Stock Grades
Here are the latest verified grades from leading financial institutions for T. Rowe Price Group, Inc.:
| Grading Company | Action | New Grade | Date |
|---|---|---|---|
| Morgan Stanley | Maintain | Equal Weight | 2026-02-10 |
| JP Morgan | Maintain | Underweight | 2026-02-05 |
| Keefe, Bruyette & Woods | Maintain | Market Perform | 2026-02-05 |
| TD Cowen | Maintain | Hold | 2026-02-05 |
| Evercore ISI Group | Maintain | In Line | 2026-02-05 |
| Morgan Stanley | Maintain | Equal Weight | 2026-02-03 |
| JP Morgan | Maintain | Underweight | 2026-01-20 |
| Barclays | Maintain | Underweight | 2026-01-15 |
| TD Cowen | Maintain | Hold | 2026-01-14 |
| Keefe, Bruyette & Woods | Maintain | Market Perform | 2025-12-17 |
The consensus from top-tier analysts remains cautious, with most maintaining neutral or underweight ratings. The prevailing “Hold” consensus reflects tempered market expectations without significant upgrades or downgrades.
Consumer Opinions
Consumers express mixed feelings about T. Rowe Price Group, Inc., revealing both trust in its investment expertise and concerns over customer service.
| Positive Reviews | Negative Reviews |
|---|---|
| Strong, consistent portfolio performance. | Slow response times from customer support. |
| Transparent fees and clear communication. | Limited digital tools compared to peers. |
| Reliable long-term wealth management advice. | Occasional issues with account access. |
Overall, clients praise T. Rowe Price for its reliable investment strategies and fee transparency. However, recurring complaints about customer service delays and outdated digital platforms could hinder future satisfaction.
Risk Analysis
The table below summarizes key risk factors for T. Rowe Price Group, Inc., highlighting their likelihood and potential impact:
| Category | Description | Probability | Impact |
|---|---|---|---|
| Market Volatility | High beta (1.54) indicates sensitivity to market swings affecting asset flows | Medium | High |
| Interest Rates | Rising rates may pressure asset valuations and client investment returns | Medium | Medium |
| Liquidity | Extremely high current ratio (6.73) signals inefficient capital deployment | Low | Low |
| Regulatory | Asset management faces tightening ESG and fiduciary regulations globally | Low | Medium |
| Valuation | Price-to-book ratio at 2.11 is neutral but price-to-earnings is favorable | Low | Low |
| Operational | Moderate Piotroski score (4) suggests room for improvement in financial health | Medium | Medium |
The most critical risks stem from market volatility and interest rate shifts, given TROW’s exposure to global equity and fixed income markets. Its elevated beta amplifies sensitivity to economic cycles, while interest rate hikes in 2026 have already pressured fixed income returns industry-wide. The very high current ratio flags potential capital inefficiency, which warrants monitoring despite low immediate risk. Overall, TROW’s robust Altman Z-Score (5.9) reassures financial stability, but investors should remain vigilant to cyclical headwinds and evolving regulatory demands.
Should You Buy T. Rowe Price Group, Inc.?
T. Rowe Price Group, Inc. appears to be creating value with a durable moat despite a declining ROIC trend. Its leverage profile is manageable, supporting an overall very favorable A rating. While operational efficiency remains strong, some valuation metrics could signal caution.
Strength & Efficiency Pillars
T. Rowe Price Group, Inc. exhibits strong profitability with a net margin of 28.53% and a return on equity of 19.22%. Its return on invested capital (ROIC) stands at 22.35%, exceeding the weighted average cost of capital (WACC) of 10.73%. This positions the company as a clear value creator. Operational efficiency is further supported by a robust gross margin of 62.67% and an EBIT margin of 33.44%, demonstrating solid control over costs and capital allocation despite a slight decline in ROIC trend.
Weaknesses and Drawbacks
The company is not in financial distress, reflected by a healthy Altman Z-Score of 5.90 in the safe zone, so solvency concerns are minimal. However, valuation presents mixed signals: a favorable price-to-earnings ratio of 10.98 contrasts with a neutral price-to-book ratio of 2.11, which may indicate moderate market expectations. The current ratio is high at 6.73, flagged as unfavorable, suggesting potential inefficiency in working capital management. Recent market activity shows seller dominance at 33.84%, creating short-term headwinds.
Our Final Verdict about T. Rowe Price Group, Inc.
T. Rowe Price Group, Inc. maintains a fundamentally solid profile with strong profitability and value creation. Despite recent bearish price trends and seller dominance, the overall financial health and operational efficiency suggest the stock could appear attractive for long-term exposure. Investors may consider a cautious approach due to market pressure but should not overlook the company’s durable competitive advantages.
Disclaimer: This content is for informational purposes only and does not constitute financial, investment, or other professional advice. Investing in financial markets involves a significant risk of loss, and past performance is not indicative of future results.
Additional Resources
- T. Rowe Price Group Stock Outlook: Is Wall Street Bullish or Bearish? – Yahoo Finance (Feb 13, 2026)
- Illinois Municipal Retirement Fund Acquires 24,567 Shares of T. Rowe Price Group, Inc. $TROW – MarketBeat (Feb 13, 2026)
- PRICE T ROWE GROUP INC SEC 10-K Report – TradingView (Feb 13, 2026)
- /C O R R E C T I O N — T. Rowe Price Group/ – PR Newswire (Feb 11, 2026)
- T. Rowe Price Rewards Shareholders With a 2.4% Dividend Increase – Zacks Investment Research (Feb 10, 2026)
For more information about T. Rowe Price Group, Inc., please visit the official website: troweprice.com