Home > Analyses > Communication Services > T-Mobile US, Inc.
T-Mobile US revolutionizes how millions connect, powering daily communication with cutting-edge wireless technology. As a telecommunications titan, it leads the U.S. market with a robust network, iconic brands, and relentless innovation. Its expansive coverage and customer-centric approach set industry standards. Yet, as competition intensifies and technology evolves, I question whether T-Mobile’s current fundamentals justify its lofty valuation and future growth prospects. This analysis dives deep.

Table of contents
Business Model & Company Overview
T-Mobile US, Inc., founded in 1994 and headquartered in Bellevue, Washington, dominates the US telecommunications sector. It operates a vast ecosystem delivering mobile voice, messaging, and data services to 109M customers. The company integrates wireless devices, wearables, and accessories under the T-Mobile and Metro brands, creating a seamless communications experience across postpaid, prepaid, and wholesale markets.
Its revenue engine balances device sales with recurring service fees, supported by 102K macro and 41K small cell sites. T-Mobile’s footprint spans the Americas, including Puerto Rico and the US Virgin Islands, with extensive retail and digital channels. The company’s competitive advantage lies in its robust network infrastructure and brand loyalty, shaping the future of mobile connectivity in the US.
Financial Performance & Fundamental Metrics
I analyze T-Mobile US, Inc.’s income statement, key financial ratios, and dividend payout policy to assess its profitability, efficiency, and shareholder return strategy.
Income Statement
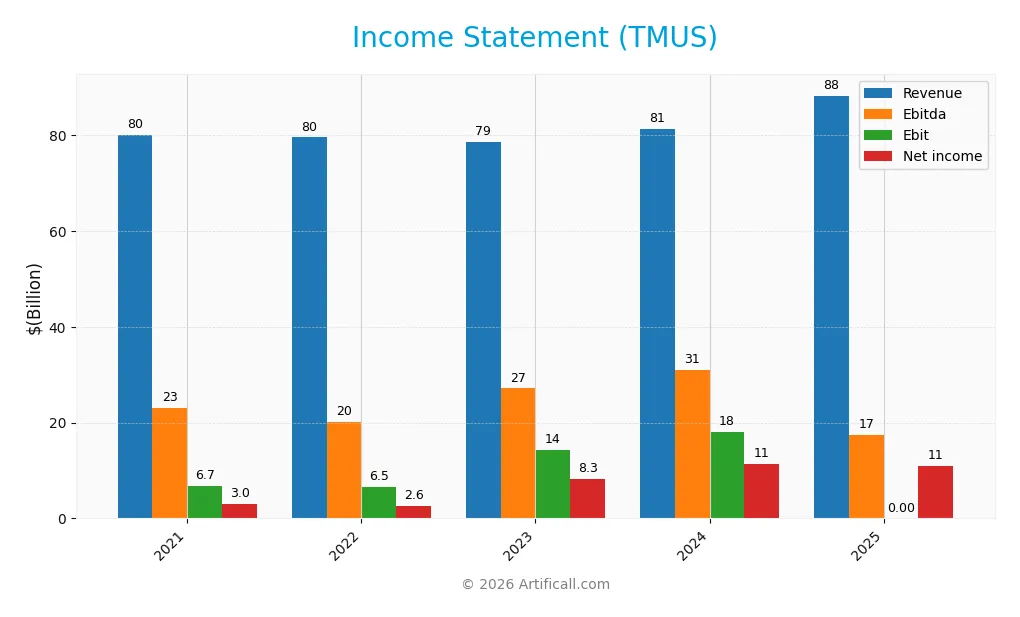
This table presents T-Mobile US, Inc.’s key income statement figures from 2021 through 2025, reflecting revenue, expenses, profitability, and earnings per share.
| 2021 | 2022 | 2023 | 2024 | 2025 | |
|---|---|---|---|---|---|
| Revenue | 80.1B | 79.6B | 78.6B | 81.4B | 88.3B |
| Cost of Revenue | 36.6B | 36.2B | 30.2B | 29.7B | 0 |
| Operating Expenses | 36.6B | 36.8B | 34.1B | 33.7B | 70.0B |
| Gross Profit | 43.5B | 43.4B | 48.4B | 51.7B | 0 |
| EBITDA | 23.1B | 20.2B | 27.2B | 31.0B | 17.4B |
| EBIT | 6.7B | 6.5B | 14.3B | 18.1B | 0 |
| Interest Expense | 3.3B | 3.4B | 3.3B | 3.4B | 3.8B |
| Net Income | 3.0B | 2.6B | 8.3B | 11.3B | 11.0B |
| EPS | 2.42 | 2.07 | 7.02 | 9.7 | 9.75 |
| Filing Date | 2022-02-11 | 2023-02-14 | 2024-02-02 | 2025-01-31 | 2026-02-11 |
Income Statement Evolution
From 2021 to 2025, T-Mobile US’s revenue grew steadily, reaching $88.3B in 2025, an 8.5% increase year-over-year. Net income surged over 260% across the period, hitting $11B in 2025. However, gross and EBIT margins deteriorated sharply in 2025, while net margin remained solid at 12.5%, showing mixed margin trends.
Is the Income Statement Favorable?
The 2025 income statement displays solid fundamentals with favorable revenue and net income growth. Interest expense improved as a percentage of revenue, reducing financial burden. Yet, unfavorable gross profit and EBIT margins signal operational challenges. Overall, the income statement is generally favorable, balancing strong bottom-line growth against margin pressures.
Financial Ratios
The table below presents key financial ratios for T-Mobile US, Inc. over the last five fiscal years, highlighting profitability, valuation, liquidity, leverage, and efficiency metrics:
| Ratios | 2021 | 2022 | 2023 | 2024 | 2025 |
|---|---|---|---|---|---|
| Net Margin | 3.8% | 3.3% | 10.6% | 13.9% | 12.4% |
| ROE | 4.4% | 3.7% | 12.9% | 18.4% | 18.6% |
| ROIC | 3.2% | 2.7% | 5.5% | 7.1% | 8.9% |
| P/E | 47.8 | 67.6 | 22.8 | 22.8 | 20.8 |
| P/B | 2.1 | 2.5 | 2.9 | 4.2 | 3.9 |
| Current Ratio | 0.89 | 0.77 | 0.91 | 0.91 | 1.0 |
| Quick Ratio | 0.78 | 0.69 | 0.83 | 0.83 | 0.90 |
| D/E | 1.57 | 1.60 | 1.76 | 1.85 | 1.98 |
| Debt-to-Assets | 52.7% | 52.9% | 54.8% | 54.9% | 53.5% |
| Interest Coverage | 2.1 | 1.9 | 4.3 | 5.3 | -4.8 |
| Asset Turnover | 0.39 | 0.38 | 0.38 | 0.39 | 0.40 |
| Fixed Asset Turnover | 1.14 | 1.07 | 1.11 | 1.21 | 1.32 |
| Dividend Yield | 0.0% | 0.0% | 0.4% | 1.3% | 1.8% |
Evolution of Financial Ratios
From 2021 to 2025, T-Mobile US, Inc.’s Return on Equity (ROE) steadily improved from 4.38% to 18.57%, reflecting enhanced profitability. The Current Ratio remained below 1.0, signaling consistent liquidity constraints. Meanwhile, the Debt-to-Equity Ratio increased from 1.57 to 1.98, indicating growing leverage and higher financial risk.
Are the Financial Ratios Fovorable?
In 2025, profitability ratios like net margin (12.45%) and ROE (18.57%) are favorable, supported by a WACC of 4.88%. However, liquidity ratios such as the Current Ratio (1.0) and leverage metrics including Debt-to-Equity (1.98) and debt to assets (53.48%) are unfavorable. Market valuation ratios, particularly Price-to-Book (3.87), also appear stretched. Overall, the ratios lean slightly unfavorable.
Shareholder Return Policy
T-Mobile US, Inc. maintains an active dividend policy with a 37% payout ratio and a 1.8% yield in 2025. Dividend per share rose to 3.65, supported by free cash flow coverage of 64%. The company also engages in share buybacks, balancing distributions with reinvestment.
This approach suggests a commitment to returning capital while sustaining growth. The payout remains prudent given T-Mobile’s leverage and cash flow metrics. The combination of dividends and buybacks appears aligned with preserving long-term shareholder value under current financial conditions.
Score analysis
Here is a radar chart illustrating T-Mobile US, Inc.’s valuation and financial performance scores:
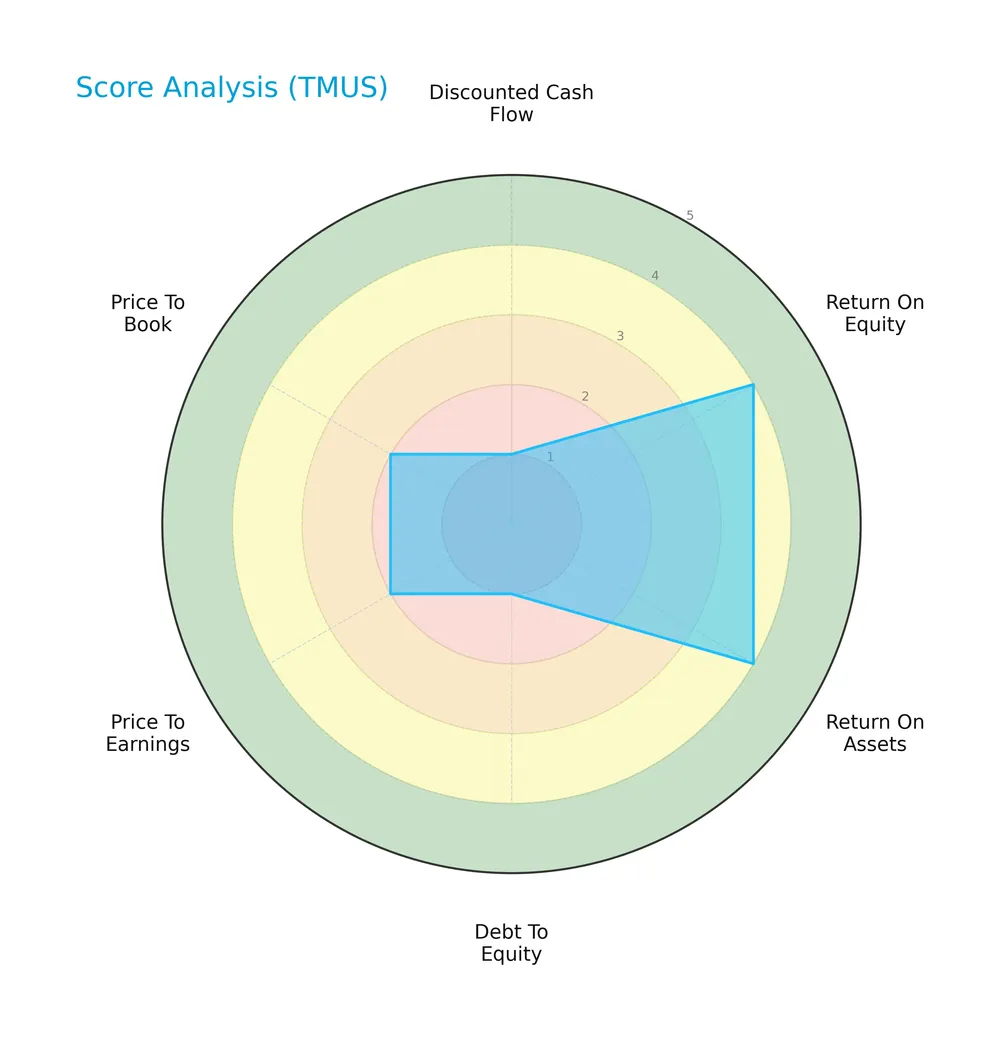
The company shows strong profitability with high return on equity and assets scores of 4 each. However, its discounted cash flow and debt-to-equity scores are very unfavorable at 1, indicating capital structure and valuation concerns. Price multiples also rate unfavorably.
Analysis of the company’s bankruptcy risk
The Altman Z-Score places T-Mobile in the distress zone, signaling a high risk of financial distress and potential bankruptcy:

Is the company in good financial health?
The following Piotroski diagram helps evaluate T-Mobile’s financial strength and operational efficiency:

With a Piotroski score of 7, T-Mobile demonstrates strong financial health. This suggests solid fundamentals despite other risk factors, indicating effective management and operational resilience.
Competitive Landscape & Sector Positioning
This analysis explores T-Mobile US, Inc.’s position within the telecommunications services sector. It covers strategic positioning, revenue by segment, key products, main competitors, competitive advantages, and SWOT factors. I will assess whether T-Mobile holds a competitive advantage over its peers.
Strategic Positioning
T-Mobile US, Inc. concentrates on mobile communications in the US and territories, serving 109M customers mainly through postpaid, prepaid, and wholesale segments. Its revenue mix heavily favors branded postpaid (52.3B in 2024), supported by significant equipment sales (14.3B), reflecting a focused telecom portfolio with geographic concentration in the US market.
Revenue by Segment
This pie chart illustrates T-Mobile US, Inc.’s revenue breakdown by segment for the fiscal year 2024, highlighting the key drivers of its business model.
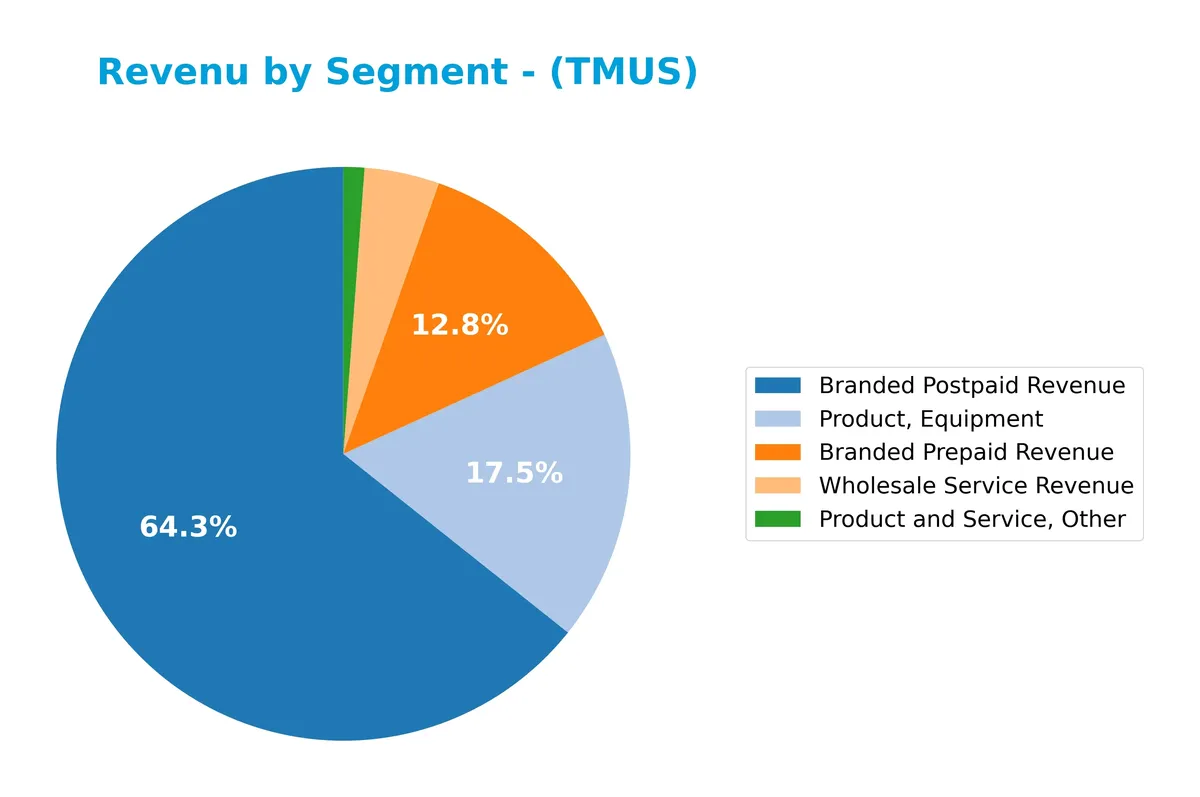
Branded Postpaid revenue dominates at $52.3B, reflecting steady growth and strong customer retention. Product, Equipment contributes $14.3B but shows a decline from prior years, signaling potential saturation or margin pressure. Branded Prepaid revenue at $10.4B remains stable, while Wholesale Service revenue has contracted to $3.4B, indicating less reliance on third-party networks. The overall trend points to increasing concentration in postpaid services, emphasizing TMUS’s shift toward higher-margin, contract-based revenue.
Key Products & Brands
The table below outlines T-Mobile US, Inc.’s core products and brands with concise descriptions:
| Product | Description |
|---|---|
| Branded Postpaid Services | Voice, messaging, and data services sold to customers on contract plans, generating $52.3B (2024). |
| Branded Prepaid Services | Voice, messaging, and data services sold without contracts, totaling $10.4B (2024). |
| Product, Equipment | Wireless devices including smartphones, wearables, tablets, and accessories with $14.3B revenue (2024). |
| Wholesale Service Revenue | Service sold to third-party distributors and resellers, contributing $3.4B (2024). |
| Product and Service, Other | Miscellaneous products and services amounting to $959M (2024). |
T-Mobile’s portfolio spans postpaid and prepaid wireless services, complemented by strong equipment sales. Wholesale and other products add diversification, reflecting a broad footprint in U.S. mobile communications.
Main Competitors
There are 5 competitors in the Telecommunications Services industry; below are the top 5 leaders by market capitalization:
| Competitor | Market Cap. |
|---|---|
| T-Mobile US, Inc. | 223B |
| AT&T Inc. | 174B |
| Verizon Communications Inc. | 171B |
| Comcast Corporation | 108B |
| Charter Communications, Inc. | 29B |
T-Mobile US, Inc. ranks 1st among its peers, with a market cap 5% above the top player benchmark. It stands well above both the average market cap of the top 10 competitors and the median sector figure. The company maintains a significant 35% lead over its closest competitor below, underscoring its dominant market position.
Comparisons with competitors
Check out how we compare the company to its competitors:
Does TMUS have a competitive advantage?
T-Mobile US, Inc. demonstrates a sustainable competitive advantage with a very favorable moat status. Its ROIC exceeds WACC by over 4%, signaling efficient capital use and value creation.
Looking ahead, TMUS’s large subscriber base and extensive network infrastructure position it well for growth. Opportunities include expanding 5G services and increasing device sales in the US and territories.
SWOT Analysis
This analysis highlights T-Mobile US, Inc.’s critical internal and external factors shaping its competitive position and future prospects.
Strengths
- Strong market share with 108.7M customers
- Growing ROIC signaling sustainable value creation
- Favorable net margin and revenue growth
Weaknesses
- High debt-to-equity ratio at 1.98
- Weak liquidity with current ratio at 1.0
- Unfavorable asset turnover and interest coverage
Opportunities
- Expansion in 5G and small cell infrastructure
- Increasing demand for wireless devices
- Potential to improve operational efficiency
Threats
- Intense competition in US telecom market
- Regulatory pressures and spectrum costs
- Economic downturn impacting consumer spending
T-Mobile’s strengths in scale and profitability underpin its competitive moat, but financial leverage and efficiency gaps pose risks. The company must leverage growth opportunities while managing debt prudently to sustain its leadership.
Stock Price Action Analysis
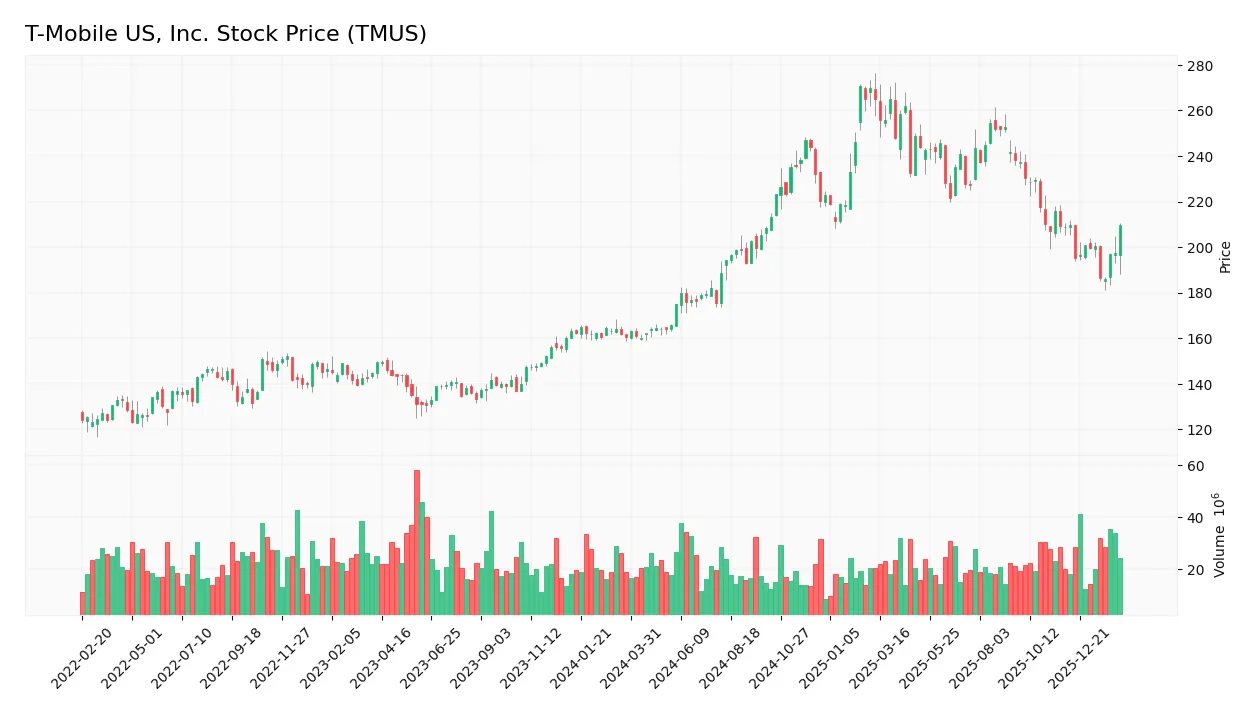
The weekly stock chart illustrates TMUS’s price movement and key levels over the past 12 months:
Trend Analysis
Over the past 12 months, TMUS’s stock price rose 30.47%, indicating a strong bullish trend. The trend shows deceleration despite a high volatility level with a 30.2 standard deviation. The price ranged between 160.05 and 270.82, reflecting significant upward momentum easing near recent highs.
Volume Analysis
Trading volume is increasing, with buyers accounting for 51.72% overall and 60.08% in the recent period. This buyer dominance suggests growing investor confidence and stronger market participation favoring TMUS shares.
Target Prices
Analysts present a solid target consensus for T-Mobile US, Inc., reflecting balanced optimism.
| Target Low | Target High | Consensus |
|---|---|---|
| 225 | 310 | 260.75 |
The target range indicates expectations of moderate upside potential from current levels, suggesting steady growth confidence among analysts.

Don’t Let Luck Decide Your Entry Point
Optimize your entry points with our advanced ProRealTime indicators. You’ll get efficient buy signals with precise price targets for maximum performance. Start outperforming now!
Analyst & Consumer Opinions
This section examines analyst ratings and consumer feedback related to T-Mobile US, Inc., providing a comprehensive overview.
Stock Grades
Here is the latest verified grading summary from leading financial institutions for T-Mobile US, Inc.:
| Grading Company | Action | New Grade | Date |
|---|---|---|---|
| Wells Fargo | Maintain | Overweight | 2026-01-26 |
| Bernstein | Maintain | Market Perform | 2026-01-16 |
| Citigroup | Maintain | Neutral | 2025-12-19 |
| Goldman Sachs | Maintain | Buy | 2025-12-12 |
| Morgan Stanley | Maintain | Overweight | 2025-12-10 |
| Argus Research | Maintain | Buy | 2025-12-09 |
| Keybanc | Upgrade | Sector Weight | 2025-12-02 |
| Oppenheimer | Downgrade | Perform | 2025-11-21 |
| Tigress Financial | Maintain | Buy | 2025-11-11 |
| Morgan Stanley | Maintain | Overweight | 2025-10-27 |
The consensus among top-tier analysts leans toward a Buy rating, with most firms maintaining positive stances. Keybanc’s recent upgrade contrasts with Oppenheimer’s downgrade, indicating some divergence in sector outlooks.
Consumer Opinions
T-Mobile US, Inc. consistently earns praise for its customer-centric approach, yet some users highlight areas needing improvement.
| Positive Reviews | Negative Reviews |
|---|---|
| Reliable network coverage in urban areas | Occasional service disruptions reported |
| Competitive pricing with flexible plans | Customer service wait times can be long |
| Easy-to-use mobile app and account management | Limited international roaming options |
| Frequent promotions and discounts | Slow response to technical issues |
Overall, consumers appreciate T-Mobile’s value and network quality. However, service reliability and customer support remain points of frustration. These issues may affect loyalty if not addressed promptly.
Risk Analysis
Below is a summary of key risks facing T-Mobile US, Inc., with their likelihood and potential impact:
| Category | Description | Probability | Impact |
|---|---|---|---|
| Financial Health | Altman Z-Score at 1.8 signals distress zone risk of bankruptcy | Medium | High |
| Leverage | High debt-to-equity ratio (1.98) increases financial risk | High | High |
| Liquidity | Current ratio at 1.0 suggests tight short-term liquidity | Medium | Medium |
| Profitability | Moderate ROIC (8.92%) barely exceeds WACC (4.88%) | Medium | Medium |
| Valuation | Unfavorable PB ratio (3.87) indicates potential overvaluation | Medium | Medium |
| Market Volatility | Low beta (0.44) reduces market risk exposure | Low | Low |
T-Mobile’s greatest risks lie in its high leverage and borderline Altman Z-Score, signaling financial distress potential. Despite strong profitability metrics, heavy debt and tight liquidity could constrain flexibility. Investors must weigh these risks against the company’s growth prospects carefully.
Should You Buy T-Mobile US, Inc.?
T-Mobile US, Inc. appears to be delivering improving profitability with a durable competitive moat supported by growing ROIC. Despite a substantial leverage profile and liquidity concerns, the company could be seen as maintaining a very favorable rating of B-, suggesting cautious optimism.
Strength & Efficiency Pillars
T-Mobile US, Inc. posts a solid net margin of 12.45% and a return on equity of 18.57%, indicating operational strength. Its return on invested capital (ROIC) stands at 8.92%, comfortably above the weighted average cost of capital (WACC) at 4.88%, confirming the company as a value creator. The growing ROIC trend reinforces T-Mobile’s sustainable competitive advantage and increasing profitability, despite some neutral signals in asset turnover and interest coverage. These metrics reflect robust operational efficiency amid challenging sector dynamics.
Weaknesses and Drawbacks
The company is in financial distress, with an Altman Z-Score of 1.80, signaling a high risk of bankruptcy. This solvency concern overshadows its profitability metrics. Leverage is a critical red flag: debt-to-equity ratio at 1.98 and debt-to-assets at 53.48% pose liquidity risks. The current ratio is weak at 1.0, suggesting tight short-term financial flexibility. Valuation also pressures the stock, with a price-to-book ratio at 3.87, indicating an elevated premium. These factors warrant extreme caution despite operational strengths.
Our Final Verdict about T-Mobile US, Inc.
Despite favorable margins and value creation, T-Mobile’s distressed financial health makes the investment profile highly speculative. The low Altman Z-Score warns of potential bankruptcy risk, which outweighs recent positive market signals and operational efficiency. Investors seeking conservative capital preservation should consider this profile too risky. Only those with a high-risk tolerance might explore opportunities, anticipating a possible turnaround or restructuring.
Disclaimer: This content is for informational purposes only and does not constitute financial, investment, or other professional advice. Investing in financial markets involves a significant risk of loss, and past performance is not indicative of future results.
Additional Resources
- T-Mobile Delivers Best-in-Class Customer Results in Q4, Translating into Durable and Profitable Financial Growth Driven By Widening Differentiation – Business Wire (Feb 11, 2026)
- Caprock Group LLC Takes Position in T-Mobile US, Inc. $TMUS – MarketBeat (Feb 11, 2026)
- T-Mobile US, Inc. (TMUS) Price Forecast: Monthly Breakout Signals Reversal – FXEmpire (Feb 11, 2026)
- T-Mobile stock turns positive after additional forecast helps offset mixed Q4 report (TMUS:NASDAQ) – Seeking Alpha (Feb 11, 2026)
- T-Mobile: Q4 Earnings Snapshot – kens5.com (Feb 11, 2026)
For more information about T-Mobile US, Inc., please visit the official website: t-mobile.com