Home > Analyses > Consumer Defensive > Sysco Corporation
Sysco Corporation quietly fuels the foodservice industry, ensuring kitchens worldwide—from bustling restaurants to healthcare facilities—are stocked with quality products every day. As a dominant force in food distribution, Sysco’s extensive portfolio spans fresh produce, frozen foods, and essential kitchen supplies, supported by a vast network of distribution centers. Renowned for operational excellence and innovation, the company shapes how food reaches millions. But as market dynamics evolve, does Sysco’s strong foundation still justify its current valuation and growth outlook?
Table of contents
Business Model & Company Overview
Sysco Corporation, founded in 1969 and headquartered in Houston, Texas, stands as a dominant player in the food distribution industry. It operates a comprehensive ecosystem delivering a wide range of food and related products to the foodservice sector across the United States, Canada, the UK, France, and other international markets. Sysco’s portfolio includes frozen, fresh, and canned foods alongside essential non-food items, creating a seamless supply chain that supports restaurants, healthcare facilities, educational institutions, and hospitality venues.
The company’s revenue engine balances extensive distribution capabilities through 343 facilities with a diverse product mix covering food and non-food essentials. Sysco leverages its strategic presence in key global markets—Americas, Europe, and Asia—to generate steady recurring demand. Its economic moat is reinforced by scale, logistics expertise, and broad customer relationships, positioning it to shape the future of foodservice distribution worldwide.
Financial Performance & Fundamental Metrics
This section analyzes Sysco Corporation’s income statement, key financial ratios, and dividend payout policy to evaluate its overall financial health and shareholder returns.
Income Statement
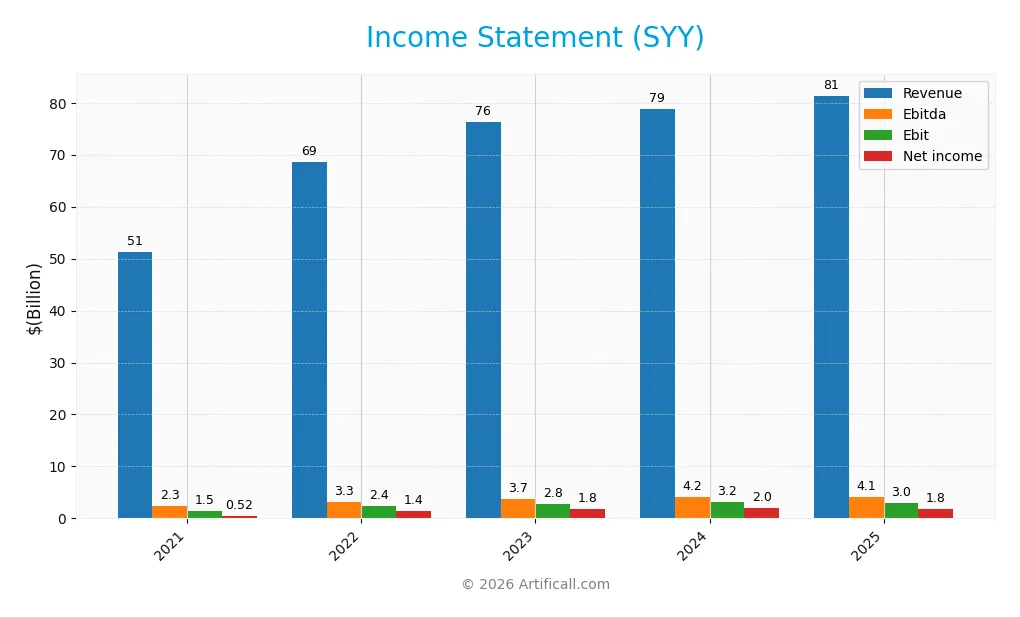
The table below presents Sysco Corporation’s key income statement figures for the fiscal years 2021 through 2025, illustrating trends in revenue, profitability, and earnings per share.
| 2021 | 2022 | 2023 | 2024 | 2025 | |
|---|---|---|---|---|---|
| Revenue | 51.3B | 68.6B | 76.3B | 78.8B | 81.4B |
| Cost of Revenue | 41.9B | 56.3B | 62.4B | 64.2B | 66.4B |
| Operating Expenses | 7.9B | 10.0B | 10.9B | 11.4B | 11.9B |
| Gross Profit | 9.4B | 12.3B | 14.0B | 14.6B | 15.0B |
| EBITDA | 2.3B | 3.3B | 3.7B | 4.2B | 4.1B |
| EBIT | 1.5B | 2.4B | 2.8B | 3.2B | 3.1B |
| Interest Expense | 880M | 624M | 527M | 607M | 635M |
| Net Income | 524M | 1.4B | 1.8B | 2.0B | 1.8B |
| EPS | 1.03 | 2.66 | 3.49 | 3.90 | 3.74 |
| Filing Date | 2021-08-30 | 2022-08-26 | 2023-08-25 | 2024-08-28 | 2025-08-22 |
Income Statement Evolution
Over the 2021-2025 period, Sysco Corporation’s revenue increased by 58.6%, with net income surging 248.7%, reflecting strong overall growth. However, in the most recent year, revenue growth slowed to 3.2%, while net margin and EBIT margin experienced declines. Margins remain broadly stable, with gross margin at 18.4% and net margin at 2.25%, both rated neutral.
Is the Income Statement Favorable?
In fiscal 2025, Sysco reported $81.4B revenue and $1.83B net income, translating to a 2.25% net margin, which is neutral. EBIT margin stood at 3.75%, also neutral, while interest expense was relatively favorable at 0.78% of revenue. Despite neutral margins, net income and EPS both declined around 4% year-over-year, suggesting some short-term pressures amid a generally favorable long-term fundamental trend.
Financial Ratios
The following table summarizes Sysco Corporation’s key financial ratios for the fiscal years 2021 through 2025, providing a snapshot of profitability, valuation, liquidity, leverage, and efficiency:
| Ratios | 2021 | 2022 | 2023 | 2024 | 2025 |
|---|---|---|---|---|---|
| Net Margin | 1.0% | 2.0% | 2.3% | 2.5% | 2.2% |
| ROE | 34% | 98% | 88% | 105% | 100% |
| ROIC | 9% | 13% | 16% | 15% | 13% |
| P/E | 76 | 32 | 21 | 18 | 20 |
| P/B | 26 | 31 | 19 | 19 | 20 |
| Current Ratio | 1.47 | 1.20 | 1.24 | 1.20 | 1.21 |
| Quick Ratio | 0.96 | 0.69 | 0.72 | 0.69 | 0.70 |
| D/E | 7.6 | 8.2 | 5.6 | 7.0 | 7.9 |
| Debt-to-Assets | 55% | 52% | 49% | 52% | 54% |
| Interest Coverage | 1.6 | 3.8 | 5.8 | 5.3 | 4.9 |
| Asset Turnover | 2.40 | 3.11 | 3.34 | 3.16 | 3.04 |
| Fixed Asset Turnover | 10.2 | 13.3 | 13.5 | 12.3 | 11.3 |
| Dividend Yield | 2.3% | 2.2% | 2.6% | 2.9% | 2.7% |
Evolution of Financial Ratios
Over the period from 2021 to 2025, Sysco Corporation’s Return on Equity (ROE) fluctuated significantly, peaking near 105% in 2024 before slightly dipping to approximately 99.9% in 2025, indicating strong but somewhat volatile profitability. The Current Ratio remained relatively stable around 1.2, suggesting consistent liquidity. However, the Debt-to-Equity Ratio showed an increasing trend, reaching 7.92 in 2025, signaling growing leverage and potential risk.
Are the Financial Ratios Favorable?
In 2025, Sysco displayed favorable ROE (99.9%), Return on Invested Capital (13.03%), and efficient asset turnover ratios, reflecting solid profitability and operational efficiency. Liquidity ratios, including a Current Ratio of 1.21, are neutral, though the Quick Ratio at 0.7 is unfavorable, indicating less liquid assets to cover short-term obligations. Leverage is a concern with a Debt-to-Equity Ratio of 7.92 and debt-to-assets at 54.13%, both unfavorable. Market metrics show neutrality for P/E (20.03) but unfavorable Price-to-Book (20.01). Overall, the financial ratios are slightly favorable.
Shareholder Return Policy
Sysco Corporation maintains a consistent dividend payment with a payout ratio around 55%, a dividend yield near 2.7%, and a rising dividend per share over recent years, supported by free cash flow coverage exceeding 65%. The company also engages in share buybacks, balancing distributions with capital expenditures.
This policy appears cautiously managed, aiming to sustain shareholder returns without excessive payouts or repurchases. Given the coverage ratios and steady dividend growth, the approach supports a sustainable long-term value creation framework for shareholders.
Score analysis
Below is the radar chart illustrating Sysco Corporation’s key financial scores based on various valuation and performance metrics:
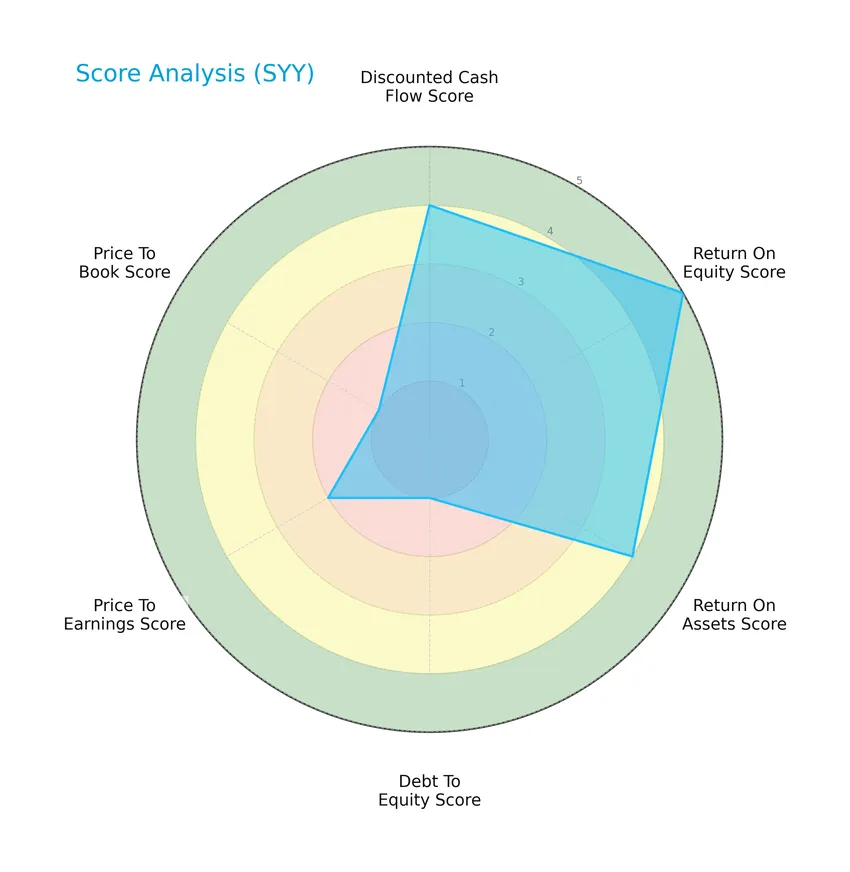
Sysco Corporation shows a mix of scores: strong return on equity (5) and favorable discounted cash flow (4) and return on assets (4), contrasted by very unfavorable debt-to-equity (1) and price-to-book (1) scores, with moderate price-to-earnings (2).
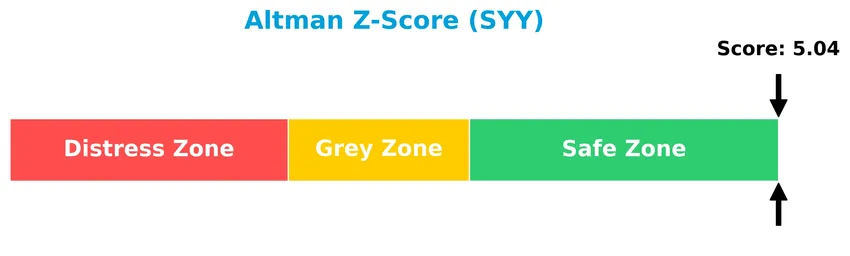
Analysis of the company’s bankruptcy risk
The Altman Z-Score places Sysco Corporation well within the safe zone, indicating a low risk of bankruptcy and financial distress:
Is the company in good financial health?
The Piotroski diagram below summarizes Sysco Corporation’s financial strength based on its score of 7, indicating strong overall health:

With a Piotroski Score of 7, Sysco demonstrates strong financial health, reflecting solid profitability, leverage, liquidity, and efficiency metrics that contribute positively to its investment profile.
Competitive Landscape & Sector Positioning
This sector analysis will explore Sysco Corporation’s strategic positioning, revenue by segment, key products, main competitors, and competitive advantages. I will also present a SWOT analysis to assess the company’s strengths and weaknesses. The goal is to determine whether Sysco holds a competitive advantage over its peers in the food distribution industry.
Strategic Positioning
Sysco Corporation has diversified its product portfolio across multiple food categories, including meats, dairy, produce, and non-food items, with revenues exceeding $15B in fresh meats and $14.6B in canned products in 2025. Geographically, it maintains a concentrated presence with $57B in U.S. foodservice, complemented by $15B international operations and an $8.4B Sygma segment.
Revenue by Segment
This pie chart illustrates Sysco Corporation’s revenue distribution by product segments for the fiscal year 2025.
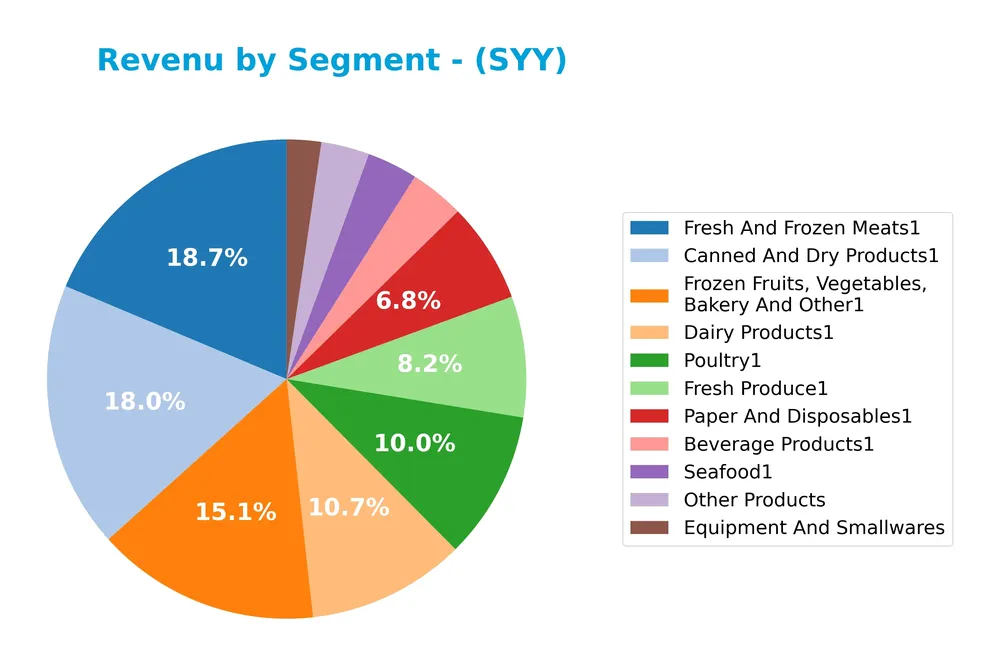
In 2025, Fresh And Frozen Meats remained the largest revenue driver at 15.2B, followed closely by Canned And Dry Products at 14.6B and Frozen Fruits, Vegetables, Bakery And Other at 12.3B. Dairy Products and Fresh Produce also contributed significantly with 8.7B and 6.6B respectively. The Equipment And Smallwares segment showed modest growth, now reaching 1.9B. Overall, the revenue mix indicates a stable concentration in core food categories, with steady growth in key segments and no major shifts signaling concentration risk.
Key Products & Brands
The table below presents Sysco Corporation’s main products along with their descriptions:
| Product | Description |
|---|---|
| Beverage Products | Distribution of various beverage items to the foodservice industry. |
| Canned And Dry Products | Includes canned and dry food products supplied mainly to foodservice customers. |
| Dairy Products | Range of dairy items distributed to restaurants, hospitals, and other venues. |
| Equipment And Smallwares | Supplies cookware, pots, pans, utensils, and small kitchen equipment. |
| Fresh And Frozen Meats | Includes fresh and frozen meat products such as beef, pork, and other meats. |
| Fresh Produce | Fresh fruits and vegetables distributed to diverse foodservice sectors. |
| Frozen Fruits, Vegetables, Bakery And Other | Frozen food items including bakery products and various frozen fruits and vegetables. |
| Other Products | Miscellaneous food and related products not categorized under main segments. |
| Paper And Disposables | Paper products like disposable napkins, plates, and cups for foodservice use. |
| Poultry | Fresh and frozen poultry products delivered to foodservice clients. |
| Seafood | Fresh and frozen seafood distributed across multiple foodservice channels. |
Sysco’s product range covers a comprehensive portfolio of food and non-food items catering primarily to the foodservice industry, including restaurants, healthcare, and hospitality sectors across various countries.
Main Competitors
Sysco Corporation faces competition from a total of 3 companies, with the table below listing the top 10 leaders by market capitalization:
| Competitor | Market Cap. |
|---|---|
| Sysco Corporation | 35.2B |
| US Foods Holding Corp. | 16.8B |
| Performance Food Group Company | 14.1B |
Sysco Corporation ranks 1st among its competitors, with a market cap 3.65% larger than the next largest player. It stands above both the average market cap of the top 10 competitors (22.0B) and the median market cap in the food distribution sector (16.8B). The company maintains a significant gap from its closest competitor below, highlighting its strong market leadership.
Comparisons with competitors
Check out how we compare the company to its competitors:
Does Sysco have a competitive advantage?
Sysco Corporation demonstrates a durable competitive advantage, reflected in a very favorable moat status with ROIC exceeding WACC by over 7%, and a strong upward ROIC trend of nearly 48% over 2021-2025. This indicates efficient capital use and consistent value creation in the food distribution sector.
Looking ahead, Sysco’s broad geographic footprint, including significant growth in International Foodservice Operations and its diversified product range, supports opportunities for expansion. Continued development of its U.S. Foodservice and Sygma segments positions the company well to capitalize on evolving market demands.
SWOT Analysis
This SWOT analysis highlights the key internal and external factors impacting Sysco Corporation to aid investors in understanding its strategic position.
Strengths
- Leading foodservice distributor with 76K employees
- Strong international presence in US, Canada, UK, France
- Durable competitive advantage with growing ROIC
- Favorable return on equity (99.89%) and asset turnover (3.04)
Weaknesses
- High debt-to-equity ratio (7.92) and debt-to-assets (54.13%)
- Declining EBIT and net margin growth in recent year
- Unfavorable quick ratio (0.7) and price-to-book valuation (20.01)
Opportunities
- Expanding international foodservice markets
- Growth in food-away-from-home industry post-pandemic
- Potential to improve operational efficiency and margins
Threats
- Rising operational expenses impacting profitability
- Intense competition in food distribution
- Economic downturns affecting client demand in hospitality sector
Sysco exhibits strong market leadership and financial returns, but elevated leverage and recent margin pressures require caution. Strategic focus on international expansion and cost control is essential to mitigate risks and capitalize on growth opportunities.
Stock Price Action Analysis
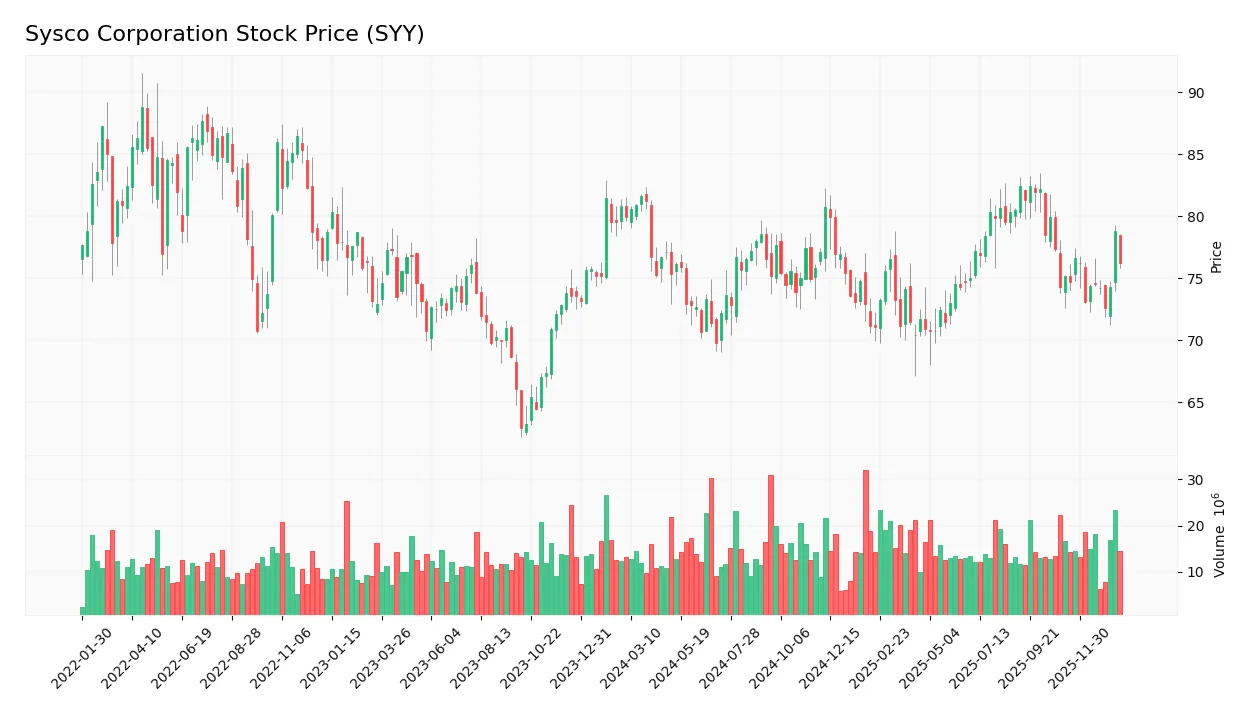
The following weekly stock chart illustrates Sysco Corporation’s price movements and volatility over the past 12 months:
Trend Analysis
Over the past 12 months, Sysco’s stock price declined by 4.69%, indicating a bearish trend with acceleration in the downward movement. The price fluctuated between a high of 82.45 and a low of 69.75, with a volatility measured by a standard deviation of 3.2.
Volume Analysis
In the last three months, trading volume has been increasing with a slight buyer dominance at 58.27%. Buyers accounted for 104M shares versus sellers’ 75M, suggesting growing investor interest and positive market participation despite the overall bearish trend.
Target Prices
The consensus target prices for Sysco Corporation indicate moderate upside potential from current levels.
| Target High | Target Low | Consensus |
|---|---|---|
| 90 | 80 | 85.86 |
Analysts expect Sysco’s share price to trade between $80 and $90, with an average consensus near $86, suggesting cautious optimism among market experts.

Don’t Let Luck Decide Your Entry Point
Optimize your entry points with our advanced ProRealTime indicators. You’ll get efficient buy signals with precise price targets for maximum performance. Start outperforming now!
Analyst & Consumer Opinions
This section examines the latest analyst ratings and consumer feedback regarding Sysco Corporation (SYY) performance and market perception.
Stock Grades
The following table presents recent verified stock grades for Sysco Corporation from recognized financial institutions:
| Grading Company | Action | New Grade | Date |
|---|---|---|---|
| Morgan Stanley | Maintain | Equal Weight | 2026-01-20 |
| Citigroup | Maintain | Neutral | 2026-01-07 |
| Barclays | Maintain | Overweight | 2026-01-07 |
| Piper Sandler | Maintain | Neutral | 2025-12-12 |
| Citigroup | Maintain | Neutral | 2025-11-03 |
| Barclays | Maintain | Overweight | 2025-10-29 |
| Citigroup | Maintain | Neutral | 2025-10-15 |
| Guggenheim | Maintain | Buy | 2025-10-06 |
| Guggenheim | Maintain | Buy | 2025-08-06 |
| Guggenheim | Maintain | Buy | 2025-07-31 |
Overall, the grades show a stable outlook with most analysts maintaining their previous ratings. The consensus leans towards a positive view, balancing multiple “Buy” and “Overweight” ratings alongside several “Neutral” assessments.
Consumer Opinions
Sysco Corporation enjoys a varied range of consumer sentiments, reflecting its broad impact in the foodservice industry.
| Positive Reviews | Negative Reviews |
|---|---|
| Reliable delivery schedules that support business operations. | Occasional issues with order accuracy. |
| High-quality food products that meet safety standards. | Pricing can be higher compared to competitors. |
| Excellent customer service with responsive support teams. | Limited product variety in certain regions. |
Overall, consumers appreciate Sysco’s reliability and quality but express concerns about pricing and occasional order errors. The company’s strong customer service helps mitigate some dissatisfaction.
Risk Analysis
Below is a summary table outlining the key risk categories associated with Sysco Corporation, including their probability and impact levels:
| Category | Description | Probability | Impact |
|---|---|---|---|
| Financial Leverage | High debt-to-equity ratio (7.92) and debt-to-assets (54.13%) increase risk. | High | High |
| Profitability | Low net margin of 2.25% despite strong ROE and ROIC indicates margin pressure. | Moderate | Moderate |
| Market Valuation | Unfavorable price-to-book ratio (20.01) may signal overvaluation risk. | Moderate | Moderate |
| Liquidity | Quick ratio at 0.7 suggests potential short-term liquidity challenges. | Moderate | Moderate |
| Industry Exposure | Food distribution is sensitive to supply chain disruptions and inflation. | High | High |
| Economic Cycles | Consumer spending fluctuations could affect demand in foodservice sector. | Moderate | Moderate |
The most significant risks for Sysco in 2026 are its high financial leverage and exposure to supply chain volatility in the food distribution industry. Despite a strong Altman Z-score (5.04, safe zone) and a solid Piotroski score (7, strong), the elevated debt levels and industry sensitivities require cautious monitoring. Investors should weigh these risks against Sysco’s favorable return metrics and dividend yield when considering portfolio inclusion.
Should You Buy Sysco Corporation?
Sysco Corporation appears to exhibit improving profitability and a durable competitive moat supported by growing ROIC, suggesting strong value creation. Despite a challenging leverage profile marked by substantial debt, its overall rating could be seen as very favorable, indicating a cautiously positive financial health outlook.
Strength & Efficiency Pillars
Sysco Corporation exhibits solid profitability and value creation, underpinned by a return on equity of 99.89% and a return on invested capital (ROIC) of 13.03%, which notably exceeds its weighted average cost of capital (WACC) of 5.84%. This differential confirms Sysco as a clear value creator. Financial health is robust, with an Altman Z-Score of 5.04 placing the company comfortably in the safe zone, and a strong Piotroski Score of 7 supports its sound financial position. Asset efficiency is also commendable, highlighted by a fixed asset turnover of 11.28 and an asset turnover ratio of 3.04.
Weaknesses and Drawbacks
However, Sysco faces notable challenges that may weigh on its valuation and leverage profile. The company’s price-to-book ratio stands at an elevated 20.01, signaling a potentially overvalued equity base, while its debt-to-equity ratio of 7.92 reflects a very high leverage level that could increase financial risk in adverse conditions. Liquidity metrics are mixed; although the current ratio is a moderate 1.21, the quick ratio is a weak 0.7, indicating limited short-term liquidity. The recent bearish stock trend with a price decline of 4.69% and seller dominance at 51.15% further accentuates short-term market pressures.
Our Verdict about Sysco Corporation
Sysco’s long-term fundamental profile appears favorable, supported by strong profitability, value creation, and financial stability metrics. Despite this, the recent bearish technical trend and seller dominance suggest caution. While the recent period shows a slight buyer dominance of 58.27%, the overall market sentiment may induce a wait-and-see approach to identify a more advantageous entry point. This nuanced stance aligns with the mix of robust fundamentals tempered by current valuation and leverage concerns.
Disclaimer: This content is for informational purposes only and does not constitute financial, investment, or other professional advice. Investing in financial markets involves a significant risk of loss, and past performance is not indicative of future results.
Additional Resources
- Teacher Retirement System of Texas Increases Position in Sysco Corporation $SYY – MarketBeat (Jan 24, 2026)
- Sysco Set to Report Q2 Earnings: Here’s What to Expect From SYY – Yahoo Finance (Jan 23, 2026)
- What’s Driving the Market Sentiment Around Sysco Corp? – Sahm (Jan 23, 2026)
- Citi retains a neutral rating on Sysco Corporation (SYY) – MSN (Jan 14, 2026)
- 3 Reasons SYY is Risky and 1 Stock to Buy Instead – Finviz (Jan 19, 2026)
For more information about Sysco Corporation, please visit the official website: sysco.com