Home > Analyses > Technology > Synopsys, Inc.
Synopsys, Inc. is a driving force behind the design and verification of the integrated circuits powering today’s electronics, from smartphones to automotive systems. As a leader in electronic design automation software, Synopsys is renowned for its Fusion Design Platform and Verification Continuum Platform, which push boundaries in innovation and quality. With a strong market presence and cutting-edge intellectual property offerings, the question remains: does Synopsys’s current valuation fully reflect its growth potential in an evolving tech landscape?
Table of contents
Business Model & Company Overview
Synopsys, Inc., founded in 1986 and headquartered in Mountain View, California, stands as a leader in the electronic design automation software industry. Its comprehensive ecosystem integrates digital design, verification, FPGA programming, and intellectual property solutions, creating a unified platform for designing and testing integrated circuits. This seamless suite supports diverse sectors including electronics, automotive, and medicine, solidifying its dominant market position.
The company’s revenue engine balances advanced software platforms like the Fusion Design and Verification Continuum with recurring services in security testing and professional training. Synopsys leverages its strategic footprint across the Americas, Europe, and Asia to serve a global client base. Its robust portfolio and innovation-driven approach constitute a formidable economic moat, shaping the future of chip design and verification worldwide.
Financial Performance & Fundamental Metrics
I will analyze Synopsys, Inc.’s income statement, key financial ratios, and dividend payout policy to provide a clear view of its fundamental health.
Income Statement
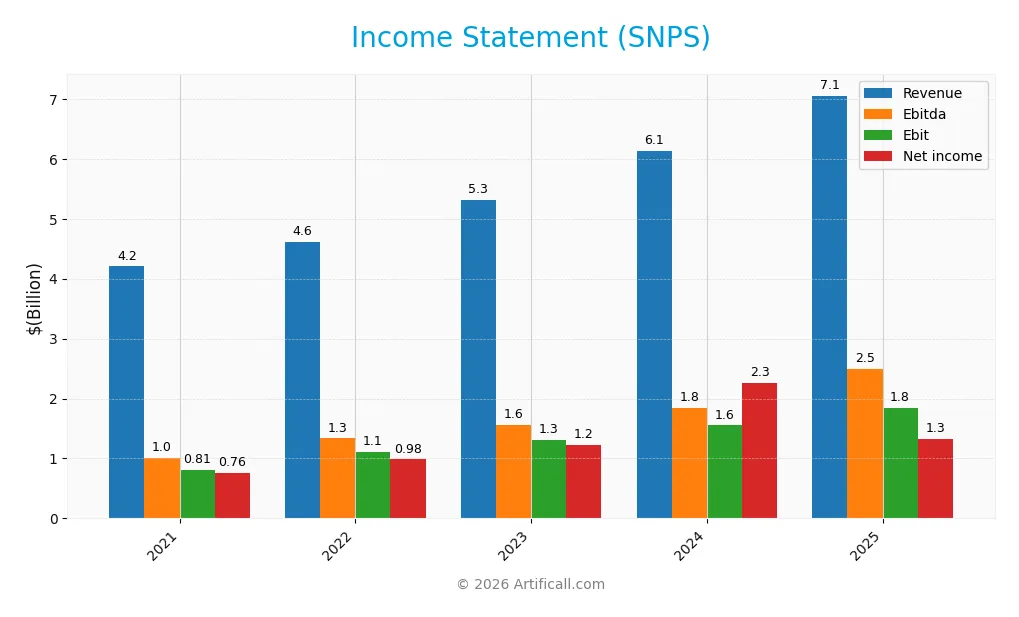
The table below presents Synopsys, Inc.’s key income statement figures for the fiscal years 2021 through 2025, reflecting revenue, expenses, and profitability metrics in USD.
| 2021 | 2022 | 2023 | 2024 | 2025 | |
|---|---|---|---|---|---|
| Revenue | 4.20B | 4.62B | 5.32B | 6.13B | 7.05B |
| Cost of Revenue | 862M | 898M | 1.03B | 1.25B | 1.62B |
| Operating Expenses | 2.61B | 2.57B | 3.01B | 3.53B | 4.52B |
| Gross Profit | 3.34B | 3.72B | 4.29B | 4.88B | 5.43B |
| EBITDA | 1.01B | 1.33B | 1.56B | 1.85B | 2.50B |
| EBIT | 809M | 1.11B | 1.31B | 1.55B | 1.84B |
| Interest Expense | 3.37M | 1.70M | 2.70M | 36.8M | 447M |
| Net Income | 758M | 985M | 1.23B | 2.26B | 1.33B |
| EPS | 4.96 | 6.44 | 8.08 | 14.78 | 8.13 |
| Filing Date | 2021-12-13 | 2022-12-12 | 2023-12-12 | 2024-12-19 | 2025-12-22 |
Income Statement Evolution
From 2021 to 2025, Synopsys, Inc. exhibited strong revenue growth of 67.79%, with the latest fiscal year showing a 15.12% increase. Net income grew 75.87% over the period, though it declined sharply by 48.87% between 2024 and 2025. Gross and EBIT margins remained favorable, at 76.98% and 26.08% respectively, indicating maintained profitability despite rising operating expenses.
Is the Income Statement Favorable?
In 2025, Synopsys reported revenue of $7.05B and net income of $1.33B, reflecting a net margin of 18.89%, considered favorable. However, net margin and EPS declined year-over-year, signaling some pressure on bottom-line profitability. Operating expenses grew in line with revenue, which is viewed as unfavorable, but overall evaluation rates the income statement as favorable, supported by robust top-line growth and solid operating margins.
Financial Ratios
The table below presents key financial ratios for Synopsys, Inc. (SNPS) over the fiscal years 2021 to 2025, offering a clear view of the company’s profitability, liquidity, leverage, and valuation metrics:
| Ratios | 2021 | 2022 | 2023 | 2024 | 2025 |
|---|---|---|---|---|---|
| Net Margin | 18% | 21% | 23% | 37% | 19% |
| ROE | 14% | 18% | 20% | 25% | 5% |
| ROIC | 11% | 15% | 16% | 12% | 2% |
| P/E | 66.5 | 45.5 | 58.1 | 34.8 | 54.6 |
| P/B | 9.5 | 8.1 | 11.6 | 8.7 | 2.6 |
| Current Ratio | 1.16 | 1.09 | 1.15 | 2.44 | 1.62 |
| Quick Ratio | 1.07 | 1.01 | 1.04 | 2.30 | 1.52 |
| D/E | 0.13 | 0.12 | 0.11 | 0.08 | 0.50 |
| Debt-to-Assets | 8% | 7% | 7% | 5% | 30% |
| Interest Coverage | 218 | 677 | 471 | 37 | 2 |
| Asset Turnover | 0.48 | 0.49 | 0.51 | 0.47 | 0.15 |
| Fixed Asset Turnover | 4.35 | 4.43 | 4.79 | 5.43 | 5.04 |
| Dividend Yield | 0% | 0% | 0% | 0% | 0% |
Evolution of Financial Ratios
Between 2021 and 2025, Synopsys, Inc.’s Return on Equity (ROE) exhibited a declining trend from approximately 14.3% to 4.7%, indicating a slowdown in profitability growth. The Current Ratio improved significantly from about 1.16 in 2021 to 1.62 in 2025, reflecting enhanced short-term liquidity. Meanwhile, the Debt-to-Equity Ratio increased moderately, reaching 0.5 in 2025, suggesting a stable but slightly higher reliance on debt financing.
Are the Financial Ratios Favorable?
In 2025, Synopsys shows a mixed financial profile: profitability ratios like ROE (4.7%) and ROIC (1.97%) are unfavorable, while the net profit margin (18.9%) is favorable. Liquidity ratios, including Current (1.62) and Quick (1.52), are favorable, supporting solid short-term financial health. Leverage ratios such as Debt-to-Equity (0.5) and Debt-to-Assets (29.6%) are neutral to favorable. Market valuation metrics like Price-to-Earnings (54.6) are unfavorable. Overall, the ratio evaluation yields a neutral perspective.
Shareholder Return Policy
Synopsys, Inc. (SNPS) does not pay dividends, reflecting a reinvestment strategy consistent with its high growth profile. No dividend payout ratio or yield exists, and no share buyback programs are reported, suggesting capital is retained to fund operations and future growth.
This approach aligns with sustainable long-term value creation by prioritizing business expansion and innovation over immediate shareholder distributions. The absence of dividends and buybacks indicates a focus on strengthening operational cash flow and maintaining financial flexibility.
Score analysis
The following radar chart presents a comprehensive overview of key financial scores for Synopsys, Inc.:
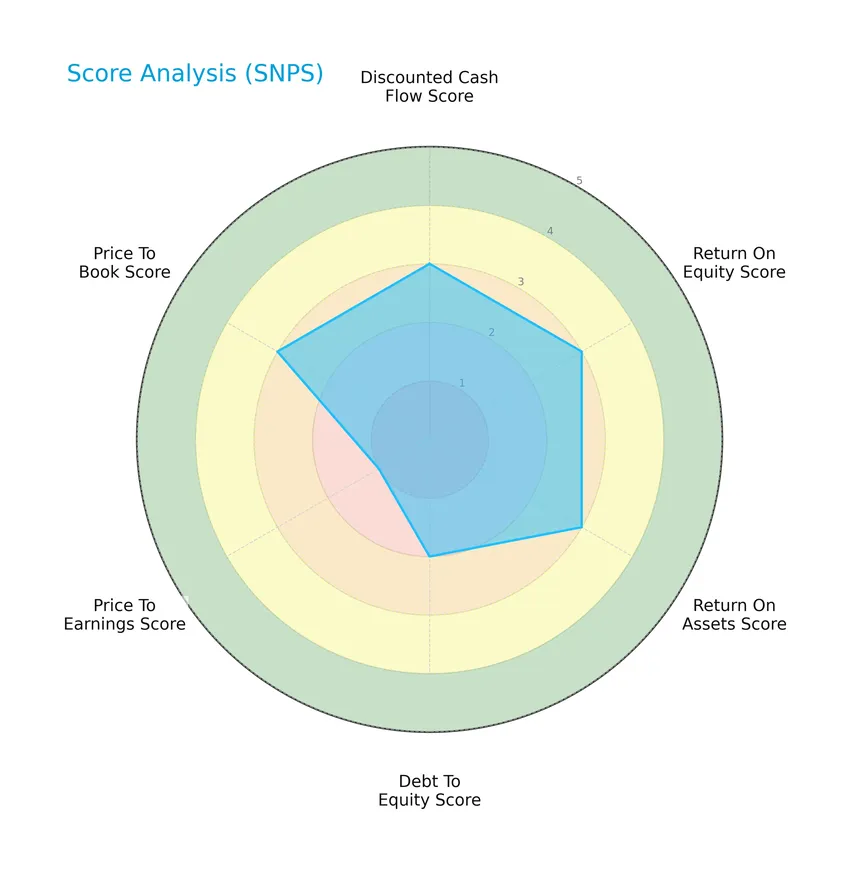
Synopsys shows moderate scores in discounted cash flow, return on equity, return on assets, and price to book, while the debt to equity score is slightly lower. The price to earnings score is notably very unfavorable, indicating valuation concerns.
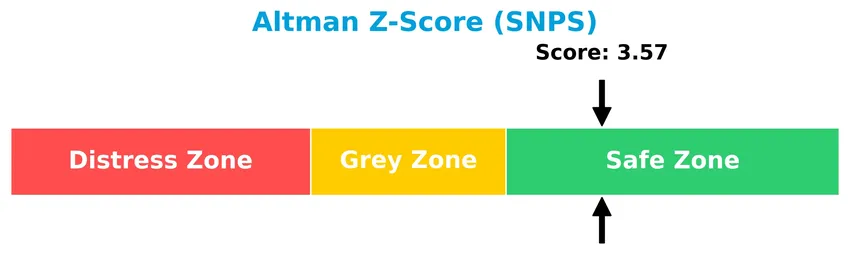
Analysis of the company’s bankruptcy risk
Synopsys is positioned in the safe zone according to its Altman Z-Score, indicating a low risk of bankruptcy and financial distress:
Is the company in good financial health?
Here is the Piotroski Score analysis for Synopsys, reflecting its financial strength:

With a Piotroski Score of 4, Synopsys is considered to have average financial health, suggesting moderate operational efficiency and profitability without strong signals of financial robustness.
Competitive Landscape & Sector Positioning
This sector analysis will explore Synopsys, Inc.’s strategic positioning, revenue by segment, key products, main competitors, and competitive advantages. I will assess whether Synopsys holds a competitive advantage over its industry peers based on these factors.
Strategic Positioning
Synopsys, Inc. maintains a diversified product portfolio focused on electronic design automation software, intellectual property solutions, and security services. Geographically, it generates substantial revenue from the United States (3.1B in 2025) and significant contributions from China, Korea, Europe, and other countries, reflecting a broad international presence.
Revenue by Segment
This pie chart illustrates Synopsys, Inc.’s revenue distribution by product segments for the fiscal year 2025, highlighting its main business drivers and segment performance.
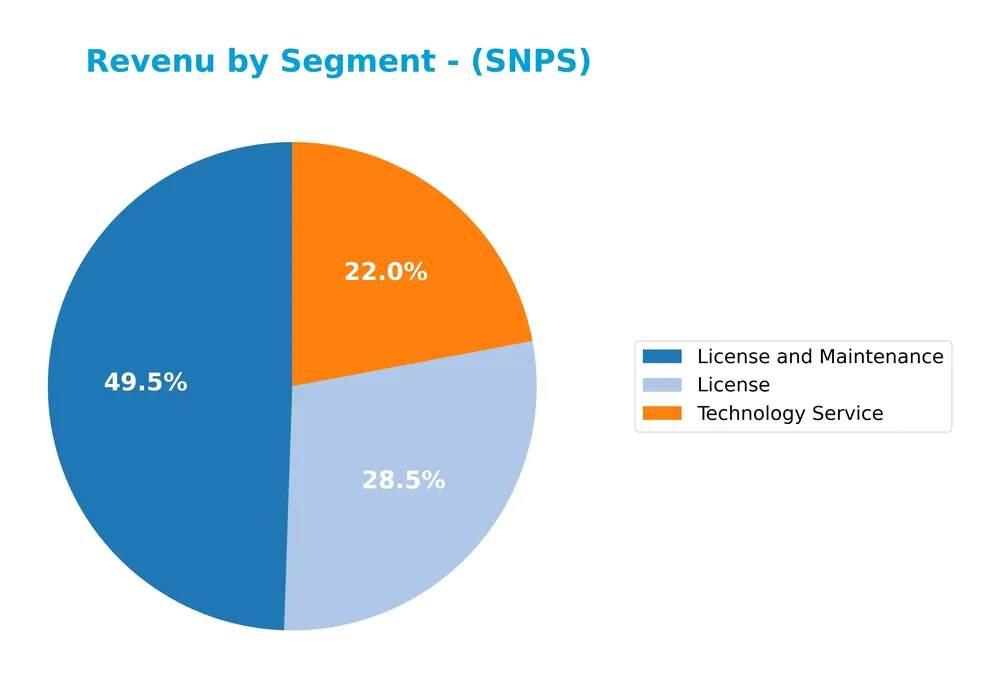
In 2025, the “License and Maintenance” segment remains the dominant revenue driver with $3.49B, showing steady growth from $3.22B in 2024. The “License” segment also grew to $2.01B, indicating strengthening license sales. “Technology Service” rose to $1.55B, marking a significant acceleration compared to prior years. Notably, the “Product” segment data was not reported in 2025, suggesting a shift or consolidation focus on licensing and services. This concentration in licensing and services warrants cautious monitoring for potential risk diversification.
Key Products & Brands
The following table summarizes Synopsys, Inc.’s main products and brand offerings:
| Product | Description |
|---|---|
| Fusion Design Platform | Digital design implementation solutions for integrated circuits. |
| Verification Continuum Platform | Virtual prototyping, simulation, emulation, FPGA-based prototyping, and debug solutions. |
| FPGA Design Products | Programmable products designed to perform specific hardware functions. |
| Intellectual Property (IP) Solutions | USB, PCI Express, DDR, Ethernet, SATA, MIPI, HDMI, Bluetooth low energy, analog IP, SoC infrastructure IP. |
| Logic Libraries & Embedded Memories | Components supporting semiconductor design and manufacturing. |
| Configurable Processor Cores & ASIP Tools | Processor cores and instruction-set tools tailored for embedded applications. |
| IP Subsystems | Audio, sensor, and data fusion functionality products. |
| Security IP Solutions | Security-focused intellectual property for chip design. |
| Platform Architect Solutions | SoC architecture analysis and optimization tools. |
| Virtual Prototyping & HAPS Systems | FPGA-based prototyping and development platforms. |
| Optical Systems & Photonic Design Tools | Tools for designing optical and photonic devices. |
| Security Testing & Managed Services | Services to detect and remediate software vulnerabilities and defects during development and manufacturing. |
Synopsys offers a comprehensive suite of electronic design automation software, IP cores, and professional services serving the semiconductor and related industries with solutions spanning design, verification, security, and prototyping.
Main Competitors
There are 32 competitors in the Technology sector, with the table below listing the top 10 leaders by market capitalization:
| Competitor | Market Cap. |
|---|---|
| Microsoft Corporation | 3.52T |
| Oracle Corporation | 553B |
| Palantir Technologies Inc. | 383B |
| Adobe Inc. | 140B |
| Palo Alto Networks, Inc. | 120B |
| CrowdStrike Holdings, Inc. | 113B |
| Synopsys, Inc. | 92B |
| Cloudflare, Inc. | 69B |
| Fortinet, Inc. | 59B |
| Block, Inc. | 40B |
Synopsys, Inc. ranks 7th among its 32 competitors in the Software – Infrastructure industry. Its market cap is approximately 2.73% of the top player, Microsoft Corporation. Synopsys is positioned below the average market cap of the top 10 competitors (508B) but remains above the sector median of 18.8B. The company is 17.82% smaller than the next competitor above it, CrowdStrike Holdings.
Comparisons with competitors
Check out how we compare the company to its competitors:
Does SNPS have a competitive advantage?
Synopsys, Inc. currently does not present a competitive advantage, as its return on invested capital (ROIC) is significantly below its weighted average cost of capital (WACC), indicating value destruction and declining profitability. The company’s global moat status is rated as very unfavorable due to a sharp decline in ROIC over the 2021-2025 period.
Looking ahead, Synopsys offers a broad portfolio of electronic design automation software and intellectual property solutions across multiple industries, including automotive, medicine, and energy. Its future outlook includes potential growth opportunities from expanding markets and continued innovation in digital design, verification platforms, and security testing services.
SWOT Analysis
This SWOT analysis provides a clear overview of Synopsys, Inc.’s key internal and external factors to inform investment decisions.
Strengths
- strong revenue growth (15.12% in 1 year)
- high gross margin (77%)
- diversified IP and software portfolio
Weaknesses
- declining net margin growth (-48.87% in 1 year)
- moderate ROE and ROIC (4.7% and 1.97%)
- high P/E ratio (54.56)
Opportunities
- expanding semiconductor and AI markets
- growth in Asia-Pacific regions
- increasing demand for security and verification tools
Threats
- intense competition in software infrastructure
- cyclicality in semiconductor industry
- geopolitical risks in China and Korea
Synopsys demonstrates solid growth and profitability strengths but faces margin pressures and valuation concerns. Its strategic focus should capitalize on expanding technology markets while managing operational efficiency and geopolitical risks.
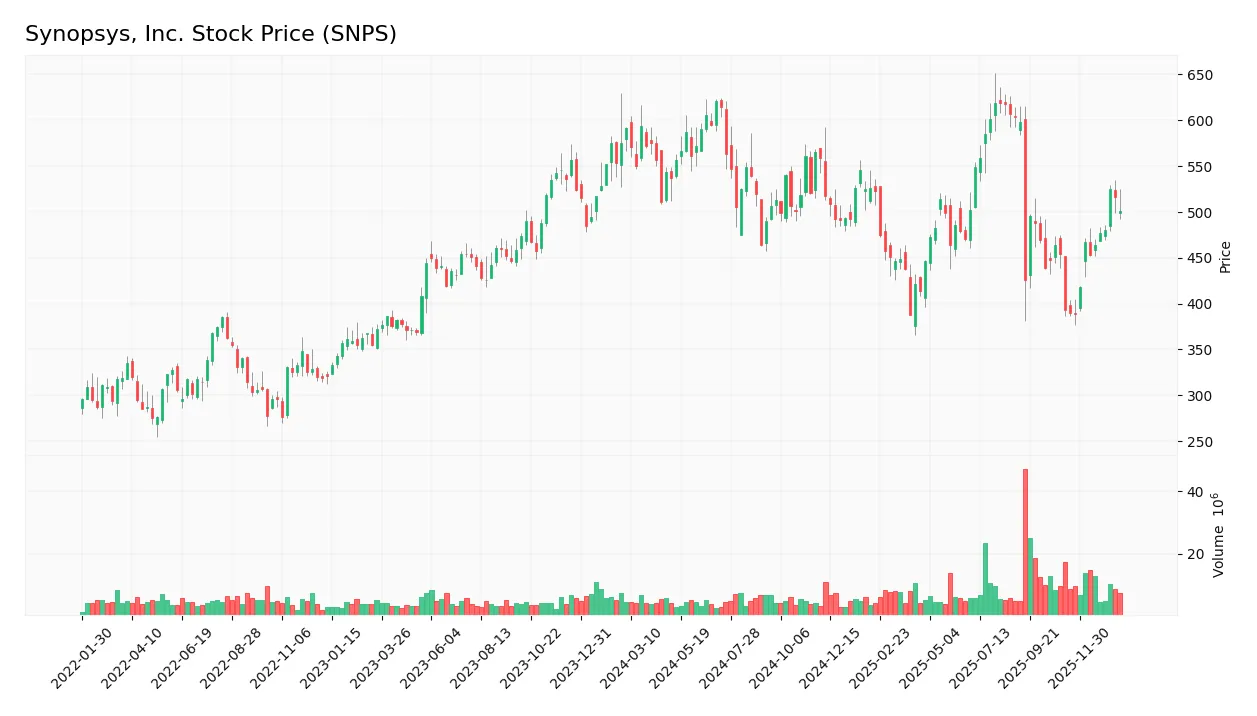
Stock Price Action Analysis
The weekly stock chart of Synopsys, Inc. (SNPS) over the past 12 months shows significant price fluctuations with notable volatility and trend shifts:
Trend Analysis
Over the past 12 months, SNPS stock experienced a -15.21% price change, indicating a bearish trend with accelerating downward momentum. The stock reached a high of 621.3 and a low of 388.13, with a high volatility level reflected by a 58.56 standard deviation. Recent weeks show a recovery phase with a 27.44% gain since November 2025.
Volume Analysis
Trading volume for SNPS has been increasing, totaling 824M shares over the analyzed period. Buyers accounted for 47.77%, but recent activity from November 2025 to January 2026 reveals slight seller dominance at 55.55%, suggesting cautious investor sentiment and moderate market participation.
Target Prices
Analysts present a confident target consensus for Synopsys, Inc., reflecting strong growth expectations.
| Target High | Target Low | Consensus |
|---|---|---|
| 600 | 425 | 530 |
The target prices show a bullish outlook with a consensus around 530, indicating optimism about Synopsys’ future performance.

Don’t Let Luck Decide Your Entry Point
Optimize your entry points with our advanced ProRealTime indicators. You’ll get efficient buy signals with precise price targets for maximum performance. Start outperforming now!
Analyst & Consumer Opinions
This section examines the latest analyst ratings and consumer feedback regarding Synopsys, Inc. (SNPS).
Stock Grades
The latest grades for Synopsys, Inc. from leading financial analysts are presented in the following table:
| Grading Company | Action | New Grade | Date |
|---|---|---|---|
| Piper Sandler | Downgrade | Neutral | 2026-01-13 |
| Morgan Stanley | Maintain | Overweight | 2025-12-12 |
| Wells Fargo | Maintain | Equal Weight | 2025-12-11 |
| Keybanc | Maintain | Overweight | 2025-12-11 |
| Rosenblatt | Maintain | Buy | 2025-12-11 |
| JP Morgan | Maintain | Overweight | 2025-12-11 |
| B of A Securities | Upgrade | Buy | 2025-12-11 |
| Piper Sandler | Maintain | Overweight | 2025-12-11 |
| Needham | Maintain | Buy | 2025-12-11 |
| Rosenblatt | Upgrade | Buy | 2025-12-09 |
The overall trend shows a predominance of buy and overweight ratings, with a recent downgrade by Piper Sandler to neutral. This indicates a generally positive but slightly cautious sentiment among analysts towards Synopsys.
Consumer Opinions
Consumer sentiment around Synopsys, Inc. (SNPS) reflects a generally positive view of its technological innovation and customer support, though some users point to pricing concerns.
| Positive Reviews | Negative Reviews |
|---|---|
| “Synopsys offers cutting-edge EDA tools that significantly improve our chip design efficiency.” | “The software licensing costs are quite high, making it difficult for smaller firms to access.” |
| “Excellent customer service with quick and knowledgeable responses to technical queries.” | “Steep learning curve for some of the advanced features, requiring substantial training.” |
| “Consistently reliable performance and regular updates keep the tools competitive.” | “Occasionally, the integration with other platforms is less seamless than expected.” |
Overall, consumers appreciate Synopsys for its innovation and strong support, but they frequently mention high costs and complexity as potential drawbacks.
Risk Analysis
Below is a detailed table summarizing the key risks associated with investing in Synopsys, Inc. (SNPS), considering recent financial and market data:
| Category | Description | Probability | Impact |
|---|---|---|---|
| Market Volatility | Price fluctuations due to tech sector sensitivity and high beta (1.12) | High | Medium |
| Valuation Risk | Elevated P/E ratio (54.56) suggests overvaluation, posing correction risk | Medium | High |
| Profitability Risk | Low ROE (4.7%) and ROIC (1.97%) indicate challenges in generating returns despite favorable net margin | Medium | Medium |
| Competitive Risk | Intense competition in electronic design automation may pressure market share and margins | Medium | High |
| Liquidity Risk | Moderate current (1.62) and quick ratios (1.52) suggest adequate but not excessive liquidity | Low | Low |
| Dividend Risk | No dividend yield, reflecting lack of income return for investors | Low | Low |
| Debt Risk | Moderate debt-to-equity ratio (0.5) and interest coverage (4.12) imply manageable but present leverage | Low | Medium |
| Bankruptcy Risk | Altman Z-Score of 3.57 places company in safe zone, indicating low bankruptcy risk | Low | High |
The most significant risks for Synopsys currently stem from its high valuation and competitive pressures, which could impact stock price and profitability. Despite strong liquidity and low bankruptcy risk, investors should watch for market volatility and any deterioration in returns on equity and capital.
Should You Buy Synopsys, Inc.?
Synopsys, Inc. appears to be navigating a challenging phase with declining profitability and a deteriorating competitive moat, suggesting value erosion. Despite a manageable leverage profile and a safe-zone Altman Z-Score, the overall B- rating could be seen as reflecting moderate operational efficiency and investment appeal.
Strength & Efficiency Pillars
Synopsys, Inc. exhibits solid profitability with a gross margin of 76.98% and a net margin of 18.89%, reflecting efficient cost management and strong pricing power. Its Altman Z-score of 3.57 places it comfortably in the safe zone, signaling robust financial health and a low bankruptcy risk. The Piotroski score of 4 suggests average financial strength. However, the company’s return on invested capital (1.97%) falls below its WACC (8.3%), indicating Synopsys is currently not a value creator and is shedding value. Liquidity ratios are favorable, with a current ratio at 1.62 and quick ratio at 1.52 supporting short-term financial stability.
Weaknesses and Drawbacks
Synopsys faces notable valuation and profitability challenges, with a high P/E ratio of 54.56 marking a premium valuation that raises risk concerns. The return on equity is low at 4.7%, and ROIC’s decline of over 81% underscores deteriorating efficiency in capital deployment. Although debt-to-equity remains moderate at 0.5, the company’s asset turnover is weak at 0.15, indicating underutilization of assets. Market pressure is evident, with seller dominance at 55.55% in the recent period and an overall bearish stock trend marked by a -15.21% price decline, creating short-term headwinds for investors.
Our Verdict about Synopsys, Inc.
The long-term fundamental profile for Synopsys may appear unfavorable due to its value-destroying ROIC trend and stretched valuation metrics. Despite a recent positive price acceleration (+27.44%) and moderately increasing volume, slightly seller-dominant behavior suggests caution. Despite these short-term pressures, the company’s strong margins and financial health might suggest a wait-and-see approach for a better entry point rather than immediate exposure.
Disclaimer: This content is for informational purposes only and does not constitute financial, investment, or other professional advice. Investing in financial markets involves a significant risk of loss, and past performance is not indicative of future results.
Additional Resources
- Mn Services Vermogensbeheer B.V. Buys 12,728 Shares of Synopsys, Inc. $SNPS – MarketBeat (Jan 24, 2026)
- The Law Offices of Frank R. Cruz Announces Investigation of Synopsys, Inc. (SNPS) on Behalf of Investors – Business Wire (Jan 22, 2026)
- Synopsys Enters Definitive Agreement with GlobalFoundries For Sale of Processor IP Solutions Business – Synopsys (Jan 14, 2026)
- Kuehn Law Encourages Investors of Synopsys, Inc. to Contact Law Firm – PR Newswire (Jan 20, 2026)
- The Law Offices of Frank R. Cruz Announces Investigation of Synopsys, Inc. (SNPS) on Behalf of Investors – Chartmill (Jan 22, 2026)
For more information about Synopsys, Inc., please visit the official website: synopsys.com