Home > Analyses > Industrials > Symbotic Inc.
Symbotic Inc. is transforming the landscape of warehouse operations with cutting-edge robotics and automation technology that streamline inventory management for major retailers and wholesalers. As a pioneer in industrial machinery, Symbotic’s flagship Symbotic System delivers measurable efficiency gains while driving down operational costs. Renowned for innovation and market influence, the company challenges traditional logistics models. The critical question for investors now is whether Symbotic’s robust fundamentals can sustain its ambitious growth trajectory and justify its current valuation.
Table of contents
Business Model & Company Overview
Symbotic Inc., founded and headquartered in Wilmington, Massachusetts, stands as a leader in industrial machinery, specializing in automation technology. Its core mission revolves around The Symbotic System, a comprehensive warehouse automation ecosystem designed to enhance operational efficiency for retailers and wholesalers across the United States. With a workforce of 1,650 employees, the company integrates robotics and advanced technology to streamline inventory management and reduce costs, solidifying its dominant position in the automation sector.
The company’s revenue engine balances high-value hardware with sophisticated software and recurring service contracts, creating a resilient and scalable business model. Symbotic’s strategic footprint primarily spans the U.S. market, delivering solutions that combine robotics and technology to maximize efficiency and inventory control. Its competitive advantage lies in the seamless integration of these elements, establishing a formidable economic moat that is shaping the future of warehouse automation and supply chain management globally.
Financial Performance & Fundamental Metrics
I will analyze Symbotic Inc.’s income statement, key financial ratios, and dividend payout policy to assess its overall financial health and investment potential.
Income Statement
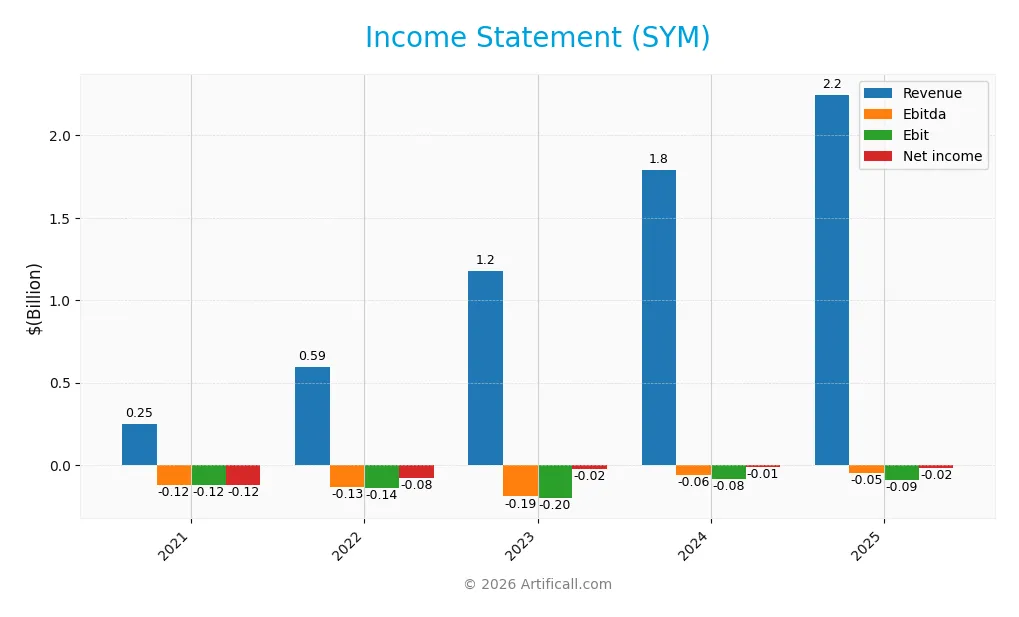
The table below summarizes Symbotic Inc.’s key income statement figures for the fiscal years 2021 through 2025, presented in USD.
| 2021 | 2022 | 2023 | 2024 | 2025 | |
|---|---|---|---|---|---|
| Revenue | 252M | 593M | 1.18B | 1.79B | 2.25B |
| Cost of Revenue | 241M | 494M | 967M | 1.51B | 1.82B |
| Operating Expenses | 133M | 240M | 433M | 396M | 538M |
| Gross Profit | 10M | 100M | 210M | 279M | 423M |
| EBITDA | -118M | -134M | -190M | -60M | -48M |
| EBIT | -122M | -140M | -201M | -83M | -92M |
| Interest Expense | 0 | 0 | 0 | 0 | 0 |
| Net Income | -122M | -79M | -24M | -13M | -17M |
| EPS | -19.03 | -0.13 | -0.37 | -0.08 | -0.16 |
| Filing Date | 2021-09-30 | 2022-12-09 | 2023-12-11 | 2024-12-04 | 2025-11-24 |
Income Statement Evolution
From 2021 to 2025, Symbotic Inc. experienced robust revenue growth of 792%, reaching $2.25B in 2025. Gross profit also expanded favorably by 51% year-over-year, with a stable gross margin near 18.8%, indicating consistent production efficiency. However, operating expenses grew at a similar pace to revenue, exerting pressure on EBIT, which declined by 11% last year, reflecting margin compression at the operating level.
Is the Income Statement Favorable?
In 2025, Symbotic posted a net loss of $17M, representing a narrow net margin of -0.75%, which is slightly unfavorable but improved compared to prior years. The absence of interest expense is a positive factor, while the negative EBIT margin of -4.1% indicates ongoing operational challenges. Despite recent earnings pressure, the company’s fundamentals are deemed generally favorable given strong revenue and profit growth trends over the full period.
Financial Ratios
The table below summarizes key financial ratios for Symbotic Inc. (SYM) over the past five fiscal years, providing a clear view of profitability, efficiency, liquidity, leverage, and market valuation:
| Ratios | 2021 | 2022 | 2023 | 2024 | 2025 |
|---|---|---|---|---|---|
| Net Margin | -48.55% | -13.31% | -2.03% | -0.75% | -0.75% |
| ROE | 10.99% | -10.99% | -291.05% | -6.84% | -7.65% |
| ROIC | 217% | -1.30% | -8.65% | -20.79% | -16.63% |
| P/E | -4.07 | -7.87 | -90.12 | -173.02 | -334.54 |
| P/B | -0.45 | 86.58 | 26229.74 | 11.83 | 25.60 |
| Current Ratio | 0.77 | 1.16 | 0.97 | 1.33 | 1.08 |
| Quick Ratio | 0.67 | 0.98 | 0.83 | 1.23 | 0.99 |
| D/E | 0 | 0 | 0 | 0 | 0.14 |
| Debt-to-Assets | 0 | 0 | 0 | 0 | 0.01 |
| Interest Coverage | 0 | 0 | 0 | 0 | 0 |
| Asset Turnover | 0.90 | 0.94 | 1.12 | 1.13 | 0.94 |
| Fixed Asset Turnover | 13.53 | 23.85 | 34.11 | 18.41 | 15.92 |
| Dividend Yield | 0% | 0% | 0% | 0% | 0% |
Evolution of Financial Ratios
Symbotic Inc.’s Return on Equity (ROE) remained negative and showed some improvement from extreme lows in prior years to -7.65% in 2025. The Current Ratio fluctuated moderately, ending at 1.08, indicating a stable but modest liquidity position. Meanwhile, the Debt-to-Equity Ratio increased slightly to 0.14, reflecting a low and manageable leverage level. Profitability remains weak with persistently negative margins.
Are the Financial Ratios Fovorable?
In 2025, profitability ratios like net margin (-0.75%) and ROE (-7.65%) are unfavorable, reflecting ongoing losses. Liquidity ratios such as current (1.08) and quick (0.99) ratios are neutral, indicating adequate short-term financial health. Leverage ratios, including debt-to-equity (0.14) and debt-to-assets (1.32%), are favorable, suggesting low financial risk. Market valuation ratios show mixed signals, with a highly unfavorable price-to-book ratio (25.6) but a favorable negative price-to-earnings ratio. Overall, the financial profile is slightly unfavorable.
Shareholder Return Policy
Symbotic Inc. does not pay dividends, reflecting ongoing net losses and a reinvestment focus. Despite negative net income per share, the company maintains positive free cash flow per share in recent years and does not engage in share buybacks.
This approach indicates a prioritization of growth and capital preservation over immediate shareholder distributions. The absence of dividends and buybacks aligns with sustaining long-term value creation, provided the firm can eventually return to profitability.
Score analysis
The following radar chart illustrates Symbotic Inc.’s key financial scores across several valuation and profitability metrics:
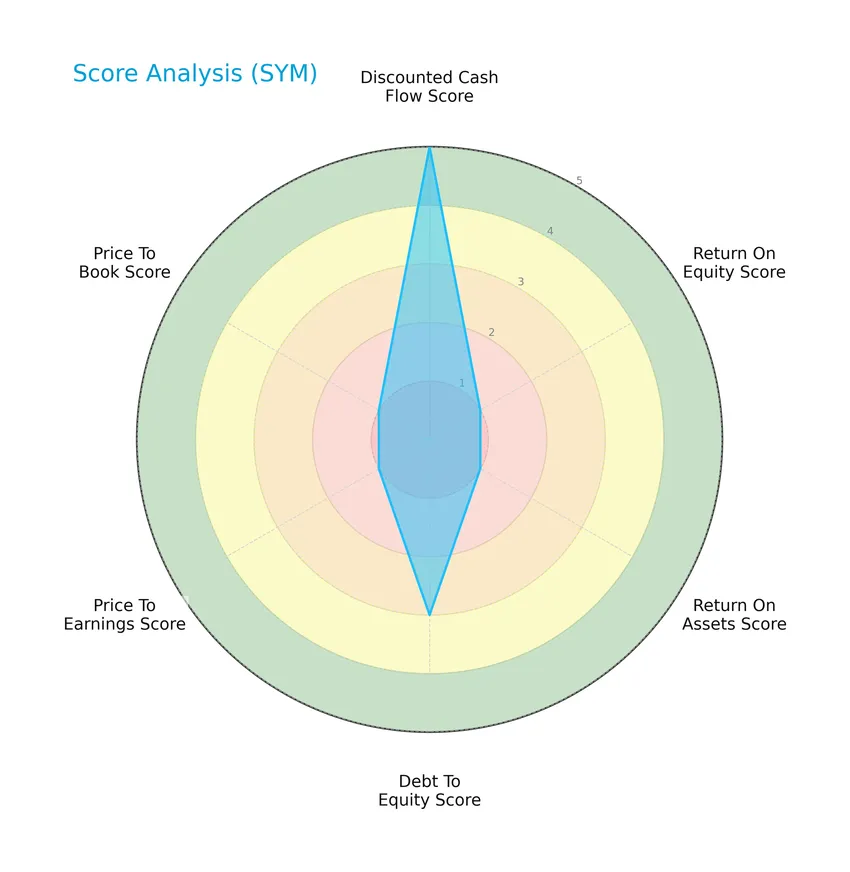
Symbotic Inc. shows a very favorable discounted cash flow score of 5, indicating strong intrinsic value prospects. However, return on equity and assets scores are both very unfavorable at 1, signaling weak profitability. The debt-to-equity score is moderate at 3, while price-to-earnings and price-to-book ratios are also very unfavorable at 1 each.
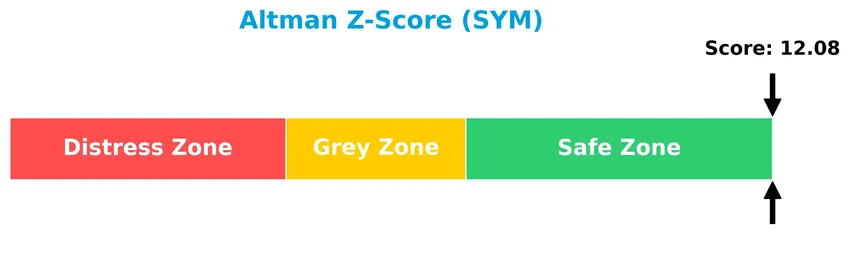
Analysis of the company’s bankruptcy risk
Symbotic Inc. is firmly in the safe zone according to its Altman Z-Score of 12.08, indicating a low risk of bankruptcy and strong financial stability:
Is the company in good financial health?
This Piotroski diagram presents an overview of Symbotic Inc.’s financial health assessment:
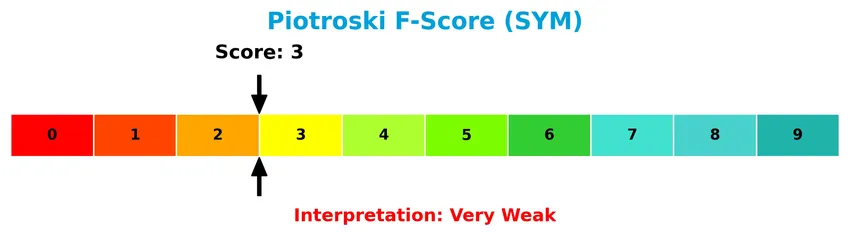
With a Piotroski score of 3, Symbotic Inc. falls into the very weak category, reflecting challenges in profitability, leverage, and operational efficiency that suggest limited financial strength at this time.
Competitive Landscape & Sector Positioning
This section will analyze the industrial machinery sector in which Symbotic Inc. operates, focusing on strategic positioning and revenue segments. I will examine key products, main competitors, and competitive advantages to better understand the market context. The analysis will also attempt to determine whether Symbotic Inc. holds a competitive advantage over its rivals.
Strategic Positioning
Symbotic Inc. focuses primarily on a concentrated product portfolio centered on its Systems segment, which generated $2.12B in 2025, complemented by smaller Operation Services and Software Maintenance revenues. Geographically, the company is heavily exposed to the US market, accounting for over $2.19B of revenue in 2025, with limited international diversification.
Revenue by Segment
The pie chart illustrates Symbotic Inc.’s revenue distribution by segment for the fiscal year 2025, highlighting the relative contribution of each business area.
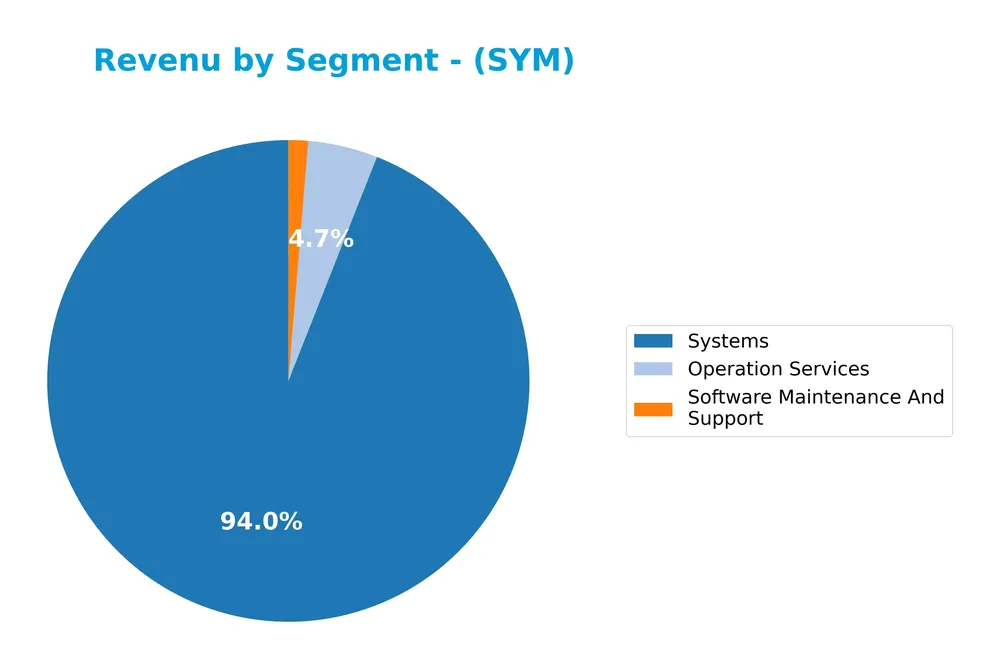
In 2025, Systems remains the dominant revenue driver with $2.12B, showing strong growth from $1.71B in 2024 and $1.14B in 2023. Operation Services also expanded significantly to $105M, nearly doubling from $69M the previous year. Software Maintenance And Support grew to $30M but remains the smallest segment. The trend indicates a concentration in Systems, with notable acceleration in both Systems and Operation Services, suggesting strategic focus and scaling in these areas.
Key Products & Brands
The following table summarizes Symbotic Inc.’s key products and brand offerings with their descriptions:
| Product | Description |
|---|---|
| The Symbotic System | A full-service warehouse automation system designed to reduce costs, improve efficiency, and maximize inventory for retailers and wholesalers. |
| Operation Services | Services related to the operation of automation systems, supporting client warehouses and logistics. |
| Software Maintenance And Support | Ongoing software maintenance and technical support services ensuring system functionality and reliability. |
Symbotic’s product portfolio centers on automation technology, combining advanced robotics with comprehensive service and software support to optimize warehouse operations for its clients.
Main Competitors
There are 24 competitors in the Industrials sector, with the table below listing the top 10 leaders by market capitalization:
| Competitor | Market Cap. |
|---|---|
| Eaton Corporation plc | 127.1B |
| Parker-Hannifin Corporation | 114.2B |
| Howmet Aerospace Inc. | 85.2B |
| Emerson Electric Co. | 76.3B |
| Illinois Tool Works Inc. | 73.0B |
| Cummins Inc. | 71.9B |
| AMETEK, Inc. | 48.3B |
| Roper Technologies, Inc. | 46.8B |
| Rockwell Automation, Inc. | 44.8B |
| Symbotic Inc. | 35.9B |
Symbotic Inc. ranks 10th among its 24 competitors, holding about 29.5% of the market cap of the sector leader, Eaton Corporation plc. The company’s market capitalization is below the average of the top 10 peers (72.4B) but remains above the sector median (32.4B). It maintains a 19.4% market cap gap to the next competitor above, Rockwell Automation, indicating a notable but manageable distance in scale.
Comparisons with competitors
Check out how we compare the company to its competitors:
Does SYM have a competitive advantage?
Symbotic Inc. currently does not present a competitive advantage, as its return on invested capital (ROIC) is significantly below its weighted average cost of capital (WACC), indicating value destruction and declining profitability. The company’s profitability metrics, including a negative EBIT margin of -4.1% and a net margin of -0.75%, further reflect operational challenges despite favorable revenue growth.
Looking ahead, Symbotic has opportunities to expand its automation technology offerings in warehouse systems, primarily serving U.S. retailers and wholesalers. Continued revenue growth and gross profit improvement suggest potential in scaling its technology, although the company must manage operational expenses and improve profitability to strengthen its market position.
SWOT Analysis
This SWOT analysis highlights Symbotic Inc.’s key internal and external factors to guide strategic investment decisions.
Strengths
- Strong revenue growth (25.65% YoY)
- Low debt levels (D/E 0.14)
- Leading warehouse automation technology
Weaknesses
- Negative EBIT margin (-4.1%)
- Declining profitability (ROIC -16.6%)
- Weak Piotroski score (3)
Opportunities
- Expanding U.S. market demand
- Potential international expansion
- Rising automation adoption in retail
Threats
- High beta (2.14) implies volatility
- Intensifying competition in robotics
- Economic downturn risks reducing capex
Symbotic’s robust growth and technological edge provide a solid foundation, but ongoing profitability challenges and market volatility require cautious risk management. Strategic focus should prioritize improving margins while leveraging automation trends and expanding geographic reach.
Stock Price Action Analysis
The weekly stock chart for Symbotic Inc. (SYM) displays recent price movements and fluctuations over the past 100 weeks:
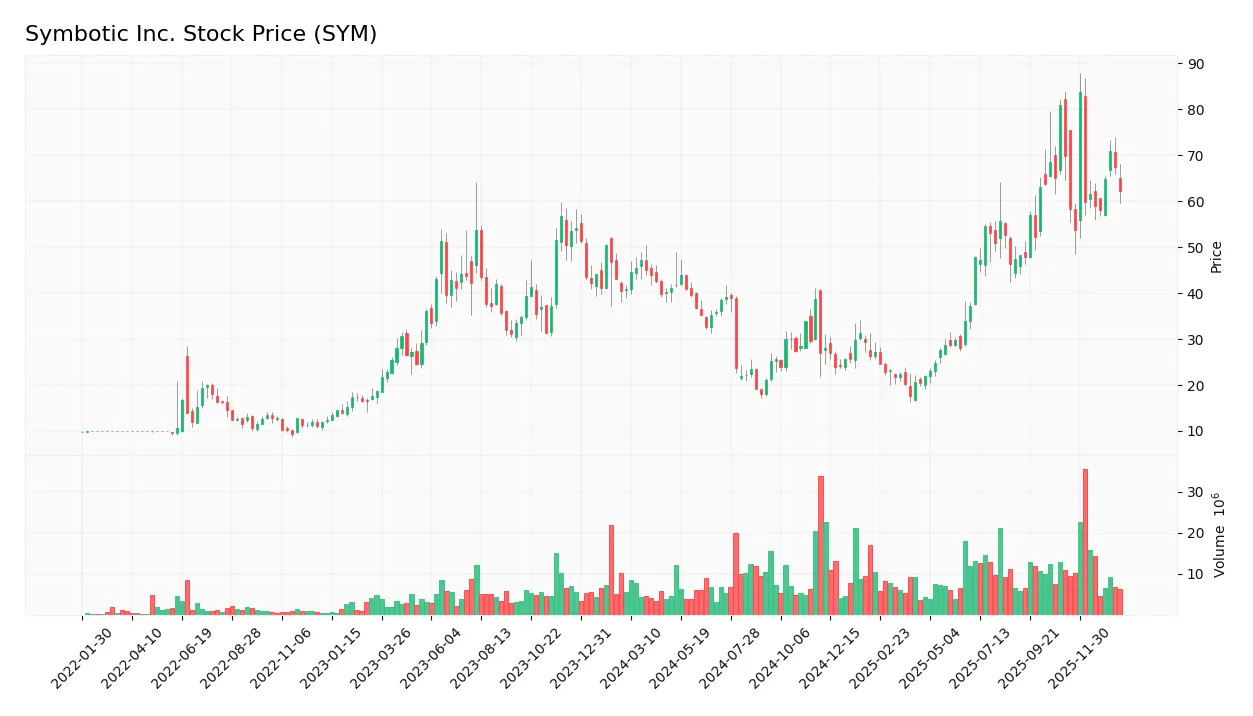
Trend Analysis
Over the past 12 months, SYM’s stock price increased by 51.67%, indicating a bullish trend. The price range spanned from a low of 17.5 to a high of 83.77, with volatility reflected in a standard deviation of 15.58. The trend shows deceleration despite the strong gains.
Volume Analysis
In the last three months, trading volume has been increasing overall, but recent activity is seller-driven with buyers accounting for only 35.57%. This shift toward seller dominance suggests cautious investor sentiment and potential profit-taking or repositioning.
Target Prices
The consensus target prices for Symbotic Inc. (SYM) reflect a moderately optimistic outlook among analysts.
| Target High | Target Low | Consensus |
|---|---|---|
| 83 | 42 | 65.56 |
Analysts expect SYM’s price to range broadly, with a consensus pointing to a potential rise near 65.56, indicating cautious confidence in the stock’s future performance.

Don’t Let Luck Decide Your Entry Point
Optimize your entry points with our advanced ProRealTime indicators. You’ll get efficient buy signals with precise price targets for maximum performance. Start outperforming now!
Analyst & Consumer Opinions
This section examines recent analyst ratings and consumer feedback regarding Symbotic Inc. (SYM) for a comprehensive overview.
Stock Grades
Here is the summary of recent grades assigned to Symbotic Inc. by recognized financial institutions:
| Grading Company | Action | New Grade | Date |
|---|---|---|---|
| Barclays | Maintain | Underweight | 2026-01-12 |
| Goldman Sachs | Downgrade | Sell | 2025-12-02 |
| Barclays | Maintain | Underweight | 2025-11-26 |
| Baird | Maintain | Neutral | 2025-11-26 |
| DA Davidson | Maintain | Neutral | 2025-11-25 |
| Craig-Hallum | Upgrade | Buy | 2025-11-25 |
| Northland Capital Markets | Maintain | Outperform | 2025-11-25 |
| Needham | Maintain | Buy | 2025-11-25 |
| Cantor Fitzgerald | Maintain | Overweight | 2025-11-25 |
| Citigroup | Maintain | Buy | 2025-11-25 |
The overall trend shows a mixed but generally positive outlook, with a majority of buy and outperform ratings balanced by some underweight and sell opinions, indicating varied analyst sentiment.
Consumer Opinions
Consumers have mixed yet insightful views on Symbotic Inc., reflecting both its technological strengths and areas needing improvement.
| Positive Reviews | Negative Reviews |
|---|---|
| “Symbotic’s automation solutions significantly boosted our warehouse efficiency.” | “Customer service response times can be slow and frustrating.” |
| “The AI-driven robotics are innovative and reliable in daily operations.” | “High initial investment cost makes it tough for smaller businesses.” |
| “Their technology integration was seamless with our existing systems.” | “Occasional software glitches disrupt workflow unexpectedly.” |
Overall, customers praise Symbotic’s cutting-edge automation and integration capabilities, but concerns about cost and support responsiveness frequently arise. This feedback is crucial for investors assessing growth potential versus operational challenges.
Risk Analysis
Below is a summary table highlighting key risks for Symbotic Inc. based on recent financial and market data:
| Category | Description | Probability | Impact |
|---|---|---|---|
| Profitability | Negative net margin and returns (ROE -7.65%, ROIC -16.63%) | High | High |
| Market Volatility | High beta of 2.143 indicates sensitivity to market fluctuations | High | Medium |
| Financial Health | Very weak Piotroski score (3) despite safe Altman Z-Score | Medium | High |
| Valuation | High price-to-book ratio (25.6) suggests possible overvaluation | Medium | Medium |
| Liquidity | Near-neutral current (1.08) and quick ratios (0.99) | Medium | Medium |
| Dividend Policy | No dividend yield, limiting income for investors | Low | Low |
Profitability risks are the most concerning, with Symbotic showing persistent negative margins and returns, signaling operational challenges. Despite a strong Altman Z-Score indicating low bankruptcy risk, the weak Piotroski score highlights potential financial fragility. The company’s high beta also exposes investors to significant market risk.
Should You Buy Symbotic Inc.?
Symbotic Inc. appears to have a challenging profitability profile with declining operational returns and a very unfavorable moat, indicating value erosion. Despite a manageable leverage profile and a safe Altman Z-score, its overall rating of C+ suggests moderate investment appeal with significant risks.
Strength & Efficiency Pillars
Symbotic Inc. shows a strong financial safety net with an Altman Z-score of 12.08, indicating a very low bankruptcy risk. The company’s low debt-to-equity ratio of 0.14 and minimal debt-to-assets at 1.32% reflect prudent leverage management. Although profitability metrics such as ROE (-7.65%) and ROIC (-16.63%) are unfavorable, the firm benefits from a high fixed asset turnover of 15.92, signaling operational efficiency. Despite these strengths, Symbotic is not a value creator as its ROIC (-16.63%) remains well below its WACC of 13.9%.
Weaknesses and Drawbacks
Symbotic grapples with significant profitability challenges, evidenced by a negative net margin of -0.75% and EBIT margin of -4.1%. The valuation appears stretched, with a price-to-book ratio of 25.6, flagging potential overvaluation risks. The company’s Piotroski score of 3 signals very weak financial health, compounding concerns. Market pressure is evident as recent trading shows a seller-dominant environment with buyers comprising just 35.57% of volume, creating short-term headwinds. Additionally, the negative ROE and ROIC suggest ongoing value destruction.
Our Verdict about Symbotic Inc.
Symbotic’s long-term fundamental profile is unfavorable due to persistent losses and value erosion. Despite a bullish overall stock trend with a 51.67% price increase over the longer term, recent seller dominance and decelerating momentum suggest caution. Therefore, while the company’s operational efficiency and solid financial safety offer some support, recent market pressure may indicate a wait-and-see approach could be prudent before considering entry.
Disclaimer: This content is for informational purposes only and does not constitute financial, investment, or other professional advice. Investing in financial markets involves a significant risk of loss, and past performance is not indicative of future results.
Additional Resources
- Symbotic (SYM) loses 28.7% on dilution impact of 10 million share sale – MSN (Jan 24, 2026)
- Symbotic Inc. (SYM) Stock Sinks As Market Gains: Here’s Why – Yahoo Finance (Jan 21, 2026)
- Baillie Gifford & Co. Has $683.65 Million Stock Holdings in Symbotic Inc. $SYM – MarketBeat (Jan 24, 2026)
- SYM stock closes at $63.51 on NASDAQ 23 Jan 2026: AI automation vs valuation – Meyka (Jan 24, 2026)
- Symbotic Inc. (NASDAQ:SYM) About To Shift From Loss To Profit – Yahoo Finance (Jan 11, 2026)
For more information about Symbotic Inc., please visit the official website: symbotic.com