Home > Analyses > Healthcare > Stryker Corporation
Stryker revolutionizes patient care with cutting-edge medical devices that transform surgeries and recovery worldwide. It leads the healthcare technology sector through innovative implants and advanced surgical equipment, setting benchmarks in orthopaedics and neurotechnology. Known for quality and precision, Stryker shapes medical outcomes and hospital efficiencies alike. As the healthcare landscape evolves, I examine whether its robust fundamentals continue to support compelling growth and justify its premium valuation in 2026.

Table of contents
Business Model & Company Overview
Stryker Corporation, founded in 1941 and headquartered in Kalamazoo, Michigan, stands as a leader in the medical devices sector. It operates through two core segments—MedSurg and Neurotechnology, and Orthopaedics and Spine—creating an integrated ecosystem of surgical equipment, implants, and advanced neurotechnology products. This broad portfolio targets diverse medical specialties, positioning Stryker as a key partner for healthcare providers worldwide.
The company’s revenue engine balances durable implants, surgical tools, and cutting-edge neurotechnology, supported by a global footprint across 75 countries spanning the Americas, Europe, and Asia. Sales flow through both direct subsidiaries and third-party distributors, ensuring broad market penetration. Stryker’s competitive advantage lies in its innovation-driven product mix and expansive distribution, cementing its role as a durable force shaping the future of medical technology.
Financial Performance & Fundamental Metrics
I analyze Stryker Corporation’s income statement, key financial ratios, and dividend payout policy to assess its profitability, efficiency, and shareholder returns.
Income Statement
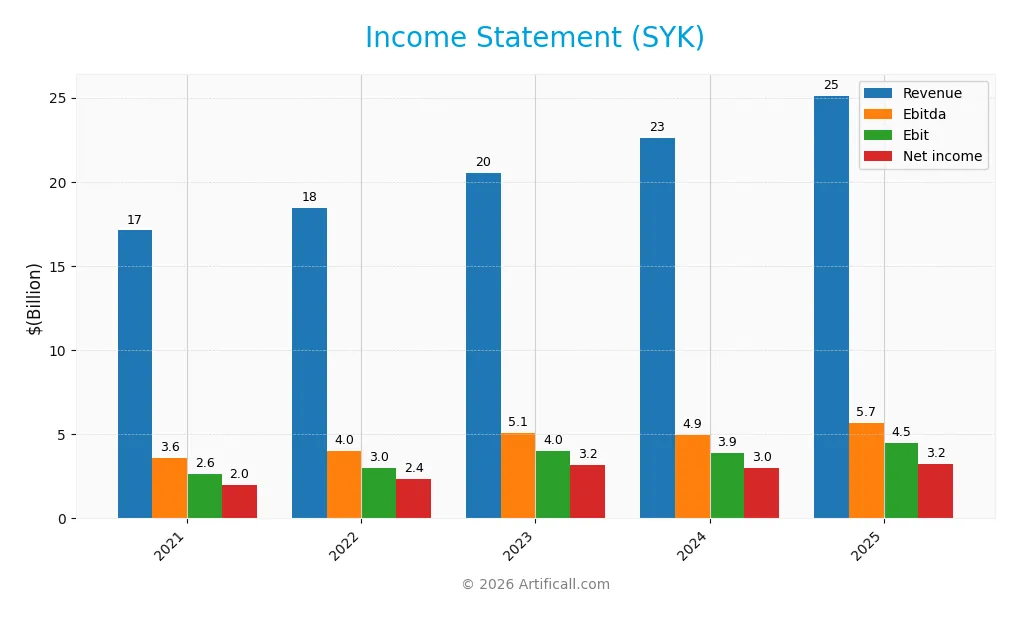
Below is Stryker Corporation’s income statement for the fiscal years 2021 through 2025, showing key profitability and expense metrics.
| 2021 | 2022 | 2023 | 2024 | 2025 | |
|---|---|---|---|---|---|
| Revenue | 17.1B | 18.4B | 20.5B | 22.6B | 25.1B |
| Cost of Revenue | 6.4B | 7.4B | 8.0B | 8.6B | 9.7B |
| Operating Expenses | 6.9B | 7.3B | 8.2B | 8.9B | 9.8B |
| Gross Profit | 10.7B | 11.0B | 12.5B | 14.0B | 15.4B |
| EBITDA | 3.6B | 4.0B | 5.1B | 4.9B | 5.7B |
| EBIT | 2.6B | 3.0B | 4.0B | 3.9B | 4.5B |
| Interest Expense | 337M | 337M | 356M | 396M | 0 |
| Net Income | 2.0B | 2.4B | 3.2B | 3.0B | 3.2B |
| EPS | 5.29 | 6.23 | 8.34 | 7.86 | 8.49 |
| Filing Date | 2022-02-11 | 2023-02-10 | 2024-02-14 | 2025-02-12 | 2026-02-11 |
Income Statement Evolution
Stryker’s revenue rose from 17.1B in 2021 to 25.1B in 2025, marking a 47% increase. Net income climbed 63% to 3.25B, reflecting margin expansion. The gross margin improved steadily, stabilizing above 61%, while EBIT margin advanced to nearly 18%, signaling better operational efficiency over the period.
Is the Income Statement Favorable?
The 2025 income statement shows robust fundamentals. Revenue grew 11% year-over-year, and EBIT increased 16%, outperforming revenue growth. Gross margin at 61.4% and net margin near 13% remain favorable. Despite a slight 2.4% dip in net margin growth last year, the overall income quality and EPS growth of 8.3% suggest a solid earnings base.
Financial Ratios
The following table presents key financial ratios for Stryker Corporation (SYK) over the past five fiscal years, illustrating its profitability, valuation, liquidity, leverage, efficiency, and dividend metrics:
| Ratios | 2021 | 2022 | 2023 | 2024 | 2025 |
|---|---|---|---|---|---|
| Net Margin | 12% | 13% | 15% | 13% | 13% |
| ROE | 13% | 14% | 17% | 15% | 14% |
| ROIC | 11% | 10% | 11% | 12% | 10% |
| P/E | 51 | 39 | 36 | 46 | 41 |
| P/B | 6.8 | 5.6 | 6.1 | 6.6 | 6.0 |
| Current Ratio | 2.20 | 1.63 | 1.58 | 1.95 | 1.89 |
| Quick Ratio | 1.47 | 1.00 | 0.97 | 1.32 | 1.21 |
| D/E | 0.87 | 0.81 | 0.73 | 0.68 | 0.66 |
| Debt-to-Assets | 37% | 37% | 34% | 33% | 31% |
| Interest Coverage | 11.2 | 11.1 | 12.0 | 12.8 | 0* |
| Asset Turnover | 0.49 | 0.50 | 0.51 | 0.53 | 0.52 |
| Fixed Asset Turnover | 5.3 | 5.4 | 5.5 | 5.7 | 6.5 |
| Dividend Yield | 0.94% | 1.14% | 1.00% | 0.89% | 0.96% |
*Interest Coverage for 2025 is reported as zero and may warrant caution.
Evolution of Financial Ratios
From 2021 to 2025, Stryker’s Return on Equity (ROE) showed moderate stability around 13.4% to 17%, ending at 14.5%. The Current Ratio improved from 2.20 to about 1.89, indicating stable liquidity. The Debt-to-Equity ratio decreased from 0.87 to 0.66, reflecting a modest deleveraging trend. Profitability remained steady with net margins near 13%.
Are the Financial Ratios Fovorable?
In 2025, profitability metrics like net margin (12.9%) and ROIC (10.1%) appear favorable, outperforming the weighted average cost of capital at 7.3%. Liquidity ratios are strong, with a current ratio of 1.89 and quick ratio of 1.21. Leverage is neutral, with a debt-to-equity of 0.66. However, valuation multiples such as P/E (41.4) and P/B (6.0) are unfavorable. Overall, ratios suggest a slightly favorable financial position.
Shareholder Return Policy
Stryker Corporation maintains a consistent dividend payout ratio near 40%, with dividends per share rising from $2.52 in 2021 to $3.36 in 2025. The dividend yield hovers around 0.9% to 1.1%, supported by free cash flow coverage exceeding 80%, indicating disciplined distribution policies.
The company also engages in share buybacks, complementing dividends to return capital. This balanced approach appears sustainable, as dividend and buyback funding aligns with cash flow generation, supporting long-term shareholder value without risking over-distribution or excessive leverage.
Score analysis
The following radar chart presents an overview of Stryker Corporation’s key financial scores across valuation, profitability, and leverage metrics:
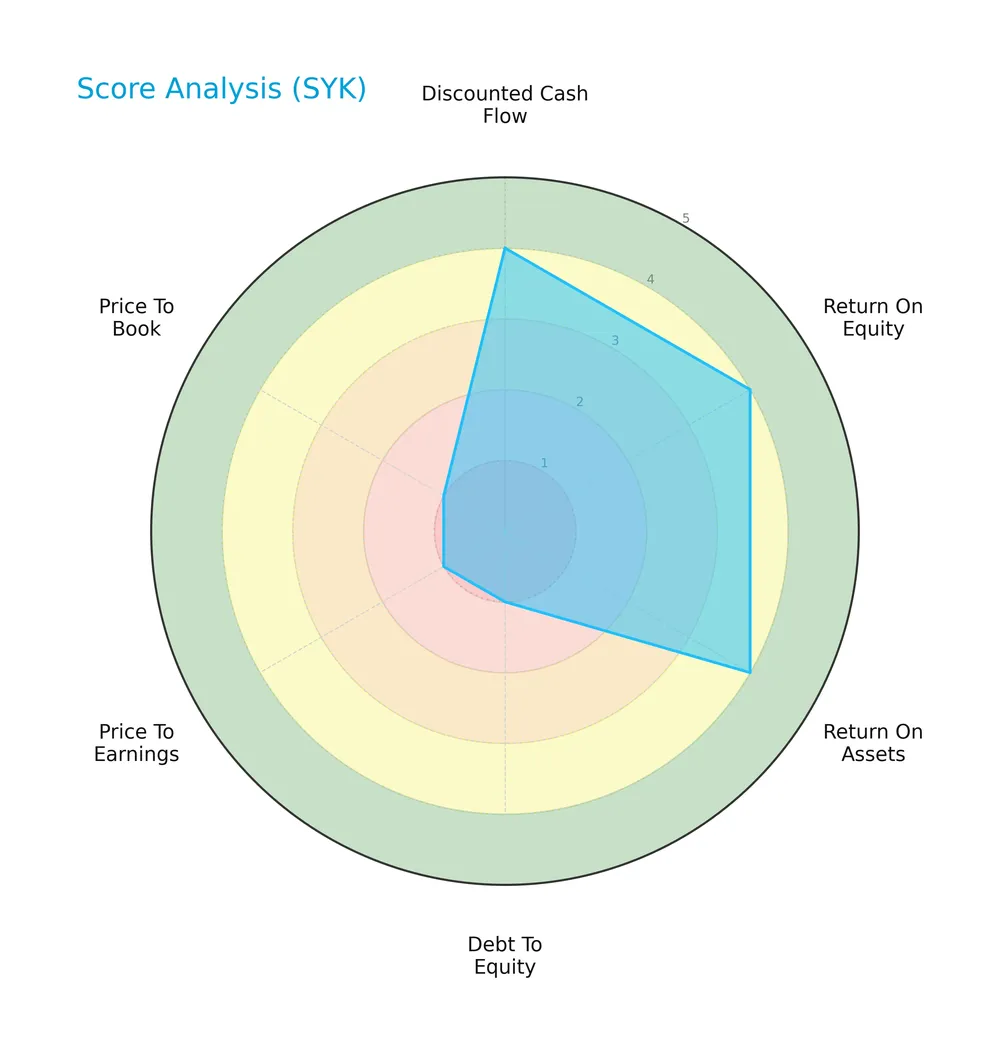
Stryker scores well on discounted cash flow, return on equity, and return on assets, all rated favorable at 4. However, its debt-to-equity, price-to-earnings, and price-to-book scores are very unfavorable at 1, indicating valuation and leverage concerns.
Analysis of the company’s bankruptcy risk
Stryker’s Altman Z-Score places the company solidly in the safe zone, suggesting low bankruptcy risk:

Is the company in good financial health?
The Piotroski Score chart summarizes Stryker’s financial health based on nine performance factors:

With a Piotroski Score of 5, Stryker’s financial strength is average, indicating moderate operational and profitability performance without strong value signals.
Competitive Landscape & Sector Positioning
This section analyzes Stryker Corporation’s strategic position within the medical devices sector, focusing on its revenue segments and key products. I will assess main competitors and identify any competitive advantages Stryker holds. The analysis also includes a detailed SWOT overview to clarify strengths and risks.
Strategic Positioning
Stryker Corporation maintains a diversified portfolio spanning MedSurg and Orthopaedics segments, with 2025 revenues of $15.6B and $9.5B respectively. Its geographic reach extends across approximately 75 countries, with significant sales in the US ($16.9B), EMEA ($3.2B), and Asia Pacific ($2.2B).
Revenue by Segment
The pie chart illustrates Stryker Corporation’s revenue breakdown by segment for the fiscal year 2025, highlighting the contributions of MedSurg and Orthopaedics.
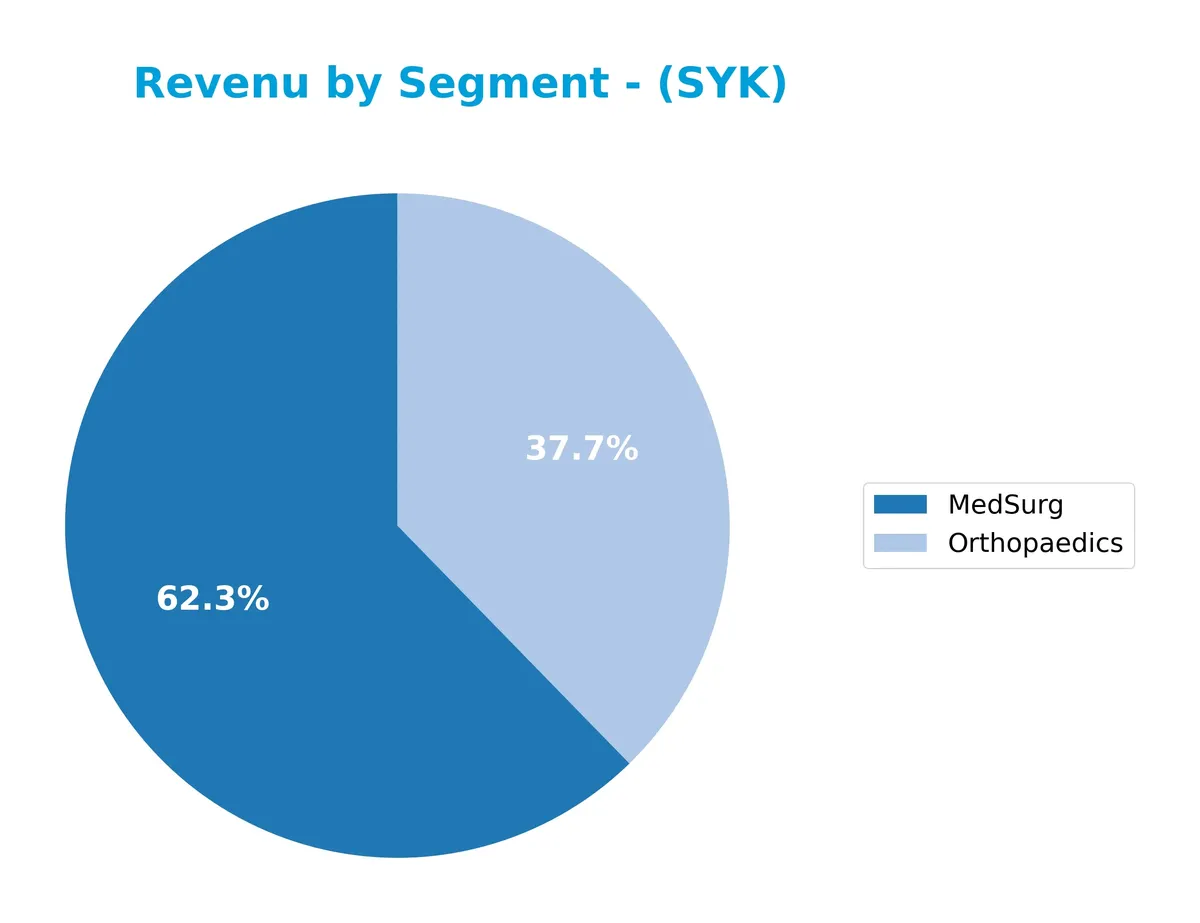
MedSurg leads with $15.6B in revenue, reflecting robust growth and a significant share of Stryker’s business. Orthopaedics follows at $9.5B, showing steady expansion. The shift from the combined “Orthopaedics and Spine” to distinct segments indicates strategic clarity. The 2025 acceleration in MedSurg outpaces Orthopaedics, signaling a concentration in higher-margin surgical solutions.
Key Products & Brands
Stryker Corporation’s main products and brands span two segments, reflecting diverse medical technology applications:
| Product | Description |
|---|---|
| MedSurg | Surgical equipment, navigation systems, endoscopic and communications systems, patient handling, emergency and intensive care products. |
| Neurotechnology | Products for minimally invasive endovascular techniques, brain and skull surgeries, orthobiologics, vertebral augmentation, cranial devices. |
| Orthopaedics and Spine | Implants for hip, knee, trauma, extremities surgeries; spinal implants treating injury, deformity, and degenerative conditions. |
Stryker’s portfolio integrates advanced surgical and implant technologies. MedSurg leads in surgical tools and patient care devices. Orthopaedics and Spine focus on durable implants, while Neurotechnology targets neurological and craniofacial interventions. This diversified product mix supports steady revenue growth.
Main Competitors
The sector includes 10 main competitors; the table below lists the top 10 leaders by market capitalization:
| Competitor | Market Cap. |
|---|---|
| Abbott Laboratories | 216B |
| Boston Scientific Corporation | 140B |
| Stryker Corporation | 133B |
| Medtronic plc | 123B |
| Edwards Lifesciences Corporation | 50B |
| DexCom, Inc. | 26B |
| STERIS plc | 25B |
| Insulet Corporation | 20B |
| Zimmer Biomet Holdings, Inc. | 18B |
| Align Technology, Inc. | 11B |
Stryker Corporation ranks 3rd among its competitors with a market cap at 66.8% of the leader, Abbott Laboratories. It sits above both the average market cap of the top 10 (76B) and the sector median (38B). The company is closely positioned within 2.77% of Boston Scientific, its nearest rival above.
Comparisons with competitors
Check out how we compare the company to its competitors:
Does Stryker Corporation have a competitive advantage?
Stryker Corporation presents a competitive advantage with a ROIC exceeding its WACC by 2.78%, indicating value creation despite a recent decline in profitability. Its solid gross margin of 61.44% and favorable revenue growth reinforce this position.
Looking ahead, Stryker’s diverse product portfolio across MedSurg, Neurotechnology, Orthopaedics, and Spine segments supports expansion into new medical markets. Continued innovation in surgical equipment and implant technologies offers promising growth opportunities globally.
SWOT Analysis
This analysis highlights Stryker Corporation’s strategic position by examining its internal strengths and weaknesses alongside external opportunities and threats.
Strengths
- strong market position in medical devices
- diverse product portfolio across MedSurg and Orthopaedics
- solid profitability with 61.4% gross margin
Weaknesses
- high valuation metrics with PE of 41.4 and PB of 6.0
- declining ROIC trend despite value creation
- moderate debt levels (D/E 0.66)
Opportunities
- expanding presence in Asia Pacific and EMEA markets
- innovation in neurotechnology and minimally invasive products
- growing global demand for orthopedic implants
Threats
- intense competition in medical device industry
- regulatory risks and reimbursement pressures
- supply chain disruptions affecting production costs
Stryker’s solid fundamentals and global footprint support growth, but investors must watch valuation and profitability trends. The company should leverage innovation to mitigate competitive and regulatory risks.
Stock Price Action Analysis
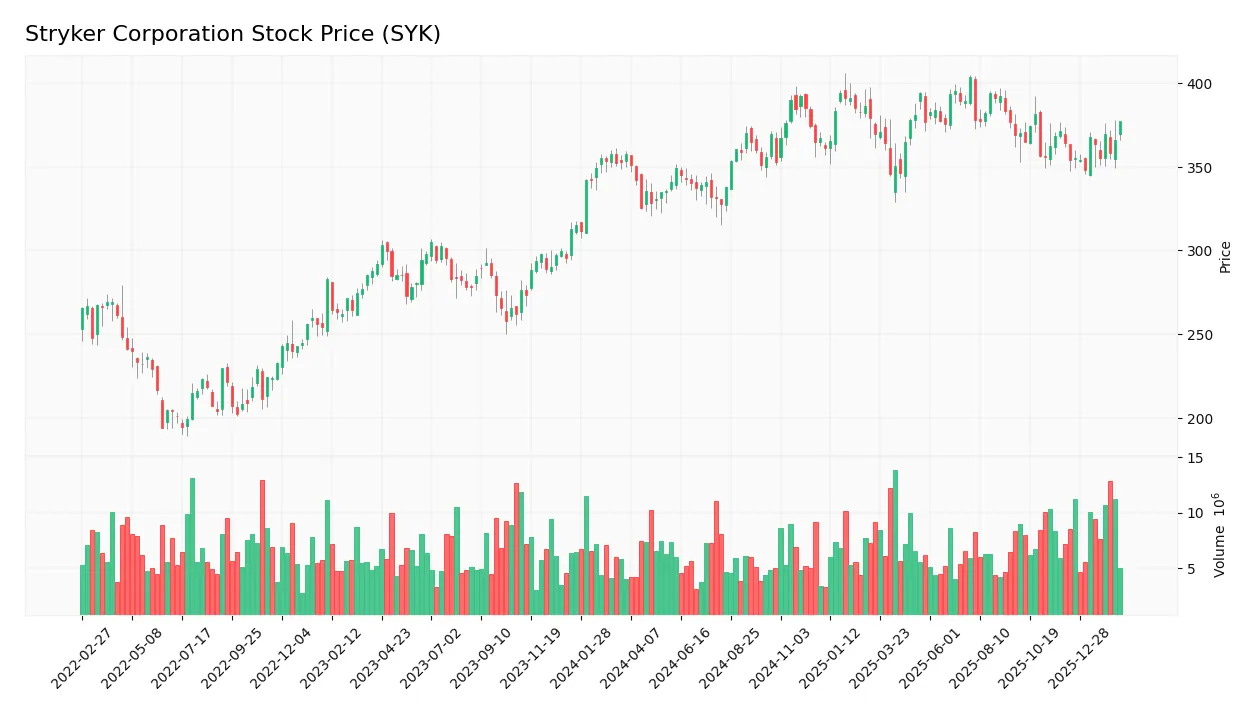
The weekly stock chart below illustrates Stryker Corporation’s price movements and volatility over the past 100 weeks:
Trend Analysis
Over the past 12 months, the stock price increased 5.43%, indicating a bullish trend with acceleration. The price ranged from a low of 325.43 to a high of 403.53, reflecting substantial volatility with an 18.95 standard deviation. Recent months show continued positive momentum with a 3.65% gain.
Volume Analysis
Total volume rose, with buyer volume at 423M (52.84%) outpacing sellers overall, signaling buyer-driven momentum. However, in the recent 12-week period, sellers slightly dominated at 53.67%, suggesting cautious sentiment and potential profit-taking despite rising overall market participation.
Target Prices
Analysts set a firm target consensus for Stryker Corporation, reflecting confidence in its growth prospects.
| Target Low | Target High | Consensus |
|---|---|---|
| 390 | 469 | 425.58 |
The target range spans from 390 to 469, with a consensus near 426, indicating moderate upside potential aligned with sector trends.

Don’t Let Luck Decide Your Entry Point
Optimize your entry points with our advanced ProRealTime indicators. You’ll get efficient buy signals with precise price targets for maximum performance. Start outperforming now!
Analyst & Consumer Opinions
This section examines recent analyst grades and consumer feedback regarding Stryker Corporation’s market performance and product reception.
Stock Grades
The latest verified analyst grades for Stryker Corporation reveal consistent positive sentiment from major firms:
| Grading Company | Action | New Grade | Date |
|---|---|---|---|
| BTIG | Maintain | Buy | 2026-01-30 |
| Needham | Maintain | Buy | 2026-01-30 |
| Bernstein | Maintain | Outperform | 2026-01-09 |
| Citizens | Upgrade | Market Outperform | 2025-12-19 |
| Truist Securities | Maintain | Hold | 2025-12-18 |
| Citigroup | Maintain | Buy | 2025-12-11 |
| Truist Securities | Maintain | Hold | 2025-11-14 |
| Needham | Maintain | Buy | 2025-11-14 |
| BTIG | Maintain | Buy | 2025-11-14 |
| Wells Fargo | Maintain | Overweight | 2025-11-14 |
Most analysts maintain a Buy or stronger rating, with few Holds and no Sell opinions. The consensus clearly favors Stryker, reflecting steady confidence across the industry.
Consumer Opinions
Stryker Corporation consistently earns praise for its innovative medical devices but faces some criticism on pricing and customer service responsiveness.
| Positive Reviews | Negative Reviews |
|---|---|
| “Products are reliable and improve patient outcomes significantly.” | “Customer support is slow to respond during urgent issues.” |
| “Strong focus on innovation keeps Stryker ahead in medical technology.” | “Pricing feels high compared to competitors, impacting smaller clinics.” |
| “Easy-to-use equipment enhances workflow efficiency in hospitals.” | “Occasional delays in product delivery disrupt schedules.” |
Overall, consumers appreciate Stryker’s cutting-edge products and reliability. However, recurring concerns about service delays and premium pricing suggest room for operational improvements.
Risk Analysis
Below is a detailed table presenting key risks facing Stryker Corporation, highlighting their likelihood and potential impact:
| Category | Description | Probability | Impact |
|---|---|---|---|
| Valuation Risk | Elevated P/E of 41.38 and P/B of 5.99 suggest the stock may be overvalued relative to peers. | High | High |
| Debt Risk | Debt-to-equity ratio stands at 0.66; manageable but debt-to-assets at 31% warrants monitoring. | Medium | Medium |
| Market Volatility | Beta of 0.869 indicates less volatility than market but still vulnerable to healthcare sector swings. | Medium | Medium |
| Dividend Risk | Low dividend yield of 0.96% may disappoint income-focused investors amid market uncertainty. | Low | Low |
| Operational Risk | Dependence on innovation and regulatory approvals in medical devices could disrupt growth. | Medium | High |
Stryker’s valuation risk is the most pressing given its high multiples compared to industry averages. Despite strong profitability and a safe Altman Z-score of 4.43, market expectations are elevated. Operational risks remain significant due to the sector’s reliance on innovation and regulatory hurdles. Prudence dictates watching valuation closely while appreciating the company’s solid financial foundation.
Should You Buy Stryker Corporation?
Stryker appears to be a company with solid operational efficiency and value creation, supported by a slightly favorable moat despite declining profitability. Its leverage profile suggests caution, reflected in a moderate overall rating of B-, indicating balanced strengths and risks.
Strength & Efficiency Pillars
Stryker Corporation demonstrates solid operational efficiency with a robust gross margin of 61.44% and a favorable EBIT margin at 17.91%. The company’s return on invested capital (ROIC) stands at 10.1%, comfortably above its weighted average cost of capital (WACC) of 7.32%, confirming Stryker as a clear value creator. While return on equity is moderate at 14.48%, the firm maintains strong profitability and effective asset utilization, supported by a fixed asset turnover of 6.48. These metrics reflect disciplined capital allocation and resilient earnings generation.
Weaknesses and Drawbacks
Stryker faces headwinds from an elevated valuation, with a price-to-earnings ratio of 41.38 and price-to-book ratio of 5.99, both flagged as unfavorable. Such premium multiples heighten vulnerability to market corrections and reduce margin for valuation error. Additionally, the company’s dividend yield is low at 0.96%, which may disappoint income-focused investors. Leverage remains moderate with a debt-to-equity ratio of 0.66 and a healthy current ratio of 1.89, but these metrics warrant monitoring if interest rates rise or operational cash flow weakens.
Our Final Verdict about Stryker Corporation
Stryker’s fundamental profile appears attractive for long-term exposure given its value creation and overall bullish trend. However, recent slightly seller-dominant market behavior advises a cautious stance. Despite solid operational metrics and improving volume dynamics, investors might consider waiting for a more favorable entry point amid current valuation pressures. The company’s moderate Piotroski score of 5 suggests average financial strength, underscoring the need for ongoing scrutiny.
Disclaimer: This content is for informational purposes only and does not constitute financial, investment, or other professional advice. Investing in financial markets involves a significant risk of loss, and past performance is not indicative of future results.
Additional Resources
- Stryker Corporation $SYK Stake Trimmed by 626 Financial LLC – MarketBeat (Feb 18, 2026)
- Stryker Corp (SYK) Q4 2025 Earnings Call Highlights: Record Revenue and Robust Growth Amid … – Yahoo Finance (Jan 29, 2026)
- Aberdeen Group plc Reduces Holdings in Stryker Corporation $SYK – MarketBeat (Feb 15, 2026)
- Piper Sandler Maintains Overweight Rating on Stryker Corporation (SYK) – Yahoo Finance (Jan 30, 2026)
- Skandinaviska Enskilda Banken AB publ Sells 3,223 Shares of Stryker Corporation $SYK – MarketBeat (Feb 17, 2026)
For more information about Stryker Corporation, please visit the official website: stryker.com