Home > Analyses > Technology > Strategy Inc
Strategy Inc transforms how enterprises harness data and digital assets, reshaping decision-making in a volatile market. It leads with AI-powered analytics software and a pioneering bitcoin treasury strategy, blending innovation with financial sophistication. Known for its robust technology and market influence, Strategy Inc commands attention in software and cryptocurrency circles alike. As 2026 unfolds, I question whether its complex fundamentals continue to justify its premium valuation and ambitious growth prospects.

Table of contents
Business Model & Company Overview
Strategy Inc, founded in 1989 and headquartered in Tysons Corner, Virginia, commands a dominant position in the software application industry. Formerly MicroStrategy Incorporated, it rebranded in 2025 to reflect its evolving mission. The company integrates bitcoin treasury management with AI-powered enterprise analytics, creating a seamless ecosystem that serves diverse global clients. Its flagship products, Strategy One and Strategy Mosaic, empower non-technical users and enterprises with novel insights and unified data governance, reinforcing its competitive edge.
The company’s revenue engine balances bitcoin-related securities offerings with advanced software solutions. It provides investors economic exposure through equity and fixed income instruments while driving recurring revenues via AI enterprise software. Strategy Inc’s footprint spans the Americas, Europe, the Middle East, and Africa, positioning it strategically in key markets. Its robust economic moat lies in combining digital asset management with cutting-edge analytics, setting industry standards and shaping the future of enterprise intelligence.
Financial Performance & Fundamental Metrics
I analyze Strategy Inc’s income statement, key financial ratios, and dividend payout policy to provide a clear view of its financial health and sustainability.
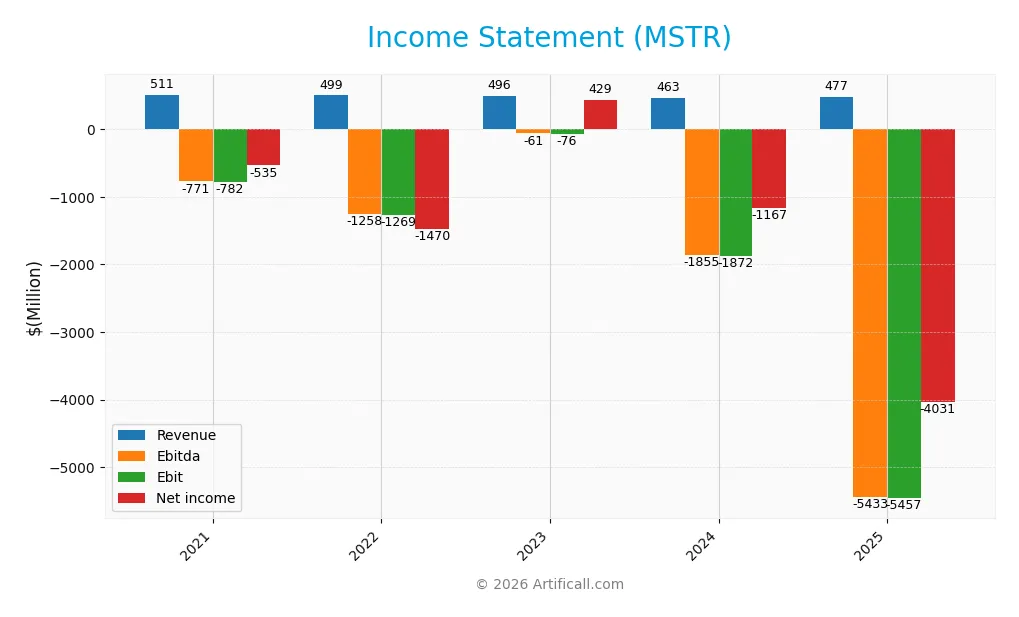
Income Statement
This table summarizes Strategy Inc’s key income statement items over the past five fiscal years, showing trends in profitability and expenses.
| 2021 | 2022 | 2023 | 2024 | 2025 | |
|---|---|---|---|---|---|
| Revenue | 511M | 499M | 496M | 463M | 477M |
| Cost of Revenue | 92M | 103M | 110M | 129M | 149M |
| Operating Expenses | 1.20B | 1.67B | 501M | 2.19B | 5.77B |
| Gross Profit | 419M | 396M | 386M | 334M | 328M |
| EBITDA | -771M | -1.26B | -61M | -1.85B | -5.43B |
| EBIT | -782M | -1.27B | -76M | -1.87B | -5.46B |
| Interest Expense | 29M | 53M | 49M | 62M | 65M |
| Net Income | -535M | -1.47B | 429M | -1.17B | -4.03B |
| EPS | -5.34 | -12.98 | 3.14 | -6.06 | -13.89 |
| Filing Date | 2022-02-16 | 2023-02-16 | 2024-02-15 | 2025-02-18 | 2026-02-19 |
Income Statement Evolution
From 2021 to 2025, Strategy Inc’s revenue declined by 6.56%, while net income plummeted by 653%. Gross margin remained relatively stable at 68.7%, indicating consistent core profitability. However, operating expenses and interest costs grew, squeezing EBIT and net margins sharply into negative territory.
Is the Income Statement Favorable?
In 2025, fundamentals appear unfavorable. Despite a slight revenue increase of 3%, net income fell steeply to -4.0B USD and net margin dived to -845%. EBIT margin worsened to -1144%, driven by soaring operating expenses and interest costs at 13.6% of revenue. This reflects significant profitability and capital structure challenges.
Financial Ratios
The table below summarizes key financial ratios for Strategy Inc (MSTR) over the last five fiscal years, providing a snapshot of profitability, liquidity, leverage, and efficiency metrics:
| Ratios | 2021 | 2022 | 2023 | 2024 | 2025 |
|---|---|---|---|---|---|
| Net Margin | -1.05% | -2.94% | 0.86% | -2.52% | -8.45% |
| ROE | -54.7% | 383.6% | 19.8% | -6.40% | -7.90% |
| ROIC | -15.95% | -60.94% | 8.91% | -4.38% | -6.19% |
| P/E | -10.19 | -1.09 | 20.12 | -47.80 | -11.08 |
| P/B | 5.57 | -4.18 | 3.99 | 3.06 | 0.88 |
| Current Ratio | 0.86 | 0.83 | 0.83 | 0.71 | 5.62 |
| Quick Ratio | 0.86 | 0.83 | 0.83 | 0.71 | 5.62 |
| D/E | 2.28 | -6.39 | 1.04 | 0.40 | 0.16 |
| Debt-to-Assets | 62.7% | 101.5% | 47.3% | 28.1% | 13.4% |
| Interest Coverage | -26.9 | -24.0 | -2.35 | -29.9 | -83.8 |
| Asset Turnover | 0.14 | 0.21 | 0.10 | 0.02 | 0.0077 |
| Fixed Asset Turnover | 4.94 | 5.33 | 5.75 | 5.73 | 6.29 |
| Dividend Yield | 0% | 0% | 0% | 0% | 0% |
Evolution of Financial Ratios
Return on Equity (ROE) declined from positive in 2023 to -7.9% in 2025, signaling deteriorating profitability. The Current Ratio surged sharply to 5.62 in 2025 from below 1 in previous years, indicating increased liquidity but potential inefficiency. The Debt-to-Equity Ratio improved, falling to 0.16 by 2025, reflecting reduced leverage.
Are the Financial Ratios Favorable?
Profitability ratios such as net margin (-844.76%) and ROE (-7.9%) remain unfavorable, reflecting persistent losses. Liquidity shows mixed signals: a high Current Ratio (5.62) flags inefficiency, but the Quick Ratio is favorable. Leverage metrics are generally favorable, with low debt ratios. Asset turnover is weak, and market valuation ratios like PE and PB appear favorable. Overall, the financial ratios lean toward an unfavorable assessment.
Shareholder Return Policy
Strategy Inc (MSTR) does not pay dividends, reflecting consistent net losses and negative free cash flow in recent years. The company appears to prioritize reinvestment and growth over shareholder distributions. Share buybacks are not reported.
This approach aligns with a focus on long-term value creation through reinvestment rather than immediate returns. However, persistent losses and cash flow deficits pose risks to sustainable capital allocation and shareholder value enhancement.
Score analysis
The following radar chart presents key financial scores evaluating the company’s valuation and profitability metrics:
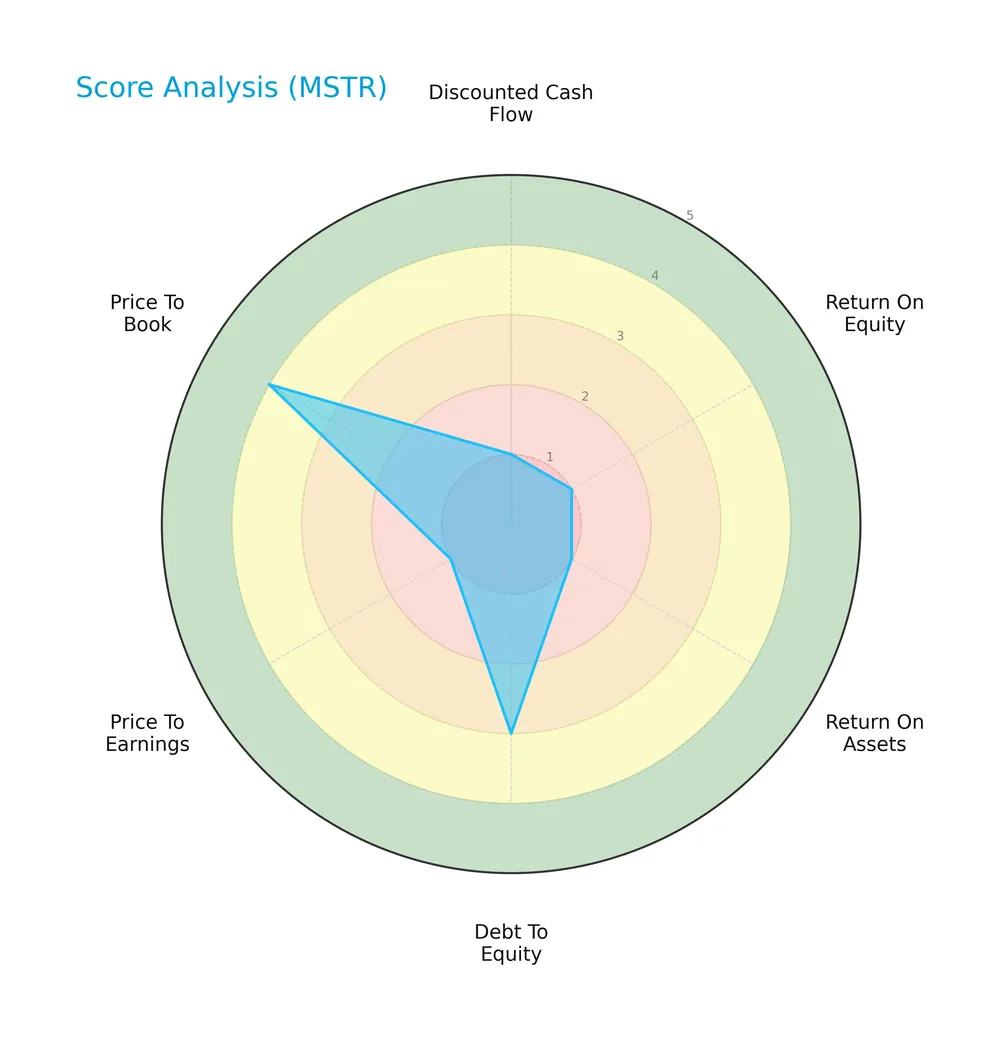
The company scores very low on discounted cash flow, ROE, ROA, and P/E ratios, indicating weak profitability and valuation. Debt-to-equity shows moderate leverage control, while price-to-book is relatively favorable.
Analysis of the company’s bankruptcy risk
The Altman Z-Score places the company in the grey zone, indicating a moderate risk of bankruptcy and financial instability:

Is the company in good financial health?
This Piotroski diagram highlights the company’s weak financial health based on profitability, efficiency, and leverage criteria:

With a Piotroski Score of 2, the company shows very weak fundamentals, suggesting poor financial strength and potential investment risks.
Competitive Landscape & Sector Positioning
This section reviews Strategy Inc’s strategic positioning, revenue by segment, key products, main competitors, and competitive advantages. I will assess whether Strategy Inc holds a sustainable edge over its rivals.
Strategic Positioning
Strategy Inc operates globally, with significant revenue from North America (272M) and EMEA (163M) in 2025. It combines concentrated exposure to bitcoin treasury activities with diversified AI-powered enterprise analytics software, balancing cryptocurrency and technology sector risks across multiple regions.
Revenue by Segment
The pie chart illustrates Strategy Inc’s revenue distribution by segment for fiscal year 2025, highlighting how each division contributes to the company’s top line.
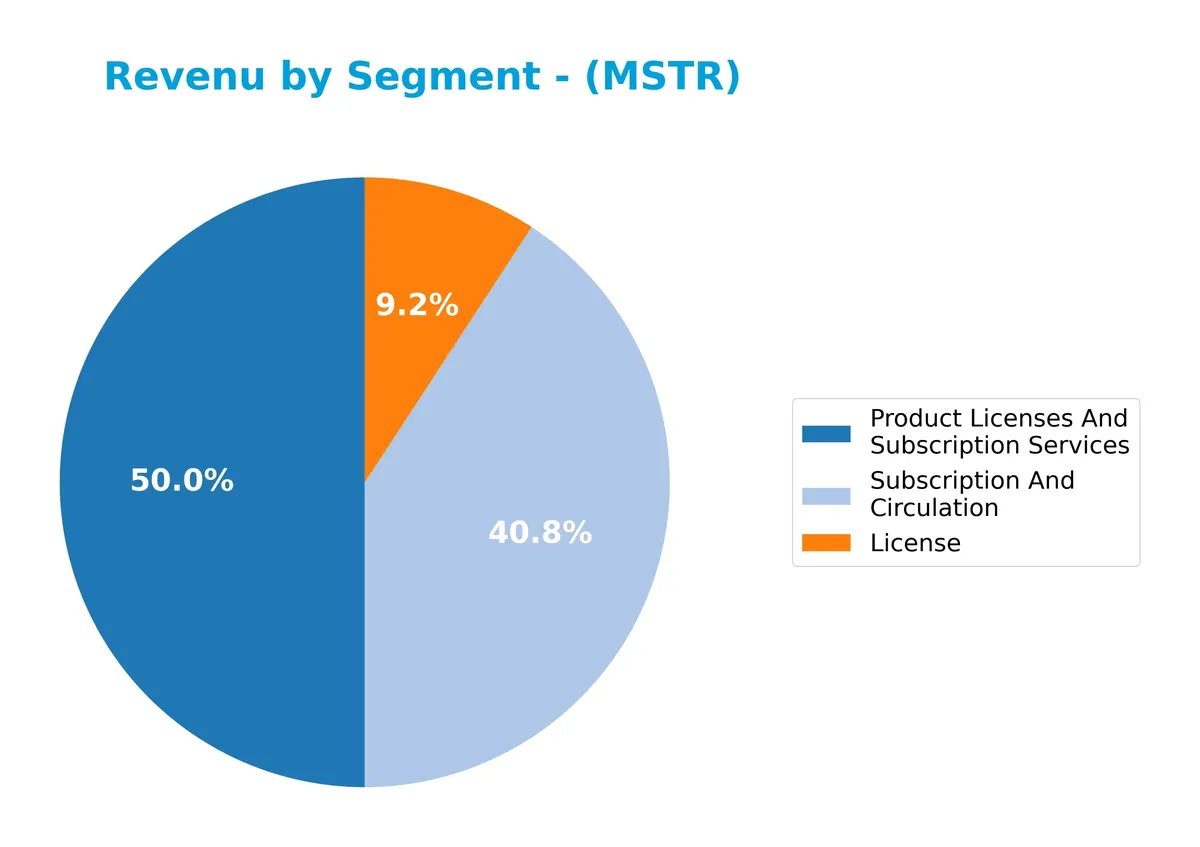
In 2025, the “Product Licenses And Subscription Services” segment leads with $215M, followed by “Subscription And Circulation” at $176M. The “License” segment has shrunk significantly to $40M, indicating a strategic shift from traditional licenses to subscription models. This evolution reflects the company’s adaptation to recurring revenue streams, reducing concentration risk while accelerating growth in service-based offerings.
Key Products & Brands
The company’s key products and brands span software licenses, subscriptions, and services, detailed as follows:
| Product | Description |
|---|---|
| Strategy One | AI-powered enterprise analytics software enabling non-technical users to access actionable insights. |
| Strategy Mosaic | Universal intelligence layer providing consistent data governance across diverse sources and tools. |
| License | Software licenses generating recurring revenue through product access rights. |
| Product Licenses And Subscription Services | Combined revenue from software licenses and subscription-based services. |
| Subscription And Circulation | Income from subscription models and circulation-based offerings. |
| Maintenance | Revenue from ongoing software support and updates. |
| Technology Service | Services related to technology implementation and support. |
Strategy Inc’s product mix includes AI-driven analytics platforms alongside traditional software licenses and subscription services. This blend reflects a transition towards recurring revenue with an emphasis on enterprise intelligence solutions.
Main Competitors
There are 33 competitors in total. The table below lists the top 10 leaders by market capitalization:
| Competitor | Market Cap. |
|---|---|
| Salesforce, Inc. | 242B |
| Shopify Inc. | 210B |
| AppLovin Corporation | 209B |
| Intuit Inc. | 175B |
| Uber Technologies, Inc. | 172B |
| ServiceNow, Inc. | 153B |
| Cadence Design Systems, Inc. | 84.5B |
| Snowflake Inc. | 73.4B |
| Autodesk, Inc. | 61.2B |
| Workday, Inc. | 54.9B |
Strategy Inc ranks 12th among 33 competitors, holding about 15% of the market cap of the sector leader, Salesforce. It sits below the average market cap of the top 10 competitors (143B) but remains above the sector median (18.8B). The company enjoys a 28.9% market cap premium over its closest rival above.
Comparisons with competitors
Check out how we compare the company to its competitors:
Does Strategy Inc have a competitive advantage?
Strategy Inc currently lacks a clear competitive advantage, as its return on invested capital (ROIC) is significantly below its weighted average cost of capital (WACC), indicating value destruction. Despite this, the company shows a growing ROIC trend, suggesting improving profitability.
Looking forward, Strategy Inc’s diversification into AI-powered enterprise analytics software and its international bitcoin treasury operations present potential growth opportunities. Expansion in new markets and innovative product offerings could enhance its competitive positioning over time.
SWOT Analysis
This SWOT analysis highlights Strategy Inc’s core business strengths, weaknesses, growth opportunities, and risks to guide strategic positioning.
Strengths
- Strong market cap at $36.4B
- High gross margin of 68.7%
- Robust geographic diversification
Weaknesses
- Negative EBIT and net margins
- ROIC below WACC, indicating value destruction
- Weak profitability and earnings growth trends
Opportunities
- AI-powered analytics market expansion
- Increasing enterprise demand for data governance
- Growing Bitcoin treasury investor interest
Threats
- High volatility in Bitcoin markets
- Intense software industry competition
- Financial distress risk indicated by Altman Z-Score
Strategy Inc’s strengths in market presence and innovative analytics are offset by significant profitability challenges and financial risk. The company must leverage its AI capabilities and Bitcoin exposure carefully while addressing operational inefficiencies to restore value and investor confidence.
Stock Price Action Analysis
The weekly stock chart for Strategy Inc illustrates key price movements and volatility trends over the last 12 months:
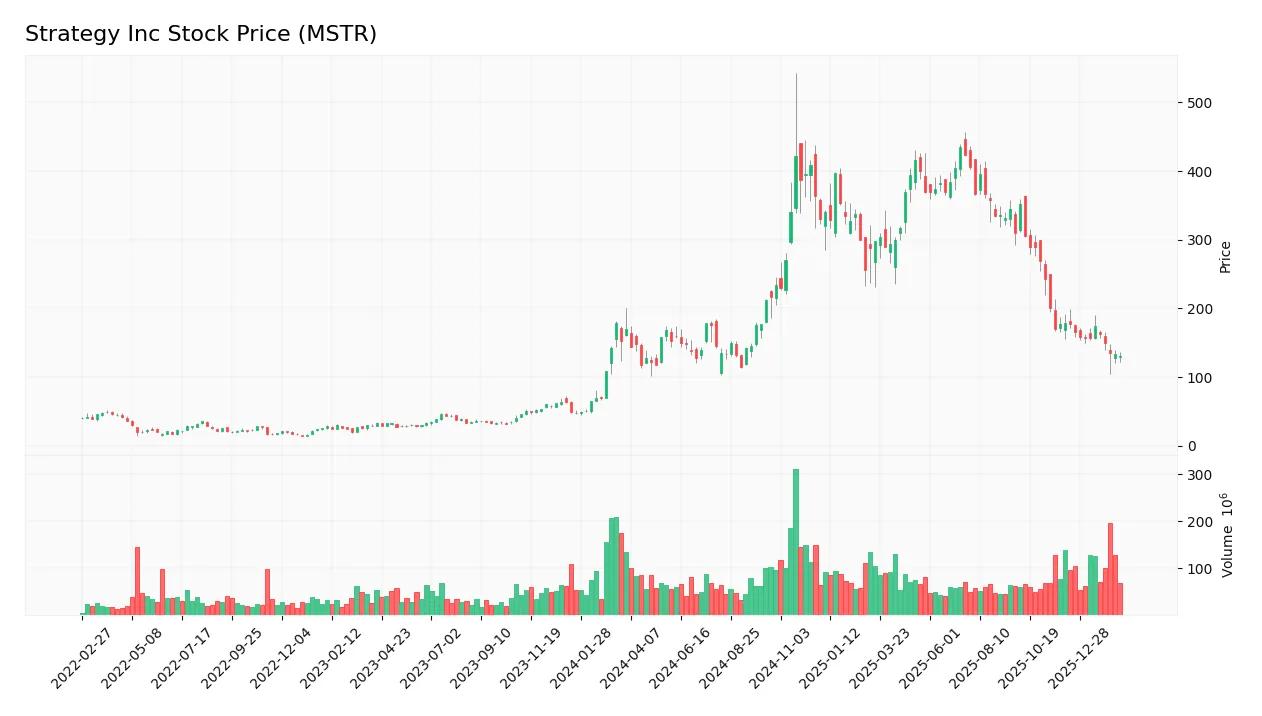
Trend Analysis
Over the past 12 months, Strategy Inc’s stock declined by 23.12%, indicating a bearish trend. The price dropped from a high of 434.58 to a low of 114.3, with volatility marked by a 102.03 standard deviation. The bearish trend shows deceleration, suggesting a slowing rate of decline.
Volume Analysis
In the last three months, trading volume increased but was seller-driven. Sellers accounted for 69.4% of activity, signaling strong selling pressure. This pattern reflects cautious or negative investor sentiment with heightened market participation skewed toward exits.
Target Prices
Analysts show a wide range of expectations for Strategy Inc, reflecting varying outlooks on its growth trajectory.
| Target Low | Target High | Consensus |
|---|---|---|
| 175 | 705 | 364.13 |
The target prices span from 175 to 705, with a consensus near 364, indicating cautious optimism mixed with significant uncertainty.

Don’t Let Luck Decide Your Entry Point
Optimize your entry points with our advanced ProRealTime indicators. You’ll get efficient buy signals with precise price targets for maximum performance. Start outperforming now!
Analyst & Consumer Opinions
This section examines recent analyst ratings and consumer feedback regarding Strategy Inc (MSTR) to gauge market sentiment.
Stock Grades
Here is the latest overview of Strategy Inc’s stock grades from established financial firms:
| Grading Company | Action | New Grade | Date |
|---|---|---|---|
| Mizuho | Maintain | Outperform | 2026-02-17 |
| Cantor Fitzgerald | Maintain | Overweight | 2026-02-09 |
| BTIG | Maintain | Buy | 2026-02-06 |
| Canaccord Genuity | Maintain | Buy | 2026-02-04 |
| Mizuho | Maintain | Outperform | 2026-01-16 |
| TD Cowen | Maintain | Buy | 2026-01-15 |
| Citigroup | Maintain | Buy | 2025-12-22 |
| Bernstein | Maintain | Outperform | 2025-12-08 |
| Monness, Crespi, Hardt | Upgrade | Neutral | 2025-11-10 |
| HC Wainwright & Co. | Maintain | Buy | 2025-11-03 |
The consensus from top-tier firms leans clearly toward a buy stance, with most maintaining positive ratings. Only one recent upgrade shifted from sell to neutral, indicating cautious optimism among analysts.
Consumer Opinions
Consumers express mixed feelings about Strategy Inc, reflecting both strong product appeal and notable service challenges.
| Positive Reviews | Negative Reviews |
|---|---|
| “The platform’s user interface is intuitive and fast.” | “Customer support response times are frustratingly slow.” |
| “Innovative features keep us ahead in data analytics.” | “Pricing is higher than competitors for similar services.” |
| “Reliable uptime ensures uninterrupted operations.” | “The learning curve is steep for new users.” |
Overall, consumers praise Strategy Inc’s innovation and reliability but frequently cite high costs and customer service delays as areas needing improvement.
Risk Analysis
Below is a summary of key risks affecting Strategy Inc’s financial and operational stability:
| Category | Description | Probability | Impact |
|---|---|---|---|
| Market Volatility | High beta (3.54) exposes stock to sharp price fluctuations. | High | High |
| Profitability | Negative net margin (-845%) signals deep operating losses. | High | High |
| Leverage | Low debt-to-equity (0.16) is favorable, but interest coverage is negative (-84). | Medium | Medium |
| Liquidity | Strong current ratio (5.62) contrasts with weak quick ratio signaling asset quality concerns. | Medium | Medium |
| Bankruptcy Risk | Altman Z-Score in grey zone (1.96) indicates moderate default risk. | Medium | High |
| Operational Efficiency | Extremely low asset turnover (0.01) suggests poor capital utilization. | High | Medium |
| Dividend Policy | No dividend yield reflects lack of shareholder cash returns. | High | Low |
The most pressing risks are the severe losses and high volatility driven by Strategy Inc’s bitcoin treasury exposure. Its Altman Z-Score near distress territory and very weak Piotroski score (2) warrant caution. Despite moderate leverage, poor profitability and asset use threaten long-term viability. Investors should weigh these factors carefully in volatile markets.
Should You Buy Strategy Inc?
Strategy Inc appears to be shedding value despite a growing ROIC trend, suggesting weak operational efficiency. Its leverage profile seems manageable, but profitability remains fragile. The overall rating stands at C, reflecting a cautious analytical interpretation amid mixed financial signals.
Strength & Efficiency Pillars
Strategy Inc shows operational resilience with a gross margin of 68.69%, signaling strong core profitability. However, the company’s return on invested capital (ROIC) stands at -6.19%, well below its weighted average cost of capital (WACC) at 17.12%, indicating value destruction rather than creation. The negative net margin of -844.76% and return on equity (ROE) of -7.9% highlight ongoing profitability challenges. Despite a growing ROIC trend of 61.18%, the firm struggles to generate sustainable returns above its capital costs.
Weaknesses and Drawbacks
Strategy Inc resides in the Altman Z-Score grey zone at 1.96, signaling moderate bankruptcy risk and financial vulnerability. The Piotroski score of 2 confirms very weak financial health. The company suffers from severe net losses, reflected in deeply negative margins and declining earnings. While its price-to-book ratio of 0.88 is favorable, valuation metrics remain mixed due to a negative P/E of -11.08, complicating traditional assessment. Market pressure intensifies with a recent seller dominance of 69.4%, heightening short-term downside risks.
Our Final Verdict about Strategy Inc
Despite some operational strengths, Strategy Inc’s solvency metrics place it in a cautious grey zone. The persistent value destruction and weak financial health make the stock highly speculative. Although a growing ROIC hints at potential turnaround, overall bearish technicals and seller dominance suggest investors might prefer a wait-and-see stance. This profile may appear suitable only for those willing to accept significant risk.
Disclaimer: This content is for informational purposes only and does not constitute financial, investment, or other professional advice. Investing in financial markets involves a significant risk of loss, and past performance is not indicative of future results.
Additional Resources
- Strategy Inc. (MSTR): The 717,000 Bitcoin Treasury Story In 2026 | 2-Minute Analysis – Seeking Alpha (Feb 20, 2026)
- Strategy Inc. (MSTR) Bolsters Bitcoin Holdings after Shares Sale – Yahoo Finance (Jan 31, 2026)
- Strategy ($MSTR) Spends $168 Million On More Bitcoin – Bitcoin Magazine (Feb 17, 2026)
- Strategy (MSTR) news: company added 2,486 bitcoin last week – CoinDesk (Feb 17, 2026)
- MSTR Has Lost 62% in a Year and Bitcoin Is Still Below Its Buy Price – 24/7 Wall St. (Feb 19, 2026)
For more information about Strategy Inc, please visit the official website: strategy.com