Home > Analyses > Technology > StoneCo Ltd.
StoneCo Ltd. revolutionizes how small and medium businesses in Brazil accept payments, empowering millions of merchants with seamless electronic commerce solutions. As a prominent player in the software infrastructure sector, StoneCo combines innovative technology with hyper-local service through its proprietary Stone Hubs, driving market influence and growth. With a diverse client base and strong industry presence, the key question remains: does StoneCo’s current financial and operational strength support its valuation and future expansion potential?

Table of contents
Business Model & Company Overview
StoneCo Ltd., founded in 2000 and headquartered in George Town, Cayman Islands, stands as a dominant player in Brazil’s financial technology sector. Serving over 1.7M clients, including small-to-medium businesses and digital merchants, StoneCo’s ecosystem integrates in-store, online, and mobile commerce solutions. Its proprietary Stone Hubs provide hyper-local sales and services, combining technology with personalized support to create a seamless payment experience across channels.
The company’s revenue engine balances hardware, software, and recurring services delivered through direct sales teams and partnerships with software vendors. This diversified approach fuels growth in Brazil’s vibrant market while positioning StoneCo to leverage opportunities in broader Latin American commerce. Its robust presence and tailored solutions build a formidable economic moat, shaping the future of financial technology in emerging economies.
Financial Performance & Fundamental Metrics
In this section, I analyze StoneCo Ltd.’s income statement, key financial ratios, and dividend payout policy to assess its overall financial health and performance.
Income Statement
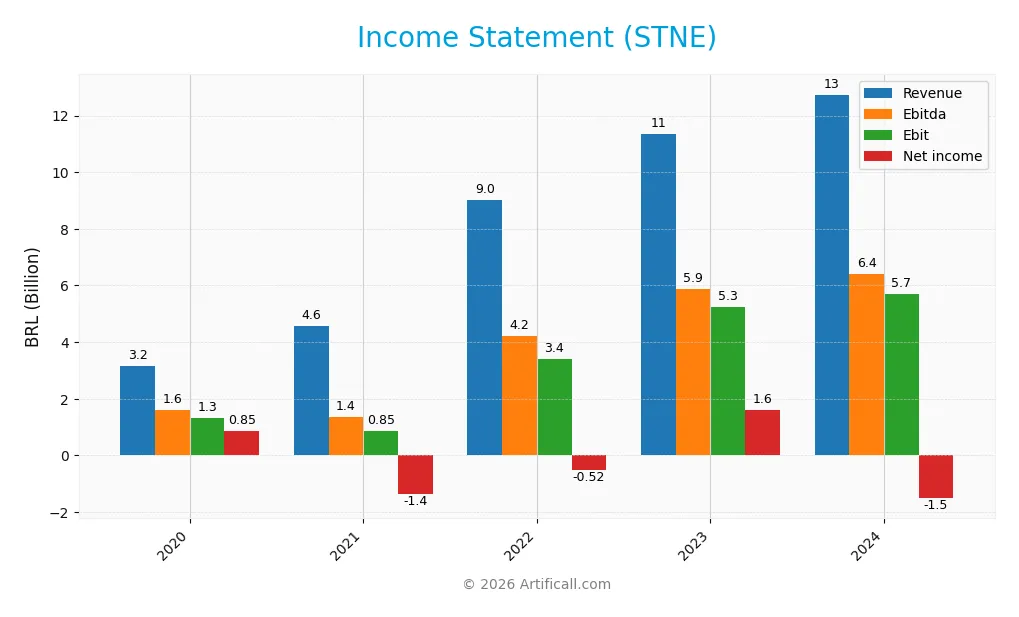
The table below presents StoneCo Ltd.’s income statement figures for the fiscal years 2020 through 2024 in BRL, reflecting the company’s revenue, expenses, earnings, and EPS.
| 2020 | 2021 | 2022 | 2023 | 2024 | |
|---|---|---|---|---|---|
| Revenue | 3.17B | 4.58B | 9.02B | 11.36B | 12.74B |
| Cost of Revenue | 770M | 1.71B | 2.67B | 2.98B | 3.39B |
| Operating Expenses | 1.02B | 1.94B | 2.85B | 3.14B | 3.47B |
| Gross Profit | 2.40B | 2.86B | 6.35B | 8.38B | 9.35B |
| EBITDA | 1.59B | 1.36B | 4.21B | 5.87B | 6.41B |
| EBIT | 1.33B | 851M | 3.41B | 5.25B | 5.72B |
| Interest Expense | 340M | 500M | 934M | 695M | 1.06B |
| Net Income | 854M | -1.36B | -519M | 1.59B | -1.52B |
| EPS | 2.95 | -4.46 | -1.69 | 4.74 | -5.02 |
| Filing Date | 2021-04-07 | 2022-04-29 | 2023-05-01 | 2024-04-24 | 2025-04-24 |
Income Statement Evolution
StoneCo Ltd. demonstrated strong revenue growth, increasing by 12.1% from 2023 to 2024 and by 302.3% over the 2020-2024 period. Gross profit followed a similar favorable trend, supported by a gross margin of 73.4%, which remained stable. Operating expenses grew proportionally with revenue, resulting in an improved EBIT margin of 44.9%. However, net income declined significantly, with a negative net margin of -11.9%, marking a reversal from prior positive results.
Is the Income Statement Favorable?
In 2024, StoneCo’s fundamentals present a mixed picture. While revenue and gross profit growth are favorable and operating efficiency is maintained, net income suffered a sharp downturn, generating a loss of 1.52B BRL and a steep EPS decline to -5.02. Interest expenses remain moderate at 8.3% of revenue, but the negative net margin and net income losses weigh heavily. Overall, the income statement is classified as generally favorable due to strong top-line and operating metrics despite net profitability challenges.
Financial Ratios
The following table presents key financial ratios for StoneCo Ltd. (STNE) over the fiscal years 2020 to 2024, illustrating profitability, valuation, liquidity, leverage, efficiency, and dividend metrics:
| Ratios | 2020 | 2021 | 2022 | 2023 | 2024 |
|---|---|---|---|---|---|
| Net Margin | 27% | -30% | -6% | 14% | -12% |
| ROE | 6% | -10% | -4% | 11% | -13% |
| ROIC | 5% | 4% | 18% | 20% | 22% |
| P/E | 148 | -21 | -30 | 18 | -10 |
| P/B | 8.5 | 2.1 | 1.2 | 2.0 | 1.3 |
| Current Ratio | 2.19 | 1.31 | 1.22 | 1.29 | 1.37 |
| Quick Ratio | 2.19 | 1.31 | 1.22 | 1.29 | 1.37 |
| D/E | 0.41 | 0.62 | 0.43 | 0.38 | 1.10 |
| Debt-to-Assets | 19% | 20% | 13% | 11% | 24% |
| Interest Coverage | 4.1 | 1.8 | 3.7 | 7.5 | 5.6 |
| Asset Turnover | 0.10 | 0.11 | 0.21 | 0.23 | 0.23 |
| Fixed Asset Turnover | 4.4 | 2.9 | 5.5 | 6.8 | 6.9 |
| Dividend Yield | 0% | 0% | 0% | 0% | 0% |
Evolution of Financial Ratios
StoneCo Ltd.’s Return on Equity (ROE) showed a decline, turning negative at -12.87% in 2024 after fluctuating in prior years. The Current Ratio improved slightly to 1.37 in 2024, indicating stable liquidity. However, the Debt-to-Equity Ratio rose to 1.1, reflecting increased leverage compared to past years. Profitability margins weakened, with net profit margin falling to -11.89%.
Are the Financial Ratios Favorable?
In 2024, StoneCo’s profitability ratios, including ROE and net margin, were unfavorable, while Return on Invested Capital (ROIC) was favorable at 22.41%. Liquidity showed a neutral to favorable stance, with a current ratio of 1.37 and quick ratio also favorable. Leverage metrics were mixed: debt-to-equity was unfavorable, but debt-to-assets and interest coverage ratios were favorable. Market valuation ratios like price-to-earnings and price-to-book were generally favorable, resulting in an overall slightly favorable financial ratio assessment.
Shareholder Return Policy
StoneCo Ltd. does not pay dividends, reflecting its negative net profit margin of approximately -12% in 2024. The company appears to prioritize reinvestment and growth, with no dividend payout and no share buyback programs reported. This approach aligns with a focus on long-term value creation despite current losses.
Given the absence of distributions, StoneCo’s strategy relies on operational improvement and capital allocation towards growth initiatives rather than immediate shareholder returns. While this may support sustainable value creation over time, investors should monitor profitability and cash flow trends to evaluate future return potential.
Score analysis
Here is a radar chart illustrating the company’s performance across key financial metrics:
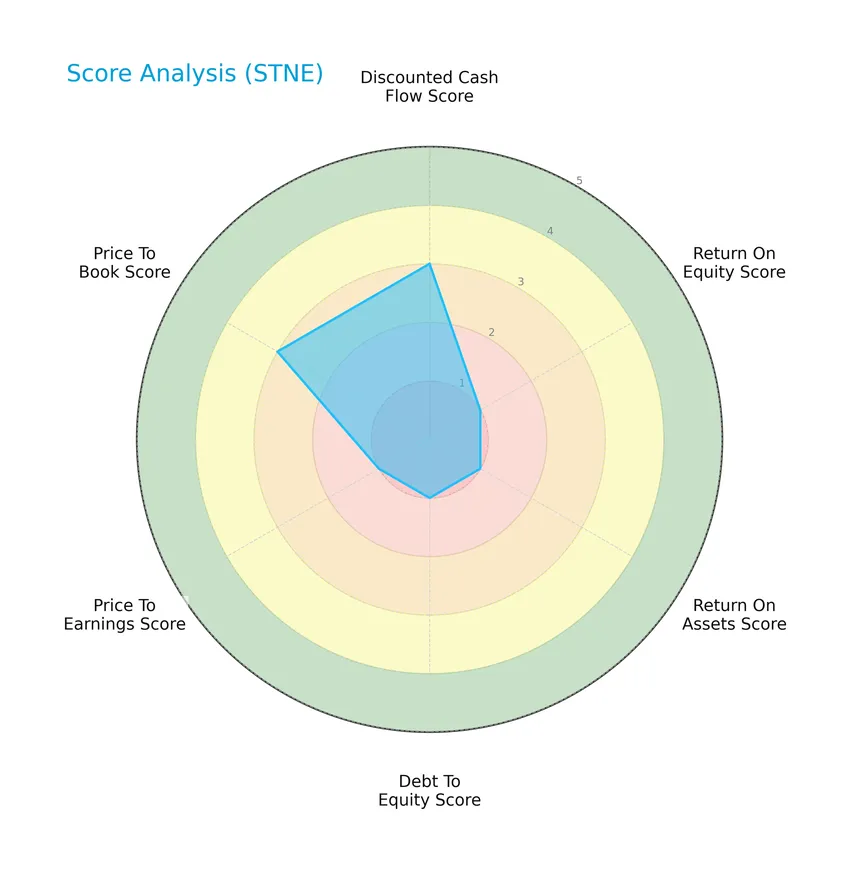
StoneCo Ltd. shows mixed scores with moderate performance in discounted cash flow and price-to-book ratios, but very unfavorable results in return on equity, return on assets, debt to equity, and price-to-earnings ratios.
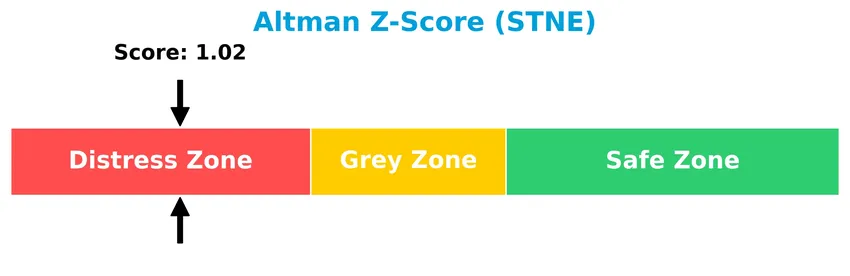
Analysis of the company’s bankruptcy risk
The Altman Z-Score places the company in the distress zone, indicating a high risk of financial distress and potential bankruptcy:
Is the company in good financial health?
The following Piotroski diagram reflects the company’s current financial health status:

With a Piotroski Score of 5, StoneCo Ltd. falls into the average category, suggesting moderate financial strength without clear signs of either robust health or significant weakness.
Competitive Landscape & Sector Positioning
This sector analysis will examine StoneCo Ltd.’s strategic positioning, revenue by segment, key products, main competitors, competitive advantages, and SWOT analysis. I will assess whether StoneCo Ltd. holds a competitive advantage over its industry peers.
Strategic Positioning
StoneCo Ltd. focuses on providing financial technology solutions primarily within Brazil, targeting small-to-medium merchants across in-store, online, and mobile channels. Its product portfolio centers on electronic commerce infrastructure, distributed mainly through proprietary Stone Hubs and direct sales teams, indicating a concentrated geographic and sectoral strategy.
Key Products & Brands
The table below outlines StoneCo Ltd.’s key products and brands with their respective descriptions:
| Product | Description |
|---|---|
| Stone Hubs | Proprietary hubs offering hyper-local sales and services for merchants in Brazil. |
| Financial Technology Solutions | Electronic commerce solutions for in-store, online, and mobile channels targeting small and medium businesses. |
| Digital Merchant Solutions | Technology and services provided to digital merchants through sales personnel and software vendors. |
| Brick-and-Mortar Merchant Solutions | Solutions sold directly to physical retail merchants by the company’s sales team. |
StoneCo Ltd. primarily serves small and medium businesses with integrated fintech solutions distributed via multiple channels, including proprietary hubs and direct sales teams.
Main Competitors
There are 32 competitors in total within the sector, with the table below listing the top 10 leaders by market capitalization:
| Competitor | Market Cap. |
|---|---|
| Microsoft Corporation | 3.52T |
| Oracle Corporation | 553B |
| Palantir Technologies Inc. | 383B |
| Adobe Inc. | 140B |
| Palo Alto Networks, Inc. | 120B |
| CrowdStrike Holdings, Inc. | 113B |
| Synopsys, Inc. | 92B |
| Cloudflare, Inc. | 69B |
| Fortinet, Inc. | 59B |
| Block, Inc. | 40B |
StoneCo Ltd. ranks 28th among 32 competitors in the Technology sector, with a market cap just 0.12% that of the leader, Microsoft Corporation. The company is positioned well below both the average market cap of the top 10 competitors (508B) and the sector median (19B). It maintains a 31.59% gap from the next competitor above, indicating a significant distance from closer peers.
Does STNE have a competitive advantage?
StoneCo Ltd. presents a clear competitive advantage, as it consistently generates a return on invested capital (ROIC) significantly above its weighted average cost of capital (WACC), indicating value creation. The company’s ROIC has shown strong growth over 2020-2024, supporting its efficiency in using invested capital and sustaining profitability.
Looking ahead, StoneCo’s focus on financial technology solutions for merchants across multiple sales channels in Brazil positions it well for growth. Continued expansion in digital payments and e-commerce integration, along with its strong client base of 1.77M merchants, suggests opportunities to capitalize on increasing adoption of electronic commerce in the region.
Comparisons with competitors
Check out how we compare the company to its competitors:
SWOT Analysis
This SWOT analysis highlights the key internal and external factors affecting StoneCo Ltd., helping investors understand its strategic position.
Strengths
- strong gross margin at 73.4%
- growing revenue with 12.1% YoY increase
- durable competitive advantage with rising ROIC
Weaknesses
- negative net margin at -11.89%
- low return on equity at -12.87%
- financial distress risk indicated by Altman Z-score
Opportunities
- expanding e-commerce market in Brazil
- adoption of fintech solutions by SMEs
- potential to improve profitability with scale
Threats
- high beta at 1.835 indicating market volatility
- intense competition in fintech sector
- regulatory risks in Brazilian financial markets
StoneCo Ltd. shows robust operational strengths and market opportunities but faces significant profitability and financial health challenges. Strategic focus on improving margins and managing financial risks is crucial for sustainable growth.
Stock Price Action Analysis
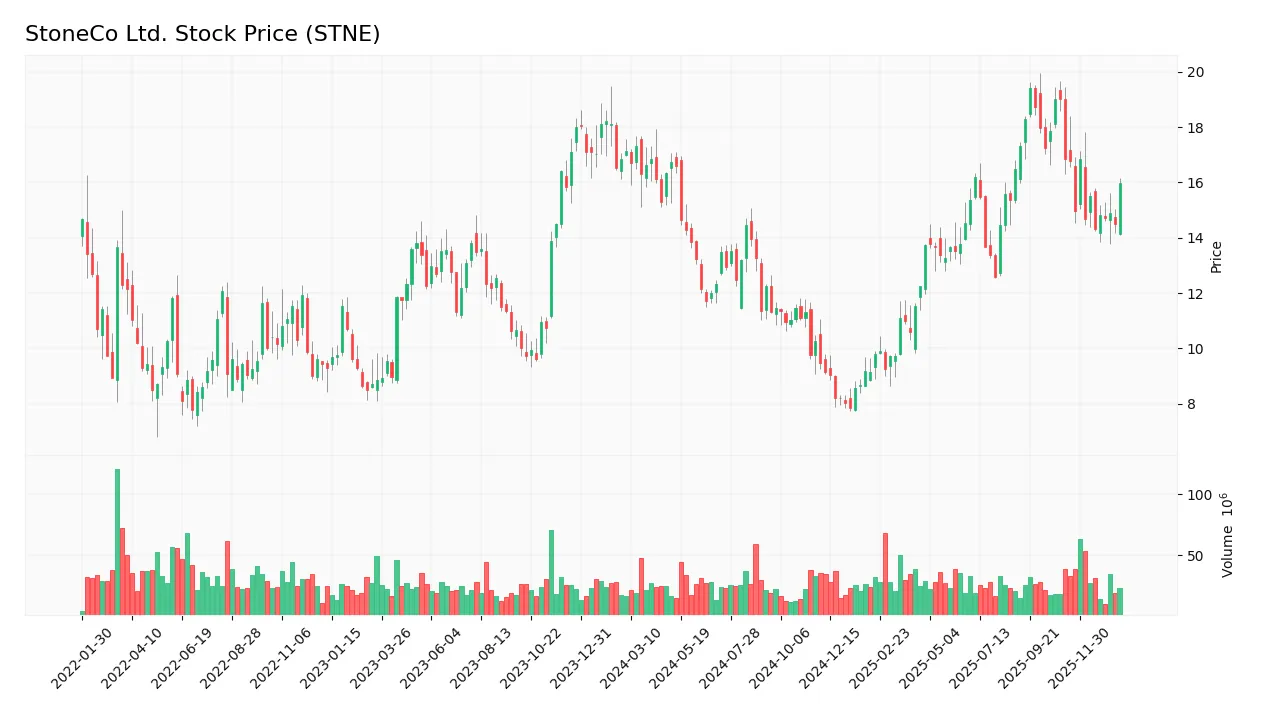
The weekly stock chart for StoneCo Ltd. (STNE) over the past 12 months illustrates key price movements and volatility patterns:
Trend Analysis
Over the past 12 months, StoneCo’s stock price declined by 6.6%, indicating a bearish trend. The trend shows deceleration with a standard deviation of 2.91. The highest price reached 19.4, while the lowest was 7.85, confirming significant price variability during this period.
Volume Analysis
In the last three months, trading volume has been increasing, with seller volume exceeding buyer volume by a notable margin. Buyers accounted for 41.9% of activity, indicating a slightly seller-dominant market sentiment and cautious investor participation.
Target Prices
The consensus target price for StoneCo Ltd. (STNE) is firmly established.
| Target High | Target Low | Consensus |
|---|---|---|
| 20 | 20 | 20 |
Analysts uniformly expect the stock to reach the $20 mark, indicating a stable outlook with limited price variation anticipated.
Analyst & Consumer Opinions
This section presents an overview of StoneCo Ltd.’s recent analyst ratings and consumer feedback to assess its market perception.

Don’t Let Luck Decide Your Entry Point
Optimize your entry points with our advanced ProRealTime indicators. You’ll get efficient buy signals with precise price targets for maximum performance. Start outperforming now!
Stock Grades
The following table summarizes recent verified stock grades for StoneCo Ltd. from leading financial institutions:
| Grading Company | Action | New Grade | Date |
|---|---|---|---|
| Goldman Sachs | Maintain | Buy | 2025-10-14 |
| B of A Securities | Maintain | Buy | 2025-09-09 |
| UBS | Maintain | Buy | 2025-08-29 |
| JP Morgan | Maintain | Overweight | 2025-07-16 |
| Barclays | Maintain | Equal Weight | 2025-05-12 |
| Barclays | Maintain | Equal Weight | 2025-04-23 |
| Citigroup | Upgrade | Buy | 2025-04-22 |
| Morgan Stanley | Maintain | Underweight | 2025-03-21 |
| Barclays | Maintain | Equal Weight | 2025-03-21 |
| Goldman Sachs | Maintain | Buy | 2025-02-06 |
The overall trend shows a predominance of Buy ratings with some Equal Weight and a single Underweight, indicating a generally positive but mixed sentiment among analysts during 2025. Notably, Citigroup upgraded its rating from Neutral to Buy in April 2025.
Consumer Opinions
Consumers of StoneCo Ltd. (STNE) express a mix of enthusiasm and constructive criticism about the company’s services and products.
| Positive Reviews | Negative Reviews |
|---|---|
| “StoneCo’s payment solutions are intuitive and fast, greatly improving my business operations.” | “Customer support can be slow to respond during peak times.” |
| “Integration with various e-commerce platforms is seamless and reliable.” | “Occasional downtime affects transaction processing, which is frustrating.” |
| “Competitive pricing and innovative features make StoneCo stand out in fintech.” | “Mobile app interface feels outdated compared to competitors.” |
Overall, consumers praise StoneCo for its efficient payment technology and platform integration but note issues with customer support responsiveness and occasional service interruptions. These insights suggest areas for improvement to enhance user satisfaction.
Risk Analysis
Below is a summarized table highlighting key risks associated with StoneCo Ltd., focusing on their likelihood and potential impact:
| Category | Description | Probability | Impact |
|---|---|---|---|
| Financial Health | Altman Z-Score at 1.02 indicates high bankruptcy risk, signaling financial distress. | High | High |
| Profitability | Negative net margin (-11.89%) and ROE (-12.87%) show ongoing losses and weak returns. | High | High |
| Leverage & Debt | Debt/equity ratio unfavorable at 1.1, with increased financial risk from debt servicing. | Moderate | Medium |
| Market Volatility | High beta of 1.835 indicates stock price sensitivity to market swings, increasing investment risk. | High | Medium |
| Dividend Policy | No dividends paid, reducing income appeal for yield-focused investors. | High | Low |
The most pressing risks are StoneCo’s financial distress signals, particularly its low Altman Z-Score and negative profitability metrics, which could threaten its stability. Combined with high market volatility, these factors warrant cautious consideration before investing.
Should You Buy StoneCo Ltd.?
StoneCo Ltd. appears to be creating value with a durable competitive moat supported by growing ROIC, yet its profitability profile could be seen as mixed given operational challenges. Despite a manageable leverage profile, the overall rating suggests a moderate risk-return balance.
Strength & Efficiency Pillars
StoneCo Ltd. exhibits robust value creation, with a return on invested capital (ROIC) of 22.41% comfortably exceeding its weighted average cost of capital (WACC) at 10.78%, confirming the company as a clear value creator. This is reinforced by its strong gross margin of 73.4% and an impressive EBIT margin of 44.86%, signaling operational efficiency. While the net margin stands negative at -11.89%, the company maintains a solid quick ratio of 1.37 and interest coverage of 5.41, indicating adequate liquidity and debt-servicing capacity. However, its Altman Z-score of 1.02 places it in the distress zone, suggesting caution on financial stability.
Weaknesses and Drawbacks
Several red flags temper StoneCo’s investment appeal. The company’s debt-to-equity ratio of 1.1 reflects a leveraged capital structure, which, combined with a weak net margin and negative return on equity (-12.87%), raises profitability concerns. The stock’s price trend is bearish, with a recent 4.99% decline and seller dominance at 58.1%, creating short-term market pressure. Despite a moderate price-to-book ratio of 1.27, its price-to-earnings ratio is negative but labeled favorable due to losses, complicating valuation. The Altman Z-score in distress further underscores bankruptcy risk, necessitating careful risk management.
Our Verdict about StoneCo Ltd.
StoneCo Ltd.’s long-term fundamental profile might appear moderately favorable due to its strong ROIC and operational margins, positioning it as a value creator. However, the bearish price trend coupled with recent seller dominance suggests that despite its intrinsic strengths, investors could benefit from a cautious, wait-and-see approach before committing capital. The mixed financial health indicators imply that the company may face volatility, making timing and risk control essential.
Disclaimer: This content is for informational purposes only and does not constitute financial, investment, or other professional advice. Investing in financial markets involves a significant risk of loss, and past performance is not indicative of future results.
Additional Resources
- StoneCo Ltd. (STNE) Rises Higher Than Market: Key Facts – Yahoo Finance (Jan 21, 2026)
- StoneCo Ltd. (NASDAQ:STNE) Given Consensus Rating of “Hold” by Brokerages – MarketBeat (Jan 23, 2026)
- StoneCo Ltd. to Announce Fourth Quarter and Fiscal Year 2025 Financial Results on March 02nd, 2026 – TMX Newsfile (Jan 22, 2026)
- StoneCo Enters 2026 Cheap, With Credit Set To Drive The Next Leg Of Earnings (NASDAQ:STNE) – Seeking Alpha (Jan 22, 2026)
- StoneCo Ltd (STNE) Shares Up 6.67% on Jan 22 – GuruFocus (Jan 22, 2026)
For more information about StoneCo Ltd., please visit the official website: stone.co