Home > Analyses > Technology > STMicroelectronics N.V.
STMicroelectronics shapes modern life by powering everything from cars to smartphones with cutting-edge semiconductor technology. The company leads the industry with its diverse portfolio, including automotive ICs, sensors, microcontrollers, and innovative power solutions. Renowned for quality and relentless innovation, STM drives advancements across multiple sectors worldwide. As the semiconductor landscape evolves rapidly, I ask: do STMicroelectronics’ fundamentals still support its current valuation and future growth potential?
Table of contents
Business Model & Company Overview
STMicroelectronics N.V., founded in 1987 and headquartered in Schiphol, Netherlands, stands as a leading semiconductor powerhouse. It integrates Automotive ICs, Analog and MEMS sensors, and Microcontrollers into a unified ecosystem that drives innovation across automotive, industrial, and personal electronics sectors. With 49,602 employees, it commands a vital role in shaping semiconductor technology.
The company’s revenue engine balances hardware sales—like power transistors and microcontrollers—with embedded software and recurring services. STMicroelectronics serves global markets across the Americas, Europe, and Asia, leveraging a diversified customer base. Its economic moat lies in this multifaceted product integration and robust global footprint, securing long-term industry influence.
Financial Performance & Fundamental Metrics
I will analyze STMicroelectronics N.V.’s income statement, key financial ratios, and dividend payout policy to assess its core financial health and shareholder returns.
Income Statement
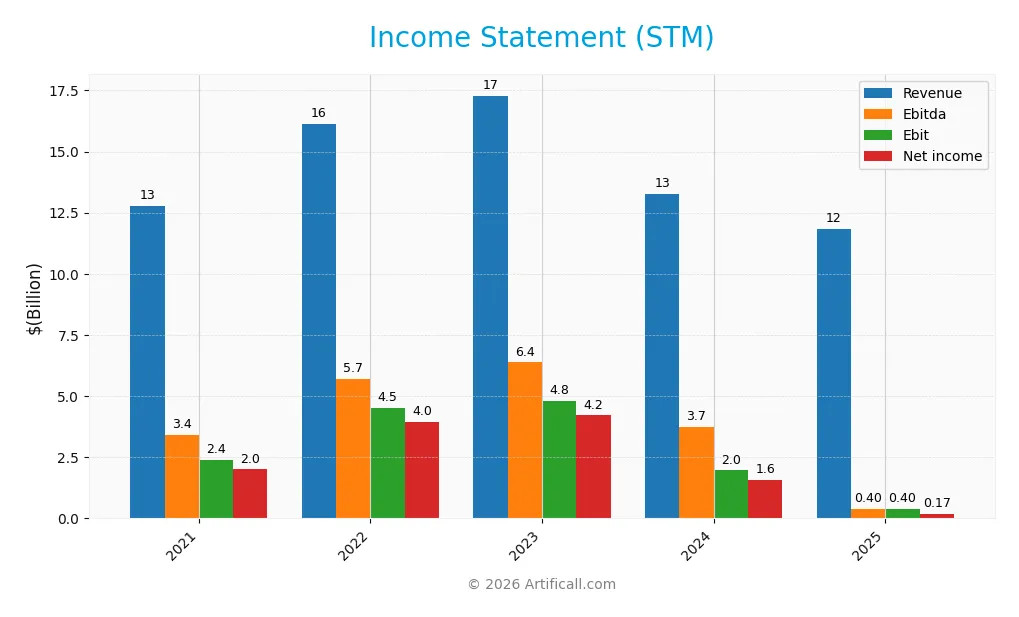
This table presents STMicroelectronics N.V.’s key income statement figures for the fiscal years 2021 through 2025, expressed in USD.
| 2021 | 2022 | 2023 | 2024 | 2025 | |
|---|---|---|---|---|---|
| Revenue | 12.8B | 16.1B | 17.3B | 13.3B | 11.8B |
| Cost of Revenue | 7.4B | 8.5B | 9.0B | 8.0B | 7.8B |
| Operating Expenses | 2.9B | 3.2B | 3.7B | 3.5B | 3.7B |
| Gross Profit | 5.3B | 7.6B | 8.3B | 5.2B | 4.0B |
| EBITDA | 3.4B | 5.7B | 6.4B | 3.7B | 0.4B |
| EBIT | 2.4B | 4.5B | 4.8B | 2.0B | 0.4B |
| Interest Expense | 42M | 13M | 55M | 85M | 0 |
| Net Income | 2.0B | 4.0B | 4.2B | 1.6B | 167M |
| EPS | 2.21 | 4.77 | 4.66 | 1.73 | 0.19 |
| Filing Date | 2022-02-24 | 2023-02-23 | 2024-02-22 | 2025-02-27 | 2026-02-26 |
Income Statement Evolution
STMicroelectronics’ revenue declined by 10.8% in 2025, continuing a five-year downward trend of 7.2%. Gross profit fell 23.1% year-over-year, compressing gross margins to 33.9%, a slight deterioration but still favorable. EBIT and net income margins weakened significantly, reflecting substantial margin pressure and a sharp contraction in profitability.
Is the Income Statement Favorable?
The 2025 income statement reveals challenging fundamentals. EBIT margin stands at a neutral 3.4%, while net margin shrinks to 1.4%, signaling tight operational efficiency. No interest expense supports financial stability. However, steep declines in net income (-91.7% over five years) and EPS (-89.2% in one year) indicate deteriorating profitability, leading me to classify the income statement as generally unfavorable.
Financial Ratios
The following table summarizes key financial ratios for STMicroelectronics N.V. over the fiscal years 2021 to 2025:
| Ratios | 2021 | 2022 | 2023 | 2024 | 2025 |
|---|---|---|---|---|---|
| Net Margin | 15.7% | 24.6% | 24.4% | 11.7% | 1.4% |
| ROE | 21.7% | 31.2% | 25.2% | 8.9% | 0.9% |
| ROIC | 16.2% | 24.0% | 19.5% | 6.3% | 0.7% |
| P/E | 22.1 | 8.1 | 10.8 | 14.4 | 136.1 |
| P/B | 4.80 | 2.54 | 2.71 | 1.29 | 1.27 |
| Current Ratio | 2.66 | 2.56 | 3.17 | 3.11 | 3.36 |
| Quick Ratio | 1.99 | 1.89 | 2.44 | 2.37 | 2.43 |
| D/E | 0.30 | 0.23 | 0.19 | 0.18 | 0.12 |
| Debt-to-Assets | 17.6% | 14.6% | 13.0% | 12.8% | 8.6% |
| Interest Coverage | 57.6 | 341.5 | 83.8 | 19.7 | 0 |
| Asset Turnover | 0.82 | 0.81 | 0.71 | 0.54 | 0.48 |
| Fixed Asset Turnover | 2.25 | 1.97 | 1.64 | 1.22 | 1.07 |
| Dividend Yield | 0.46% | 0.66% | 0.49% | 1.28% | 1.28% |
Evolution of Financial Ratios
Return on Equity (ROE) declined sharply from 31.2% in 2022 to 0.93% in 2025, signaling weakening profitability. The Current Ratio improved slightly, reaching 3.36 in 2025, indicating better short-term liquidity. Debt-to-Equity fell steadily from 0.30 in 2021 to 0.12 in 2025, reflecting reduced leverage and a more conservative capital structure.
Are the Financial Ratios Favorable?
Profitability metrics like net margin (1.41%) and ROE (0.93%) are unfavorable, well below industry norms and the S&P 500 average. Liquidity is mixed; the current ratio is high yet deemed unfavorable, while the quick ratio is favorable at 2.43. Leverage ratios, including debt-to-equity at 0.12 and debt-to-assets at 8.6%, are favorable, indicating low financial risk. Asset turnover (0.48) and price-to-earnings ratio (136.11) are unfavorable, suggesting efficiency challenges and high valuation. Overall, the ratios present a slightly unfavorable financial profile.
Shareholder Return Policy
STMicroelectronics pays dividends with a payout ratio of approximately 175% in 2025, reflecting a significant increase from prior years. The dividend per share rose to $0.33, yielding around 1.28%, but this payout exceeds net income, posing potential sustainability concerns.
The company also engages in share buybacks, though free cash flow coverage for dividends and repurchases is currently negative, indicating reliance on external financing or reserves. This distribution approach may challenge long-term value creation unless cash flow generation improves substantially.
Score analysis
The radar chart below illustrates key financial scores that reflect the company’s valuation and performance metrics:
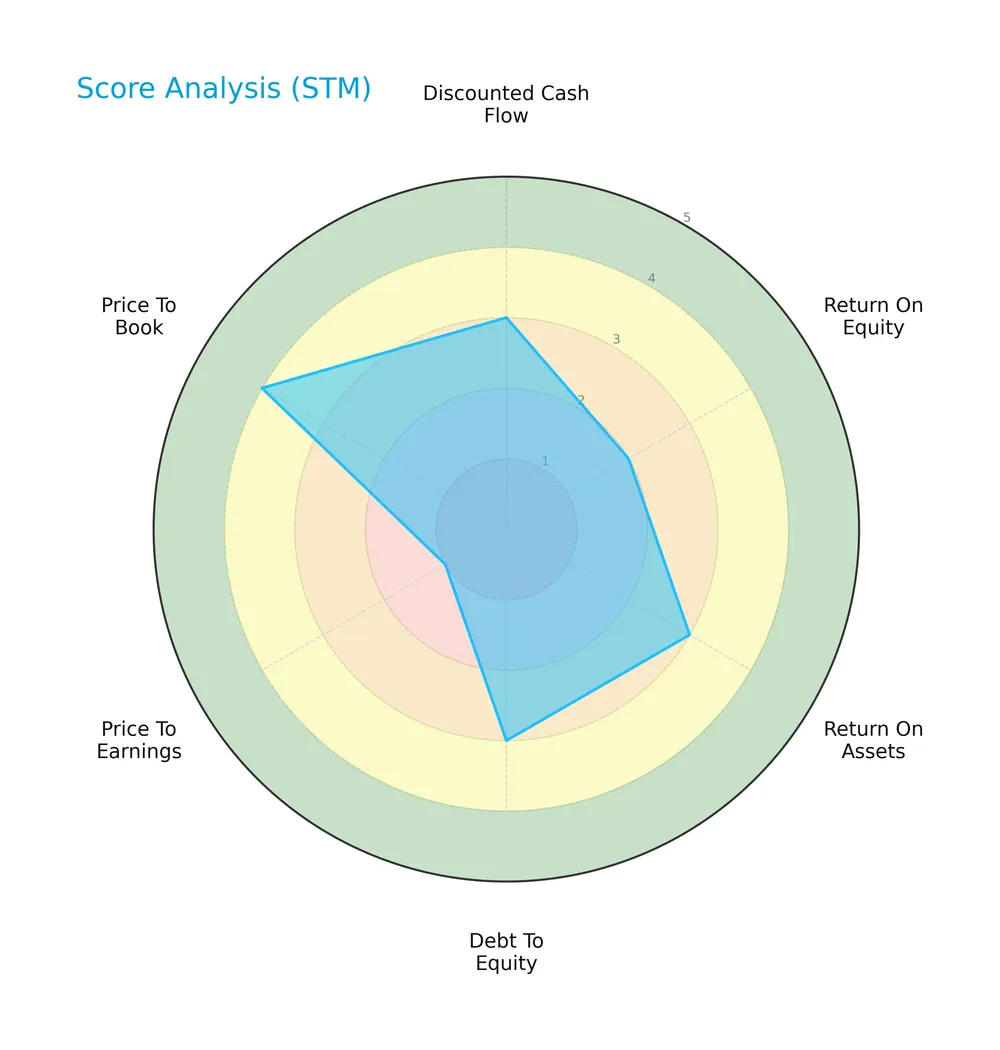
The company shows moderate scores in discounted cash flow, return on assets, and debt to equity. Return on equity scores unfavorably, while price to earnings is very unfavorable. Price to book remains favorable, indicating mixed valuation signals.
Analysis of the company’s bankruptcy risk
The Altman Z-Score places the company clearly in the safe zone, signaling low bankruptcy risk and strong financial stability:

Is the company in good financial health?
The Piotroski diagram highlights the company’s financial strength based on profitability, leverage, liquidity, and efficiency metrics:

With a Piotroski Score of 6, the company exhibits average financial health. This suggests reasonable operational performance but room for improvement in financial robustness.
Competitive Landscape & Sector Positioning
This section examines STMicroelectronics N.V.’s strategic positioning within the semiconductor sector, focusing on revenue by segment, key products, and main competitors. I will analyze whether STMicroelectronics holds a competitive advantage over its peers.
Strategic Positioning
STMicroelectronics N.V. maintains a diversified product portfolio across automotive ICs, analog, MEMS, sensors, and microcontrollers. Geographically, it leverages a broad footprint, with significant revenue from Asia Pacific, the Americas, and EMEA, reflecting balanced global exposure.
Revenue by Segment
This pie chart illustrates STMicroelectronics N.V.’s revenue distribution by segment for the fiscal year 2025, reflecting the company’s product and service contributions.

In 2025, the product segment dominates with $11.8B, underscoring its core role. Service revenue, at $193M, remains a modest but steady contributor. The “Product and Service, Other” segment is minimal at $46M, indicating limited diversification. The recent year shows a slight slowdown from 2024’s $13.2B in product sales, signaling potential concentration risk and the need for growth in adjacent segments.
Key Products & Brands
The table below outlines STMicroelectronics’ main products and brand groups with corresponding descriptions:
| Product | Description |
|---|---|
| Automotive and Discrete Group | Offers automotive integrated circuits (ICs), discrete components, and power transistors serving the automotive market. |
| Analog, MEMS and Sensors Group | Provides industrial ASICs, general purpose analog products, custom analog ICs, wireless charging, MEMS sensors, and optical sensing solutions. |
| Microcontrollers and Digital ICs Group | Supplies general purpose and secure microcontrollers, RF products, and application-specific standard products for analog, digital, and mixed-signal uses. |
| Product | Semiconductor products spanning automotive, industrial, personal electronics, and communication equipment markets. |
| Service | Assembly and related services supporting product offerings. |
| Product and Service, Other | Miscellaneous product and service revenues not classified in main segments. |
STMicroelectronics operates a diversified portfolio focused on automotive ICs, analog and sensor technologies, and microcontrollers. Its product suite supports multiple high-growth sectors including automotive, industrial, and personal electronics.
Main Competitors
The semiconductor sector includes 38 competitors, with the table below listing the top 10 leaders by market capitalization:
| Competitor | Market Cap. |
|---|---|
| NVIDIA Corporation | 4.6T |
| Broadcom Inc. | 1.6T |
| Taiwan Semiconductor Manufacturing Company Limited | 1.6T |
| ASML Holding N.V. | 415B |
| Advanced Micro Devices, Inc. | 363B |
| Micron Technology, Inc. | 353B |
| Lam Research Corporation | 232B |
| Applied Materials, Inc. | 214B |
| QUALCOMM Incorporated | 185B |
| Intel Corporation | 173B |
STMicroelectronics N.V. ranks 22nd among 38 competitors. Its market cap is just 0.65% of NVIDIA’s, the sector leader. The company sits below both the average market cap of the top 10 competitors (975B) and the sector median (31B). It maintains a significant 22.37% gap from its nearest competitor above.
Comparisons with competitors
Check out how we compare the company to its competitors:
Does STM have a competitive advantage?
STMicroelectronics N.V. currently does not present a competitive advantage. Its return on invested capital (ROIC) is significantly below its weighted average cost of capital (WACC), indicating value destruction and declining profitability.
The company operates across diverse semiconductor segments and global markets, including automotive and industrial applications. Future opportunities may arise from innovations such as wireless charging and integrated GaN power transistors, but recent financial trends remain unfavorable.
SWOT Analysis
This SWOT analysis highlights STMicroelectronics’ core strategic factors shaping its market position and growth potential.
Strengths
- diversified product portfolio
- strong presence in automotive and industrial sectors
- low debt levels and strong liquidity
Weaknesses
- declining revenue and profitability trends
- very low ROIC below WACC
- high P/E ratio signaling overvaluation
Opportunities
- growth in electric vehicles and IoT markets
- expansion in Asia Pacific, especially Singapore
- innovation in GaN and MEMS technologies
Threats
- intense semiconductor industry competition
- cyclicality affecting demand and pricing
- geopolitical risks in key markets
STMicroelectronics faces significant profitability challenges despite solid liquidity and product diversity. The company must leverage growth in automotive electronics and Asia to offset margin pressures and industry cyclicality.
Stock Price Action Analysis
The weekly stock chart illustrates STMicroelectronics N.V.’s price fluctuations over the past 12 months, highlighting key support and resistance levels:

Trend Analysis
Over the past 12 months, STM’s stock price declined by 19.88%, indicating a bearish trend with accelerating downward momentum. The price ranged between 44.49 and 18.49, with a high volatility reflected by a 6.08 standard deviation. Recent three-month data show a 29.27% rebound, signaling a short-term recovery.
Volume Analysis
Trading volumes over the last three months show a clear buyer dominance with 61.67% of activity driven by purchases. Volume is increasing, suggesting growing investor interest and positive market participation during the recent price rebound. This buyer-driven momentum contrasts with the overall balanced volume distribution.
Target Prices
Analysts set a consensus target price that reflects cautious optimism for STMicroelectronics N.V.
| Target Low | Target High | Consensus |
|---|---|---|
| 28 | 45 | 36.75 |
The target range indicates moderate upside potential from current levels. Analysts expect steady growth but acknowledge sector cyclicality risks.

Don’t Let Luck Decide Your Entry Point
Optimize your entry points with our advanced ProRealTime indicators. You’ll get efficient buy signals with precise price targets for maximum performance. Start outperforming now!
Analyst & Consumer Opinions
This section examines analyst ratings and consumer feedback related to STMicroelectronics N.V. to provide balanced insights.
Stock Grades
Here is the latest overview of STMicroelectronics N.V. grades from recognized analysts:
| Grading Company | Action | New Grade | Date |
|---|---|---|---|
| Susquehanna | Maintain | Positive | 2026-02-23 |
| TD Cowen | Maintain | Buy | 2025-10-24 |
| Susquehanna | Maintain | Positive | 2025-10-22 |
| Susquehanna | Maintain | Positive | 2025-07-25 |
| Baird | Upgrade | Outperform | 2025-07-22 |
| Susquehanna | Maintain | Positive | 2025-07-22 |
| Jefferies | Upgrade | Buy | 2025-02-19 |
| Bernstein | Downgrade | Market Perform | 2025-02-05 |
| Susquehanna | Maintain | Positive | 2025-01-31 |
| Barclays | Downgrade | Underweight | 2025-01-22 |
The consensus trend favors a Buy rating with multiple Positive and Buy grades maintained. Upgrades and downgrades reflect some divergence, but the overall analyst sentiment remains constructive.
Consumer Opinions
STMicroelectronics N.V. consistently attracts attention for its innovative technology and reliable product performance.
| Positive Reviews | Negative Reviews |
|---|---|
| Customers praise STM’s cutting-edge semiconductor tech. | Some users report occasional delays in customer support. |
| High energy efficiency in STM chips impresses buyers. | A few mention complexity in integration with legacy systems. |
| Product durability and long lifecycle receive acclaim. | Pricing is seen as slightly above average by some clients. |
Overall, consumers applaud STM’s technological leadership and product reliability. However, customer service responsiveness and pricing remain areas needing improvement.
Risk Analysis
Below is a table summarizing key risks for STMicroelectronics N.V. (STM) by category, probability, and impact:
| Category | Description | Probability | Impact |
|---|---|---|---|
| Market Volatility | STM’s beta of 1.32 indicates above-average sensitivity to market swings, raising share price risk. | High | Medium |
| Profitability | Low net margin (1.41%) and ROE (0.93%) signal weak profitability amid semiconductor cyclicality. | High | High |
| Valuation | Elevated P/E ratio of 136 suggests overvaluation risk compared to industry and S&P 500 norms. | Medium | High |
| Supply Chain | Semiconductor supply disruptions remain a persistent threat, potentially impacting production. | Medium | Medium |
| Competitive Pressure | Intense competition in semiconductors may erode STM’s market share and margins. | Medium | High |
| Liquidity | Current ratio at 3.36 is high but flagged as unfavorable, possibly reflecting inefficient asset use. | Low | Low |
The most pressing risks for STM are its weak profitability metrics and lofty valuation. Historically in semiconductors, thin margins expose companies to downturns, while a high P/E ratio signals investor caution. Supply chain and competitive pressures add medium risk layers. Despite a strong Altman Z-score placing STM in the safe zone, investors must weigh these factors carefully.
Should You Buy STMicroelectronics N.V.?
STMicroelectronics appears to have manageable leverage and moderate profitability, though its competitive moat could be seen as very unfavorable due to declining ROIC. Supported by a B rating and safe Altman Z-Score, the profile suggests cautious value creation.
Strength & Efficiency Pillars
STMicroelectronics N.V. maintains a safe Altman Z-Score of 4.44, signaling solid solvency. However, profitability metrics lag with a net margin of 1.41%, ROE at 0.93%, and ROIC at 0.67%, all unfavorable. The ROIC at 0.67% falls well below the WACC of 9.3%, indicating the company is destroying value rather than creating it. Operational efficiency shows mixed signals: gross margin is favorable at 33.89%, but EBIT margin is just neutral at 3.39%. Overall, operational margins provide some resilience amid profitability challenges.
Weaknesses and Drawbacks
Despite solvency strength, STMicroelectronics faces critical valuation and growth headwinds. The P/E ratio at 136.11 signals an excessive premium, raising concerns about market expectations. Revenue and net income growth have declined sharply, with net income down 91.67% over the recent period. The current ratio is elevated at 3.36, flagged as unfavorable, which may suggest inefficient working capital deployment. Asset turnover stands low at 0.48, indicating underutilized assets. These factors combined with a bearish overall stock trend (-19.88%) elevate near-term risk.
Our Final Verdict about STMicroelectronics N.V.
STMicroelectronics presents a fundamentally challenged profile with weak profitability and value destruction. Its safe solvency position (Altman Z-Score 4.44) reduces bankruptcy risk but does not offset operational and valuation concerns. Despite recent buyer dominance (61.67%) and a short-term price rebound (+29.27%), the bearish long-term trend and high valuation may warrant caution. The profile might appear speculative and suggests a wait-and-see stance for more favorable entry points.
Disclaimer: This content is for informational purposes only and does not constitute financial, investment, or other professional advice. Investing in financial markets involves a significant risk of loss, and past performance is not indicative of future results.
Additional Resources
- Citigroup Inc. Sells 1,011,738 Shares of STMicroelectronics N.V. $STM – MarketBeat (Feb 27, 2026)
- STMicroelectronics (NYSE: STM) files and publishes 2025 Form 20-F annual report – Stock Titan (Feb 26, 2026)
- STMicroelectronics Publishes its 2025 Annual Report Form 20-F – ChartMill (Feb 26, 2026)
- STMicroelectronics President and CEO Jean-Marc Chery to speak at Morgan Stanley investor conference – GlobeNewswire (Feb 25, 2026)
- STMicroelectronics NV (STM) Q3 2025 Earnings Call Highlights: Strong Revenue Growth Amidst … – Yahoo Finance (Oct 23, 2025)
For more information about STMicroelectronics N.V., please visit the official website: st.com