Home > Analyses > Basic Materials > Steel Dynamics, Inc.
Steel Dynamics, Inc. forges the backbone of America’s infrastructure, shaping industries from construction to automotive with precision-engineered steel products. Its market leadership stems from a diverse portfolio spanning steel production, metal recycling, and fabrication, combined with a reputation for quality and operational efficiency. As the steel sector faces evolving demand cycles and raw material pressures, I explore whether Steel Dynamics’ fundamentals still justify its premium valuation and growth aspirations.

Table of contents
Business Model & Company Overview
Steel Dynamics, Inc., founded in 1993 and headquartered in Fort Wayne, Indiana, stands as a leading steel producer and metal recycler in the US. It operates a cohesive ecosystem spanning Steel Operations, Metals Recycling, and Steel Fabrication. This integrated approach supplies construction, automotive, manufacturing, and heavy equipment markets with engineered steel products and specialty components that form the backbone of America’s industrial infrastructure.
The company’s revenue engine balances steel product sales with metals recycling and fabrication services. It sells hot-rolled, cold-rolled, and coated steel products alongside processed ferrous and nonferrous scrap, serving clients across the Americas and exporting globally. I see Steel Dynamics’ efficient capital allocation and diversified operations as a durable economic moat, positioning it to influence the steel industry’s future trajectory.
Financial Performance & Fundamental Metrics
I will analyze Steel Dynamics, Inc.’s income statement, key financial ratios, and dividend payout policy to assess its operational efficiency and shareholder returns.
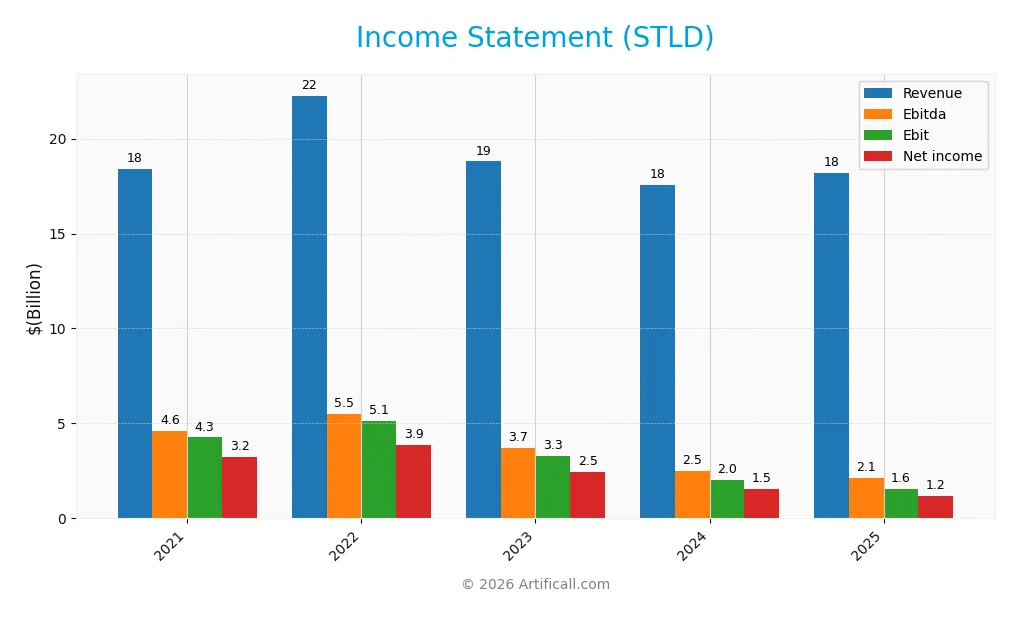
Income Statement
The table below presents Steel Dynamics, Inc.’s key income statement figures for fiscal years 2021 through 2025, all values in USD.
| 2021 | 2022 | 2023 | 2024 | 2025 | |
|---|---|---|---|---|---|
| Revenue | 18.4B | 22.3B | 18.8B | 17.5B | 18.2B |
| Cost of Revenue | 13.0B | 16.1B | 14.7B | 14.7B | 15.8B |
| Operating Expenses | 1.1B | 1.0B | 0.9B | 0.9B | 0.9B |
| Gross Profit | 5.4B | 6.1B | 4.0B | 2.8B | 2.4B |
| EBITDA | 4.6B | 5.5B | 3.7B | 2.5B | 2.1B |
| EBIT | 4.3B | 5.1B | 3.3B | 2.0B | 1.6B |
| Interest Expense | 57M | 92M | 76M | 56M | 70M |
| Net Income | 3.2B | 3.9B | 2.5B | 1.5B | 1.2B |
| EPS | 15.67 | 21.06 | 14.72 | 9.89 | 8.02 |
| Filing Date | 2022-02-28 | 2023-02-28 | 2024-02-29 | 2025-02-28 | 2026-02-27 |
Income Statement Evolution
Steel Dynamics’ revenue showed a slight decline of 1.26% from 2021 to 2025, with a modest 3.63% increase in the last year. Gross profit and net income contracted sharply over the period, falling by 15.64% and 63.11%, respectively. Margins also weakened significantly, with net margin shrinking by 62.64%, reflecting margin pressures despite steady operating expenses relative to revenue.
Is the Income Statement Favorable?
In 2025, Steel Dynamics reported $18.2B in revenue and $1.19B in net income, yielding a net margin of 6.52%, which is considered favorable. Interest expense remained low at 0.39% of revenue, supporting profitability. However, year-over-year declines in gross profit (-15.64%) and EBIT (-23.35%) reveal operational challenges. Overall, the fundamentals appear unfavorable given the declines in earnings and margins despite stable revenue growth.
Financial Ratios
The following table presents key financial ratios for Steel Dynamics, Inc. (STLD) over the last five fiscal years, illustrating profitability, liquidity, leverage, and valuation metrics:
| Ratios | 2021 | 2022 | 2023 | 2024 | 2025 |
|---|---|---|---|---|---|
| Net Margin | 17% | 17% | 13% | 9% | 7% |
| ROE | 51% | 48% | 28% | 17% | 13% |
| ROIC | 32% | 32% | 19% | 11% | 8% |
| P/E | 4.0x | 4.6x | 8.0x | 11.5x | 21.1x |
| P/B | 2.0x | 2.2x | 2.2x | 2.0x | 2.8x |
| Current Ratio | 3.1x | 3.8x | 2.9x | 2.5x | 3.1x |
| Quick Ratio | 1.5x | 2.2x | 1.7x | 1.1x | 1.3x |
| D/E | 0.49x | 0.38x | 0.35x | 0.37x | 0.47x |
| Debt-to-Assets | 25% | 22% | 21% | 22% | 26% |
| Interest Coverage | 75x | 56x | 41x | 34x | 21x |
| Asset Turnover | 1.47 | 1.57 | 1.26 | 1.17 | 1.11 |
| Fixed Asset Turnover | 3.9x | 4.1x | 2.8x | 2.2x | 2.1x |
| Dividend Yield | 1.7% | 1.3% | 1.4% | 1.6% | 1.2% |
Evolution of Financial Ratios
From 2021 to 2025, Steel Dynamics, Inc. saw Return on Equity (ROE) decline from 51% to 13%, reflecting reduced profitability. The Current Ratio remained elevated, increasing to 3.06 in 2025, indicating strong liquidity but potential inefficiency. Debt-to-Equity Ratio showed moderate stability, ending at 0.47, suggesting controlled leverage.
Are the Financial Ratios Fovorable?
In 2025, profitability ratios like net margin (6.5%) and ROE (13.2%) were neutral, indicating modest earnings relative to equity. Liquidity showed mixed signals: a high current ratio (3.06) flagged inefficiency, but the quick ratio (1.29) was favorable. Leverage ratios including debt-to-equity (0.47) and interest coverage (22.3) were favorable, reflecting manageable debt. Overall, the financial ratios are slightly favorable.
Shareholder Return Policy
Steel Dynamics, Inc. maintains a consistent dividend policy, with payout ratios rising from 6.6% in 2021 to 24.6% in 2025. The dividend per share increased steadily, supported by dividend yields around 1.1% to 1.7%, and free cash flow coverage of dividends remains adequate, albeit with some variability.
The company also engages in share buybacks, complementing its dividend distributions. This balanced approach indicates a commitment to returning capital while preserving financial flexibility. Overall, the dividend and repurchase strategy appears aligned with sustainable long-term shareholder value creation.
Score analysis
The following radar chart highlights key financial scores for Steel Dynamics, Inc. across valuation and profitability metrics:
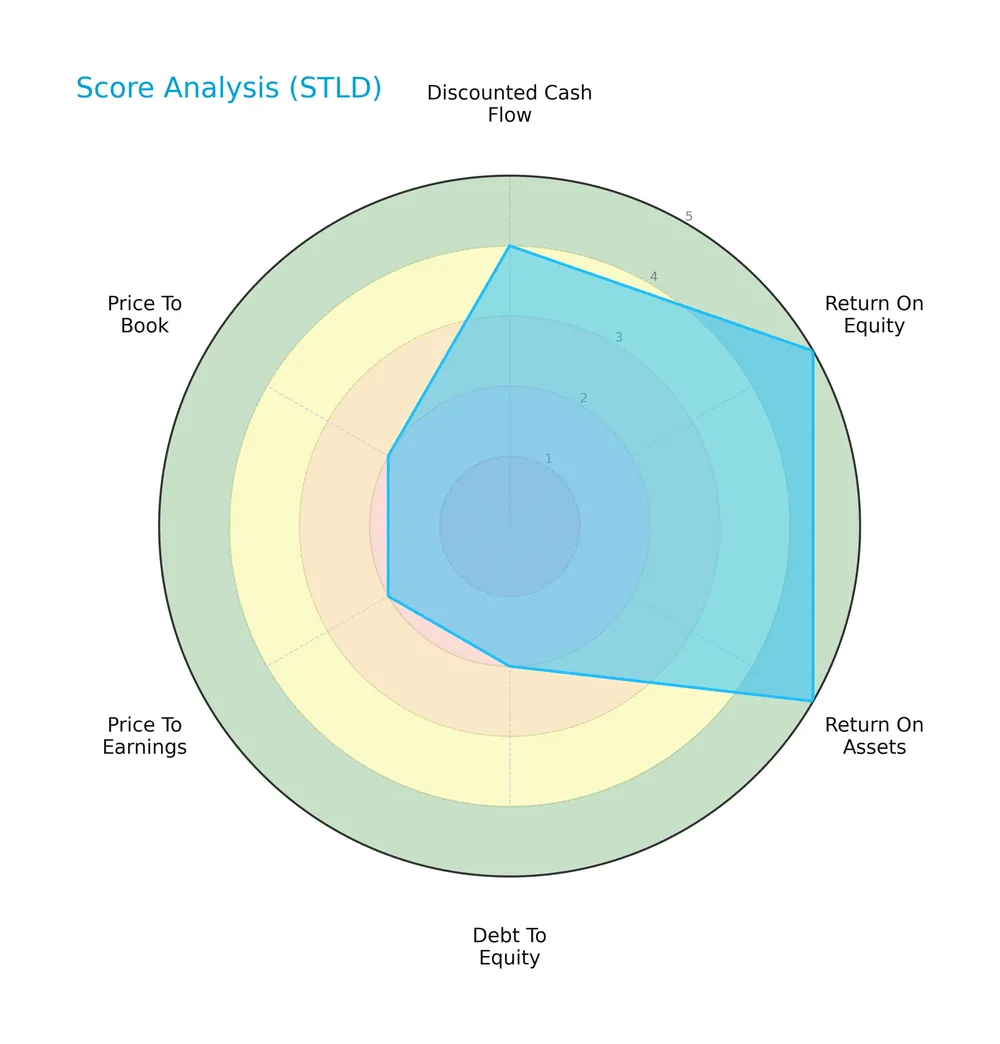
Steel Dynamics earns very favorable scores in return on equity and assets, scoring 5 each. Discounted cash flow is favorable at 4. Debt to equity, price to earnings, and price to book scores are unfavorable at 2, indicating valuation and leverage concerns.
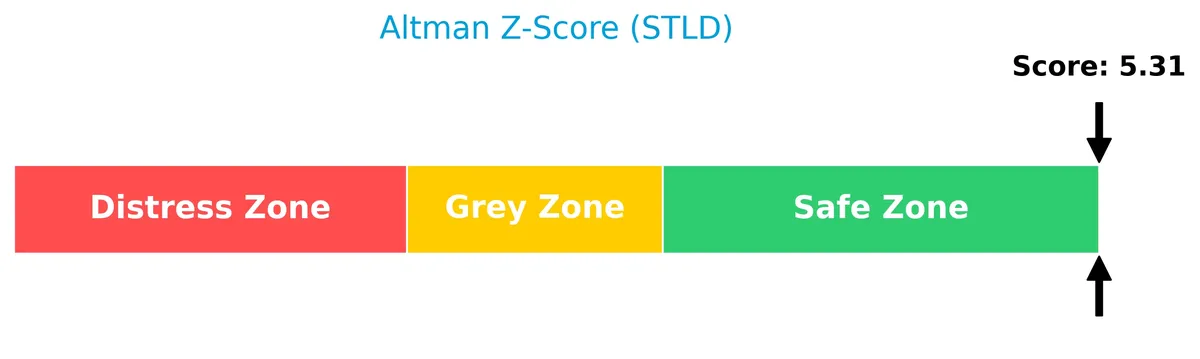
Analysis of the company’s bankruptcy risk
Steel Dynamics’ Altman Z-Score places it comfortably in the safe zone, signaling low bankruptcy risk and financial stability:
Is the company in good financial health?
The Piotroski diagram below illustrates Steel Dynamics’ financial strength based on nine accounting criteria:

With a Piotroski Score of 7, the company demonstrates strong financial health, reflecting solid profitability, efficiency, and moderate risk factors.
Competitive Landscape & Sector Positioning
This analysis reviews Steel Dynamics, Inc.’s market positioning, product segments, and main competitors. I will assess whether Steel Dynamics holds a competitive advantage in the steel sector.
Strategic Positioning
Steel Dynamics, Inc. focuses on a diversified product portfolio across steel operations, metals recycling, and steel fabrication, with 2025 revenues of $13.4B, $4.3B, and $1.4B respectively. The company primarily serves the U.S. market, generating $17B domestically in 2025, with limited international exposure.
Revenue by Segment
This pie chart breaks down Steel Dynamics, Inc.’s revenue by segment for the fiscal year 2025, highlighting the contribution of each business unit to total sales.
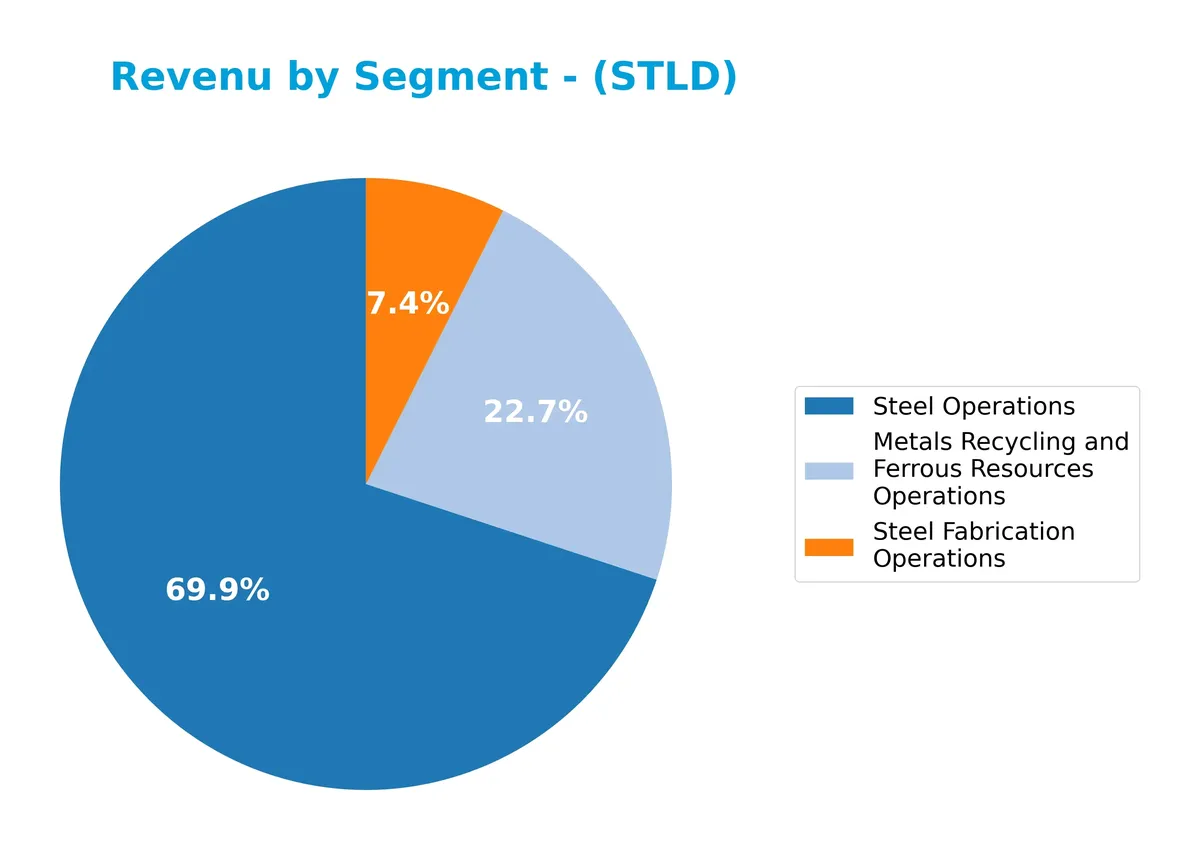
Steel Operations dominate with $13.4B in revenue, underscoring its core role in the business. Metals Recycling and Ferrous Resources Operations contribute a solid $4.3B, showing steady growth since 2024. Steel Fabrication Operations, at $1.4B, represent the smallest segment but remain essential for diversification. The 2025 figures indicate an acceleration in Steel Operations growth, while recycling maintains resilience, signaling balanced segment performance with manageable concentration risk.
Key Products & Brands
Steel Dynamics operates three core segments with diverse steel and metal products:
| Product | Description |
|---|---|
| Steel Operations | Hot roll, cold roll, coated steel products; engineered bars, beams, channels, reinforcing bars, and rails. Includes precision processing and specialty product finishing. Used in construction, automotive, manufacturing, and heavy equipment. |
| Metals Recycling and Ferrous Resources Operations | Purchases, processes, and resells ferrous and nonferrous scrap metals, including steel turnings, aluminum, brass, copper, and stainless steel. Provides logistics, marketing, and scrap management services. |
| Steel Fabrication Operations | Produces non-residential steel building components such as joists, girders, trusses, and steel deck products. |
Steel Dynamics’ product portfolio spans primary steel manufacturing, metal recycling, and steel fabrication, supporting a broad industrial customer base.
Main Competitors
Steel Dynamics, Inc. operates alongside a total of 2 competitors, with the following top 10 leaders by market capitalization:
| Competitor | Market Cap. |
|---|---|
| Nucor Corporation | 38.8B |
| Steel Dynamics, Inc. | 25.7B |
Steel Dynamics ranks 2nd among its peers with a market cap at 73% of the leader, Nucor Corporation. It sits below both the average market cap of the top 10 competitors (32.2B) and the sector median. The company maintains a 37.5% gap to the next larger competitor, highlighting a significant size difference within this small competitive set.
Comparisons with competitors
Check out how we compare the company to its competitors:
Does STLD have a competitive advantage?
Steel Dynamics, Inc. does not present a competitive advantage, as its return on invested capital (ROIC) consistently falls below its weighted average cost of capital (WACC). The company is shedding value with a sharply declining ROIC trend from 2021 to 2025, indicating decreasing profitability.
Looking ahead, Steel Dynamics operates across steel production, metal recycling, and fabrication, serving diverse markets including construction and automotive. Future opportunities may arise from expanding specialty steel products and increasing exports, although current financial metrics suggest ongoing challenges.
SWOT Analysis
This SWOT analysis highlights Steel Dynamics, Inc.’s core strategic factors impacting its current and future performance.
Strengths
- strong market position in US steel production
- diversified operations including recycling and fabrication
- solid liquidity with quick ratio above 1
- favorable interest coverage ratio
Weaknesses
- declining profitability with shrinking ROIC
- unfavorable long-term income growth trends
- high current ratio suggesting inefficient asset use
Opportunities
- expanding US infrastructure spending
- growth potential in metal recycling demand
- increased exports to non-US markets
Threats
- volatile steel prices and raw material costs
- intense industry competition
- regulatory and trade policy risks
Steel Dynamics’ strengths in market presence and operational diversity support resilience. However, persistent profitability erosion demands strategic focus on efficiency and innovation. Capitalizing on infrastructure growth and recycling trends offers upside, but the company must manage commodity volatility and regulatory pressures prudently.
Stock Price Action Analysis
The weekly stock chart of Steel Dynamics, Inc. (STLD) illustrates recent price movements and volatility over the past 12 months:
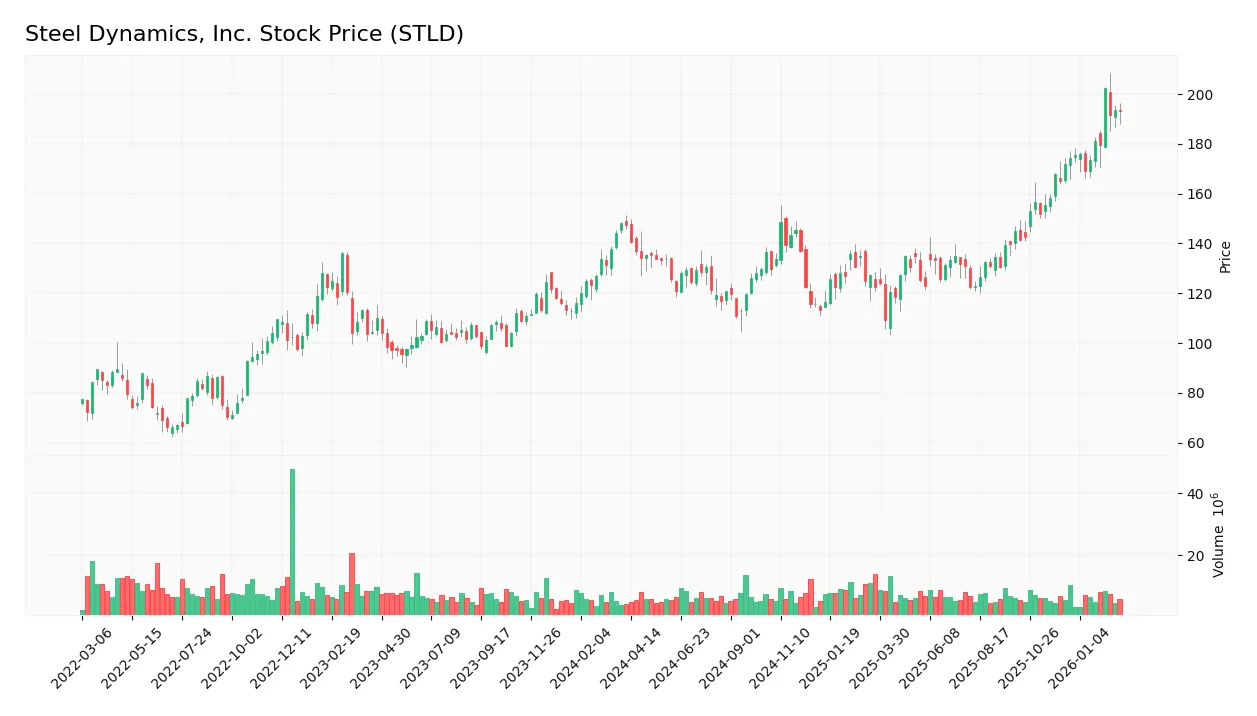
Trend Analysis
Over the past year, STLD’s stock price increased by 31.14%, indicating a bullish trend with clear acceleration. The price ranged from a low of 109.21 to a high of 202.39. The standard deviation of 19.91 suggests notable volatility accompanying the upward momentum.
Volume Analysis
Trading volume for STLD has been increasing, with buyer-driven activity dominating the last three months. Buyers account for 61.96% of volume, signaling strong investor interest and positive market participation during this period. Seller volume has declined comparatively, reinforcing buyer dominance.
Target Prices
Analysts present a confident target consensus for Steel Dynamics, Inc. (STLD).
| Target Low | Target High | Consensus |
|---|---|---|
| 165 | 194 | 179.67 |
The target range reflects optimism about STLD’s growth potential, with consensus signaling upside from current levels.

Don’t Let Luck Decide Your Entry Point
Optimize your entry points with our advanced ProRealTime indicators. You’ll get efficient buy signals with precise price targets for maximum performance. Start outperforming now!
Analyst & Consumer Opinions
This section examines analyst ratings and consumer feedback to gauge market sentiment toward Steel Dynamics, Inc. (STLD).
Stock Grades
Here are the latest verified grades for Steel Dynamics, Inc. from major financial institutions:
| Grading Company | Action | New Grade | Date |
|---|---|---|---|
| Morgan Stanley | Downgrade | Equal Weight | 2026-01-09 |
| Wells Fargo | Maintain | Overweight | 2025-12-15 |
| Jefferies | Maintain | Buy | 2025-12-10 |
| JP Morgan | Maintain | Neutral | 2025-12-05 |
| Wells Fargo | Maintain | Overweight | 2025-11-14 |
| UBS | Downgrade | Neutral | 2025-11-04 |
| Citigroup | Maintain | Buy | 2025-10-29 |
| Keybanc | Maintain | Overweight | 2025-10-27 |
| Morgan Stanley | Maintain | Overweight | 2025-10-24 |
| Jefferies | Maintain | Buy | 2025-10-22 |
The consensus shows a prevailing Buy sentiment, tempered by recent downgrades from Morgan Stanley and UBS. Most firms maintain a neutral to overweight stance, signaling cautious optimism.
Consumer Opinions
Steel Dynamics, Inc. draws mixed reactions from its customer base, reflecting both solid product quality and areas needing improvement.
| Positive Reviews | Negative Reviews |
|---|---|
| Durable steel products with consistent quality. | Delivery delays impacting project timelines. |
| Competitive pricing compared to peers. | Customer service response times are slow. |
| Strong local presence and reliable supply chain. | Occasional issues with order accuracy. |
Overall, consumers praise Steel Dynamics for durable products and competitive pricing. However, delivery delays and service responsiveness remain notable concerns. These issues could affect customer loyalty if not addressed promptly.
Risk Analysis
Below is a detailed table outlining Steel Dynamics, Inc.’s key risk factors and their assessed probability and impact:
| Category | Description | Probability | Impact |
|---|---|---|---|
| Market Volatility | Steel sector’s sensitivity to economic cycles and commodity price fluctuations. | High | High |
| Leverage Risk | Moderate debt-to-equity ratio could pressure financial flexibility if interest rates rise. | Medium | Medium |
| Operational Risk | Dependence on raw material supply and recycling operations subject to regulatory changes. | Medium | High |
| Valuation Risk | Elevated price-to-book and price-to-earnings ratios relative to historical norms in the sector. | Medium | Medium |
| Liquidity Risk | Unfavorable current ratio despite a strong quick ratio suggests potential short-term liquidity concerns. | Low | Medium |
Steel Dynamics faces its biggest challenges from market volatility and operational risks. Steel prices remain unpredictable amid global economic shifts. Despite a safe Altman Z-score and strong Piotroski score, valuation multiples remain stretched relative to peers. I remain cautious about rising input costs and regulatory risks impacting metals recycling.
Should You Buy Steel Dynamics, Inc.?
Steel Dynamics, Inc. appears to be a profitable company with robust operational efficiency but a very unfavorable moat due to declining returns on invested capital. Despite significant leverage concerns, its overall rating is A-, suggesting a cautiously favorable profile.
Strength & Efficiency Pillars
Steel Dynamics, Inc. posts a net margin of 6.52% and a return on equity (ROE) of 13.24%, reflecting moderate profitability. However, its return on invested capital (ROIC) at 8.19% falls short of the weighted average cost of capital (WACC) at 9.37%, indicating the company is currently destroying value rather than creating it. Despite shedding value, operational efficiency remains solid, supported by a strong interest coverage ratio of 22.32 and favorable asset turnover at 1.11.
Weaknesses and Drawbacks
The company shows no signs of financial distress with an Altman Z-Score safely above 5.31, but valuation metrics raise concerns. The price-to-earnings ratio of 21.13 and price-to-book ratio of 2.8 suggest a premium valuation that may limit upside. A high current ratio of 3.06 signals potential inefficient working capital management. While debt-to-equity at 0.47 is favorable, moderate leverage and valuation caution investors amid the mixed margin trends and declining profitability.
Our Final Verdict about Steel Dynamics, Inc.
Steel Dynamics, Inc. may appear attractive for long-term exposure given its bullish stock trend and strong buyer dominance at 61.96%. However, the company’s inability to generate returns above its cost of capital and shrinking profitability metrics suggest caution. Investors should weigh operational strengths against value destruction risks and premium valuation before committing capital.
Disclaimer: This content is for informational purposes only and does not constitute financial, investment, or other professional advice. Investing in financial markets involves a significant risk of loss, and past performance is not indicative of future results.
Additional Resources
- STLD SEC Filings – Steel Dynamics Inc 10-K, 10-Q, 8-K Forms – Stock Titan (Feb 28, 2026)
- STEEL DYNAMICS INC SEC 10-K Report – TradingView (Feb 27, 2026)
- Intech Investment Management LLC Increases Position in Steel Dynamics, Inc. $STLD – MarketBeat (Feb 27, 2026)
- Steel Dynamics Raises Dividend 6% on Cash Generation Strength – Nasdaq (Feb 27, 2026)
- Does Steel Dynamics’ Higher 2026 Dividend Reveal a Deeper Capital Allocation Shift for STLD? – simplywall.st (Feb 27, 2026)
For more information about Steel Dynamics, Inc., please visit the official website: stld.steeldynamics.com