Home > Analyses > Consumer Cyclical > Starbucks Corporation
Starbucks Corporation transforms daily routines worldwide by delivering a consistent, premium coffee experience that millions seek every day. As a dominant force in the global specialty coffee industry, Starbucks leads with its renowned brands and innovative product offerings, spanning from handcrafted beverages to premium packaged goods. Its extensive footprint and commitment to quality have cemented its reputation as an industry icon. But as market dynamics evolve, I ask: does Starbucks’ current valuation accurately reflect its future growth potential and operational resilience?
Table of contents
Business Model & Company Overview
Starbucks Corporation, founded in 1971 and headquartered in Seattle, WA, leads the global specialty coffee industry with a vast ecosystem of branded products and services. Operating over 33,800 stores worldwide under brands like Starbucks, Teavana, and Seattle’s Best Coffee, it integrates premium coffee, tea, and food offerings to deliver a cohesive customer experience. This core business spans company-operated and licensed stores, emphasizing quality and brand consistency across North America and international markets.
The company’s revenue engine is powered by a balanced mix of retail sales, licensed stores, and branded consumer packaged goods, creating recurring streams from both hardware (store infrastructure) and consumables (beverages and food). Its strategic footprint across the Americas, Europe, and Asia fuels growth and diversification. Starbucks’ competitive advantage lies in its expansive global reach combined with a strong brand, creating a durable economic moat that shapes the future of the specialty coffee market.
Financial Performance & Fundamental Metrics
This section analyzes Starbucks Corporation’s income statement, key financial ratios, and dividend payout policy to assess its overall financial health and shareholder returns.
Income Statement
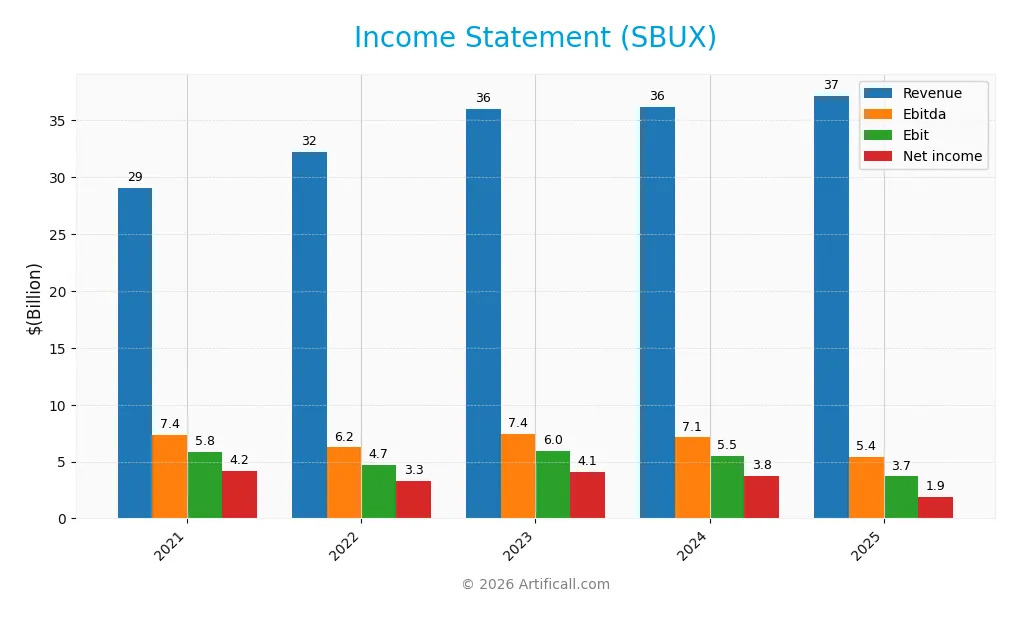
The table below summarizes Starbucks Corporation’s key income statement figures for the fiscal years 2021 through 2025, in USD.
| 2021 | 2022 | 2023 | 2024 | 2025 | |
|---|---|---|---|---|---|
| Revenue | 29.06B | 32.25B | 35.98B | 36.18B | 37.18B |
| Cost of Revenue | 20.67B | 23.88B | 26.13B | 26.47B | 28.20B |
| Operating Expenses | 3.52B | 3.75B | 3.98B | 4.30B | 5.40B |
| Gross Profit | 8.39B | 8.37B | 9.85B | 9.71B | 8.98B |
| EBITDA | 7.35B | 6.24B | 7.40B | 7.12B | 5.38B |
| EBIT | 5.83B | 4.71B | 5.95B | 5.53B | 3.69B |
| Interest Expense | 470M | 483M | 550M | 562M | 543M |
| Net Income | 4.20B | 3.28B | 4.12B | 3.76B | 1.86B |
| EPS | 3.57 | 2.85 | 3.60 | 3.31 | 1.63 |
| Filing Date | 2021-11-19 | 2022-11-18 | 2023-11-17 | 2024-11-20 | 2025-11-14 |
Income Statement Evolution
Between 2021 and 2025, Starbucks’ revenue increased by 27.95%, demonstrating overall growth, though the pace slowed to 2.79% in the most recent year. Net income declined notably by 55.79% over the period, with a sharp 51.98% drop in the last year. Gross margin remained favorable at 24.15%, but EBIT and net margins stayed neutral, reflecting pressure on profitability.
Is the Income Statement Favorable?
The 2025 income statement shows a revenue of $37.2B but a reduced net income of $1.86B, cutting net margin to 4.99%. EBIT margin is steady at 9.93%, and interest expense is well-contained at 1.46% of revenue. Despite solid gross margins, the significant declines in earnings and margins indicate unfavorable fundamentals, with most growth and profitability metrics under pressure.
Financial Ratios
The following table summarizes key financial ratios for Starbucks Corporation over the last five fiscal years, providing a snapshot of profitability, liquidity, leverage, and market valuation:
| Ratios | 2021 | 2022 | 2023 | 2024 | 2025 |
|---|---|---|---|---|---|
| Net Margin | 14% | 10% | 11% | 10% | 5.0% |
| ROE | -79% | -38% | -52% | -50% | -23% |
| ROIC | 15% | 16% | 19% | 16% | 8.5% |
| P/E | 31 | 30 | 25 | 29 | 53 |
| P/B | -24 | -11 | -13 | -15 | -12 |
| Current Ratio | 1.20 | 0.77 | 0.78 | 0.75 | 0.72 |
| Quick Ratio | 1.00 | 0.53 | 0.59 | 0.56 | 0.51 |
| D/E | -4.4 | -2.7 | -3.1 | -3.5 | -3.3 |
| Debt-to-Assets | 75% | 85% | 84% | 82% | 83% |
| Interest Coverage | 10.4 | 9.6 | 11 | 9.6 | 6.6 |
| Asset Turnover | 0.93 | 1.15 | 1.22 | 1.15 | 1.16 |
| Fixed Asset Turnover | 2.0 | 2.2 | 2.3 | 2.0 | 2.1 |
| Dividend Yield | 1.6% | 2.3% | 2.3% | 2.3% | 2.8% |
Evolution of Financial Ratios
From 2021 to 2025, Starbucks Corporation’s Return on Equity (ROE) showed a steep decline, turning negative at -22.93% in 2025, indicating deteriorating profitability from shareholders’ perspective. The Current Ratio decreased steadily, falling below 1.0 to 0.72 in 2025, signaling tighter liquidity. The Debt-to-Equity Ratio remained negative, reflecting an unconventional capital structure, yet showed a favorable status in 2025.
Are the Financial Ratios Favorable?
In 2025, Starbucks’ profitability ratios such as net margin (4.99%) and ROE (-22.93%) were unfavorable, contrasting with a neutral return on invested capital (8.48%). Liquidity ratios, including current (0.72) and quick ratios (0.51), were also unfavorable. Conversely, leverage indicated by debt-to-equity (-3.29) and interest coverage (6.81) was favorable. Asset turnover (1.16) and dividend yield (2.84%) were positive, leading to a neutral overall financial ratios evaluation.
Shareholder Return Policy
Starbucks pays consistent dividends with a payout ratio above 100% in 2025, supported by a 2.84% yield and share buybacks. Dividend coverage by free cash flow is moderate, indicating potential risk if earnings fluctuate. The dividend per share has steadily increased over recent years.
This payout approach, combined with buybacks, suggests management prioritizes returning capital but may stretch cash flow coverage. The sustainability of returns depends on maintaining profitability and cash flow, critical for long-term shareholder value amid these payout levels.
Score analysis
The following radar chart displays an overview of Starbucks Corporation’s key financial scores for investor evaluation:
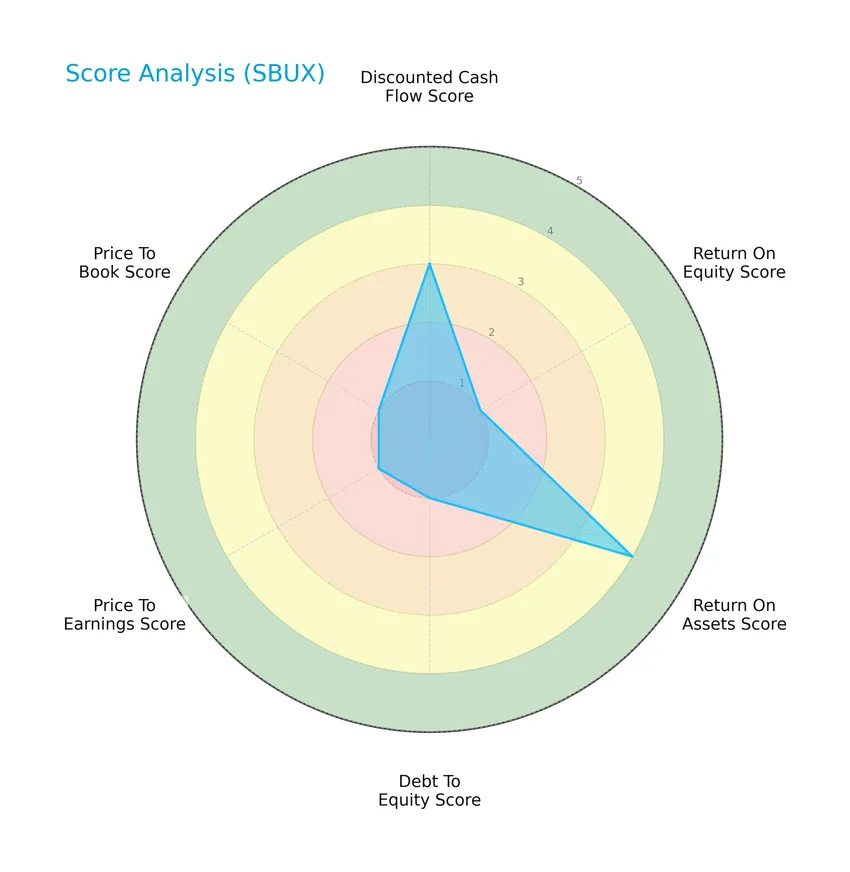
Starbucks shows a moderate discounted cash flow score of 3 and a favorable return on assets score of 4. However, the return on equity, debt to equity, price to earnings, and price to book scores are all very unfavorable at 1, indicating challenges in profitability and valuation metrics.
Analysis of the company’s bankruptcy risk
Starbucks currently falls within the Altman Z-Score grey zone, indicating a moderate risk of bankruptcy with some financial caution warranted:

Is the company in good financial health?
The Piotroski Score diagram summarizes Starbucks’ financial health based on nine accounting criteria:
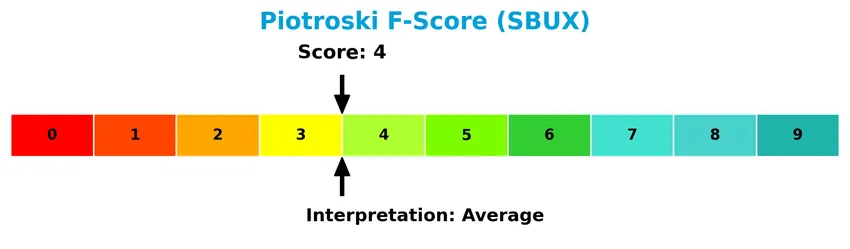
With a Piotroski Score of 4, Starbucks is assessed as having average financial strength, suggesting some room for improvement in profitability and operational efficiency.
Competitive Landscape & Sector Positioning
This sector analysis will examine Starbucks Corporation’s strategic positioning, revenue by segment, key products, and main competitors. I will also assess whether Starbucks holds a competitive advantage in its industry.
Strategic Positioning
Starbucks maintains a diversified product portfolio with a strong focus on beverages ($22.5B in 2025), complemented by food ($7B) and other products ($7.6B). Geographically, it balances substantial revenue from the U.S. ($27.1B) with significant international operations, including China ($3.2B) and other markets ($6.9B).
Revenue by Segment
This pie chart illustrates Starbucks Corporation’s revenue distribution by product segment for the fiscal year 2025, highlighting the contributions of Beverage, Food, and Other Products.
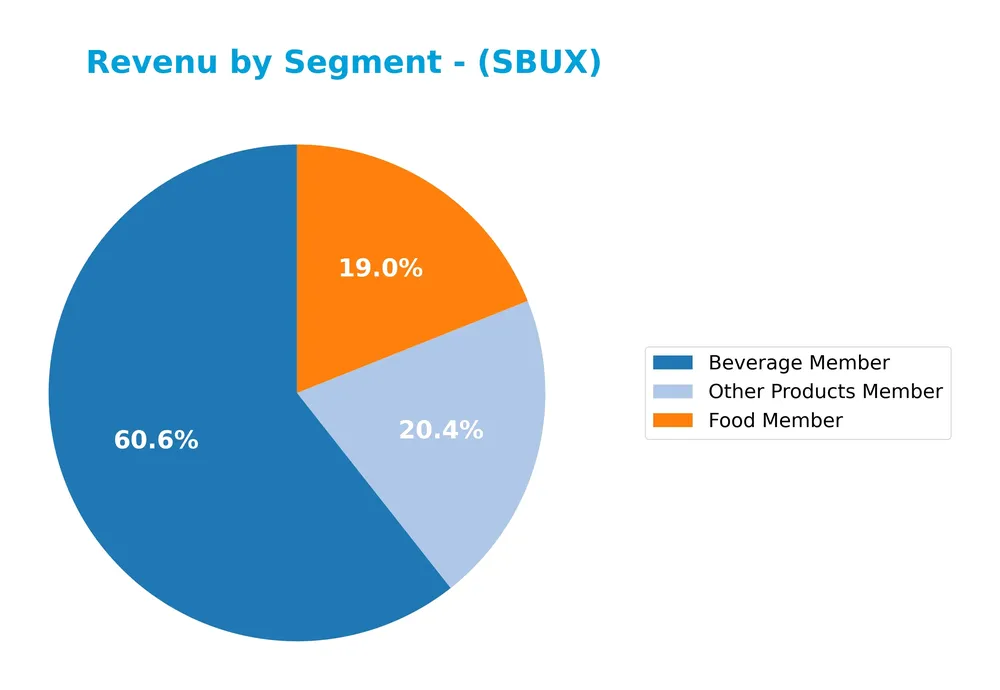
In 2025, Starbucks’ revenue remains heavily driven by the Beverage segment, generating $22.5B, showing steady growth from $21.7B in 2023. Food and Other Products contribute $7.0B and $7.6B respectively, both exhibiting moderate increases over recent years. The steady expansion in Beverage revenue alongside consistent contributions from Food and Other Products suggests a balanced portfolio with no significant concentration risk, reflecting stable demand and diversified product appeal.
Key Products & Brands
The table below presents Starbucks Corporation’s key products and brands with their descriptions:
| Product | Description |
|---|---|
| Beverage Member | Coffee and tea beverages served in stores, including specialty drinks and ready-to-drink options. |
| Food Member | Various food products such as pastries, breakfast sandwiches, and lunch items sold in stores. |
| Other Products Member | Includes roasted whole beans, ground coffees, single-serve products, and other merchandise. |
| Starbucks | The flagship brand offering a wide range of coffee and tea beverages globally. |
| Teavana | Brand specializing in premium teas and tea-related products. |
| Seattle’s Best Coffee | Coffee brand focused on smooth, approachable blends. |
| Evolution Fresh | Brand offering cold-pressed juices and related beverages. |
| Ethos | Bottled water brand supporting clean water initiatives. |
| Starbucks Reserve | Premium line focusing on rare and small-lot coffees. |
| Princi | Bakery brand offering artisanal baked goods in select stores. |
Starbucks generates significant revenue primarily from its beverage and food offerings, supported by diversified brands that extend its reach in specialty coffee, tea, and complementary products worldwide.
Main Competitors
There are 6 main competitors in the sector, with the table below listing the top 6 leaders by market capitalization:
| Competitor | Market Cap. |
|---|---|
| McDonald’s Corporation | 217B |
| Starbucks Corporation | 95.5B |
| Chipotle Mexican Grill, Inc. | 50.6B |
| Yum! Brands, Inc. | 41.8B |
| Darden Restaurants, Inc. | 21.8B |
| Domino’s Pizza, Inc. | 14.4B |
Starbucks ranks 2nd among its competitors, holding 51.23% of the market cap of the top player, McDonald’s. It stands above both the average market cap of the top 10 competitors (73.5B) and the median market cap of the sector (46.2B). The company is significantly ahead of its closest rival below by 119.49%.
Comparisons with competitors
Check out how we compare the company to its competitors:
Does SBUX have a competitive advantage?
Starbucks Corporation currently does not present a clear competitive advantage, as its return on invested capital (ROIC) falls below its weighted average cost of capital (WACC), indicating value shedding and a declining profitability trend. The overall moat status is slightly unfavorable, reflecting challenges in sustaining value creation despite its size and global presence.
Looking ahead, Starbucks has opportunities to expand through its diverse product portfolio and broad geographic reach, particularly in international markets including China, where revenue growth has been steady. The company’s focus on specialty coffee and brand licensing could support future growth, although recent financial trends urge caution regarding profitability sustainability.
SWOT Analysis
This SWOT analysis highlights the key internal and external factors affecting Starbucks Corporation to inform investment decisions.
Strengths
- Strong global brand recognition
- Extensive store network with 33,833 locations
- Diversified product portfolio including premium and ready-to-drink beverages
Weaknesses
- Declining profitability with net margin under 5%
- High debt levels with 83% debt-to-assets ratio
- Negative return on equity at -22.93%
Opportunities
- Expansion in emerging markets like China with $3.16B revenue
- Growth potential in ready-to-drink and digital channels
- Increasing consumer demand for specialty coffee and sustainability
Threats
- Intense competition in global coffee and restaurant markets
- Economic downturns impacting discretionary spending
- Rising commodity and labor costs affecting margins
Starbucks maintains a strong brand and global footprint but faces profitability and leverage challenges. Strategic focus on international growth and innovation is essential to offset margin pressures and competitive threats.
Stock Price Action Analysis
The weekly stock chart for Starbucks Corporation (SBUX) over the past 12 months reveals evolving price dynamics and notable volatility:

Trend Analysis
Over the past 12 months, Starbucks’ stock price increased by 4.79%, indicating a bullish trend with acceleration. The price moved between a low of 73.11 and a high of 115.81, displaying significant volatility with a standard deviation of 8.86. Recent months show a stronger upward slope.
Volume Analysis
Trading volume is increasing, with buyer activity dominating at 55.54% overall, rising to 71.81% in the last three months. This strongly buyer-driven volume suggests heightened investor confidence and increased market participation during this period.
Target Prices
The consensus target prices for Starbucks Corporation reflect a moderate range of expectations among analysts.
| Target High | Target Low | Consensus |
|---|---|---|
| 165 | 86 | 106.58 |
Analysts foresee a potential upside to 165, with downside risk near 86, settling on an average expectation around 106.58, indicating cautious optimism.

Don’t Let Luck Decide Your Entry Point
Optimize your entry points with our advanced ProRealTime indicators. You’ll get efficient buy signals with precise price targets for maximum performance. Start outperforming now!
Analyst & Consumer Opinions
This section examines the latest analyst ratings and consumer feedback regarding Starbucks Corporation’s performance and reputation.
Stock Grades
Here is the latest summary of Starbucks Corporation’s stock grades from reputable financial analysts:
| Grading Company | Action | New Grade | Date |
|---|---|---|---|
| William Blair | Upgrade | Outperform | 2026-01-23 |
| BTIG | Maintain | Buy | 2026-01-22 |
| B of A Securities | Maintain | Buy | 2026-01-21 |
| Citigroup | Maintain | Neutral | 2026-01-15 |
| BWG Global | Upgrade | Positive | 2026-01-15 |
| Mizuho | Maintain | Neutral | 2026-01-09 |
| Barclays | Maintain | Overweight | 2026-01-07 |
| TD Cowen | Maintain | Hold | 2025-12-01 |
| BTIG | Maintain | Buy | 2025-11-04 |
| Citigroup | Maintain | Neutral | 2025-10-30 |
The overall trend shows a predominance of buy and neutral ratings, with some recent upgrades indicating cautious optimism among analysts. The consensus remains positive, balancing growth expectations with moderate risk considerations.
Consumer Opinions
Starbucks Corporation continues to evoke strong feelings among its customers, reflecting a mix of loyalty and areas for improvement.
| Positive Reviews | Negative Reviews |
|---|---|
| Consistently high-quality coffee and beverage variety | Wait times can be long during peak hours |
| Friendly and knowledgeable staff | Prices are perceived as high compared to competitors |
| Comfortable store ambiance suitable for work or meetups | Occasional inconsistency in order accuracy |
| Strong commitment to sustainability and ethical sourcing | Limited healthier food options |
Overall, consumer feedback highlights Starbucks’ strengths in product quality and customer experience, while concerns focus on pricing and service speed. Addressing these issues could enhance customer satisfaction further.
Risk Analysis
Below is a table summarizing key risks facing Starbucks Corporation, including their likelihood and potential impact:
| Category | Description | Probability | Impact |
|---|---|---|---|
| Financial Health | Elevated debt-to-assets ratio (83.11%) and weak return on equity (-22.93%) | High | High |
| Profitability | Low net margin at 4.99% and high P/E ratio (52.58) indicate earnings pressure | High | Medium |
| Liquidity | Current ratio (0.72) and quick ratio (0.51) below 1 signal liquidity risks | Medium | Medium |
| Market Valuation | Unfavorable valuation metrics such as negative price-to-book (-12.06) | Medium | Medium |
| Bankruptcy Risk | Altman Z-Score in grey zone (2.71), indicating moderate financial distress | Medium | High |
| Competitive Market | Intense competition in coffee retail impacts growth and margins | Medium | Medium |
The most significant risks for Starbucks are its high leverage and weak equity returns, which elevate financial vulnerability despite stable operational metrics. The company’s Altman Z-Score suggests moderate bankruptcy risk, warranting cautious monitoring amid competitive and macroeconomic pressures.
Should You Buy Starbucks Corporation?
Starbucks appears to present a profile of moderate operational efficiency with a slightly unfavorable competitive moat as ROIC is declining and below WACC. Despite substantial leverage and mixed profitability signals, the overall rating of C suggests cautious value creation potential.
Strength & Efficiency Pillars
Starbucks Corporation shows moderate financial health with an Altman Z-Score of 2.71, placing it in the grey zone, indicating some risk but no immediate distress. The Piotroski Score of 4 suggests average financial strength. Despite a neutral 8.48% ROIC slightly above its 7.31% WACC, Starbucks is a marginal value creator. Operational efficiency is supported by a favorable gross margin of 24.15%, a strong interest coverage ratio of 6.81, and a solid asset turnover of 1.16, reflecting adequate capital utilization.
Weaknesses and Drawbacks
Significant concerns arise from Starbucks’ profitability and valuation metrics. The company posts an unfavorable net margin of 4.99% and a negative return on equity at -22.93%, signaling weak profitability and shareholder returns. Its price-to-earnings ratio of 52.58 is notably high, implying an expensive valuation that might limit upside. Liquidity ratios are poor, with a current ratio of 0.72 and quick ratio of 0.51, indicating potential short-term financial stress. Additionally, a high debt-to-assets ratio at 83.11% raises leverage risks, while negative price-to-book ratio may reflect accounting or market perception issues.
Our Verdict about Starbucks Corporation
The long-term fundamental profile of Starbucks may appear mixed to slightly unfavorable given weak profitability and valuation challenges. However, the bullish overall stock trend with accelerating price gains and strong buyer dominance in recent months suggests growing market confidence. Despite this, the company’s financial drawbacks and moderate value creation suggest a wait-and-see approach might be prudent for investors seeking a better entry point amid recent strong demand.
Disclaimer: This content is for informational purposes only and does not constitute financial, investment, or other professional advice. Investing in financial markets involves a significant risk of loss, and past performance is not indicative of future results.
Additional Resources
- Is There Now An Opportunity In Starbucks Corporation (NASDAQ:SBUX)? – Yahoo Finance (Jan 21, 2026)
- Starbucks Investor Day and FQ1 to spotlight turnaround progress (SBUX:NASDAQ) – Seeking Alpha (Jan 23, 2026)
- Starbucks to Host 2026 Investor Day on January 29, 2026 – Business Wire (Jan 22, 2026)
- Universal Beteiligungs und Servicegesellschaft mbH Acquires 36,583 Shares of Starbucks Corporation $SBUX – MarketBeat (Jan 21, 2026)
- Starbucks (SBUX) expected to report mixed results in Q1 2026 – AlphaStreet (Jan 23, 2026)
For more information about Starbucks Corporation, please visit the official website: starbucks.com