Home > Analyses > Industrials > Stanley Black & Decker, Inc.
Stanley Black & Decker powers the tools that build and maintain modern life. Its professional-grade power tools and industrial fastening systems set benchmarks in manufacturing and construction. Renowned for innovation and unmatched quality, the company shapes industries from aerospace to home improvement. As market dynamics evolve, I question whether Stanley Black & Decker’s solid fundamentals still support its current valuation and growth outlook in 2026.

Table of contents
Business Model & Company Overview
Stanley Black & Decker, Inc. is a leading player in the manufacturing of tools and accessories, founded in 1843 and headquartered in New Britain, Connecticut. The company unites professional and consumer-grade power tools, hand tools, and storage solutions into a cohesive ecosystem that serves diverse markets from construction to home improvement. Its legacy spans nearly two centuries, with a strong footprint in both industrial and consumer segments.
The company’s revenue engine balances sales of electric power tools and engineered fastening systems across the Americas, Europe, and Asia. It generates value through a mix of direct sales, distributors, and retail partnerships that target professional users and industrial clients alike. Stanley Black & Decker’s enduring competitive advantage lies in its integrated product range and global reach, shaping the future of industrial tools and storage worldwide.
Financial Performance & Fundamental Metrics
I analyze Stanley Black & Decker’s income statement, key financial ratios, and dividend payout policy to assess its profitability, efficiency, and shareholder returns.
Income Statement
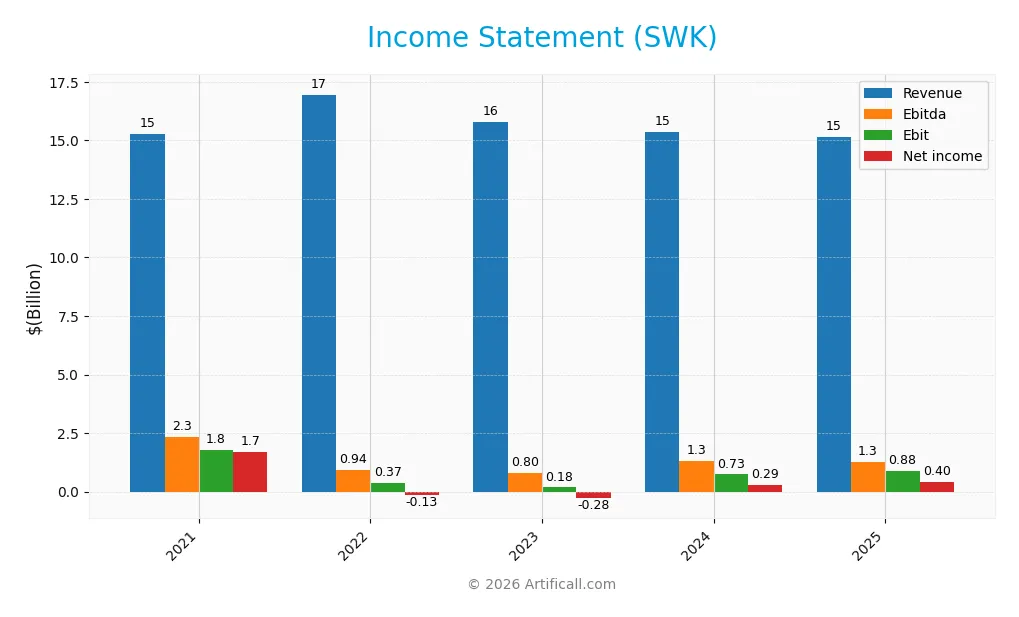
The table below presents Stanley Black & Decker, Inc.’s income statement for fiscal years 2021 through 2025 in USD, highlighting key profitability and expense metrics.
| 2021 | 2022 | 2023 | 2024 | 2025 | |
|---|---|---|---|---|---|
| Revenue | 15.3B | 16.9B | 15.8B | 15.4B | 15.1B |
| Cost of Revenue | 10.2B | 12.8B | 11.7B | 10.8B | 10.6B |
| Operating Expenses | 3.0B | 3.2B | 3.2B | 3.3B | 3.4B |
| Gross Profit | 5.1B | 4.1B | 4.1B | 4.6B | 4.5B |
| EBITDA | 2.3B | 943M | 803M | 1.3B | 1.3B |
| EBIT | 1.8B | 371M | 178M | 734M | 880M |
| Interest Expense | 185M | 339M | 559M | 499M | 465M |
| Net Income | 1.7B | -134M | -282M | 286M | 402M |
| EPS | 10.55 | 7.13 | -2.07 | 1.96 | 2.65 |
| Filing Date | 2022-02-22 | 2023-02-23 | 2024-02-27 | 2025-02-18 | 2026-02-24 |
Income Statement Evolution
Stanley Black & Decker’s revenue declined slightly by 1.53% in 2025, continuing a near 1% overall drop since 2021. Gross profit also fell by 1.81% last year. However, EBIT rose 20%, and net margin expanded 42.56%, signaling improved operational efficiency despite stagnant top-line growth. Margins show mixed stability with gross margin at a favorable 29.86% and EBIT margin neutral at 5.82%.
Is the Income Statement Favorable?
In 2025, fundamentals present a mixed picture. The company posted a modest net margin of 2.66%, deemed neutral, with interest expense favorably low at 3.07%. Earnings per share grew 35.9%, reflecting better profitability. Yet, revenue and net income trends remain weak over the multi-year span, dragging the overall income statement evaluation toward an unfavorable stance.
Financial Ratios
The table below presents key financial ratios for Stanley Black & Decker, Inc. from 2021 through 2025, reflecting profitability, valuation, liquidity, leverage, and efficiency metrics:
| Ratios | 2021 | 2022 | 2023 | 2024 | 2025 |
|---|---|---|---|---|---|
| Net Margin | 11.1% | -0.8% | -1.8% | 1.9% | 2.7% |
| ROE | 14.6% | -1.4% | -3.1% | 3.3% | 4.4% |
| ROIC | 9.2% | 4.4% | 3.6% | 7.7% | 7.2% |
| P/E | 17.7 | -83.3 | -52.1 | 42.4 | 28.8 |
| P/B | 2.58 | 1.15 | 1.62 | 1.39 | 1.28 |
| Current Ratio | 0.97 | 1.21 | 1.19 | 1.30 | 1.14 |
| Quick Ratio | 0.35 | 0.32 | 0.39 | 0.37 | 0.35 |
| D/E | 0.58 | 0.78 | 0.81 | 0.76 | 0.65 |
| Debt-to-Assets | 24% | 30% | 31% | 30% | 28% |
| Interest Coverage | 11.2 | 2.7 | 1.6 | 2.7 | 2.5 |
| Asset Turnover | 0.54 | 0.68 | 0.67 | 0.70 | 0.71 |
| Fixed Asset Turnover | 6.5 | 7.2 | 7.3 | 7.6 | 8.3 |
| Dividend Yield | 1.6% | 4.2% | 3.3% | 4.1% | 4.3% |
Evolution of Financial Ratios
Return on Equity (ROE) declined sharply from 14.6% in 2021 to 4.4% in 2025, reflecting weakening profitability. The Current Ratio showed moderate fluctuation, ending near 1.14, indicating stable but modest liquidity. Debt-to-Equity Ratio decreased from 0.81 in 2023 to 0.65 in 2025, signaling a slight reduction in leverage over the period.
Are the Financial Ratios Favorable?
Profitability ratios, including net margin (2.66%) and ROE (4.44%), remain unfavorable, signaling weak earnings generation. Liquidity is mixed, with a neutral Current Ratio (1.14) but unfavorable Quick Ratio (0.35). Leverage metrics are neutral to favorable, with Debt-to-Assets at 27.6% considered healthy. Market valuation shows a high P/E of 28.8 (unfavorable), while Price-to-Book at 1.28 is favorable. Overall, the ratios lean slightly unfavorable.
Shareholder Return Policy
Stanley Black & Decker maintains a dividend payout ratio above 100%, with a dividend per share rising to $3.31 in 2025 and a yield of 4.3%. The company supports distributions with free cash flow and engages in share buybacks, though high payout ratios could pressure sustainability.
The dividend and buyback approach aligns with shareholder value creation if cash flow remains strong. However, the consistently high payout ratio signals risk if earnings or free cash flow decline, requiring close monitoring of capital allocation and balance sheet health.
Score analysis
The following radar chart illustrates Stanley Black & Decker’s key financial scores across valuation, profitability, and leverage metrics:
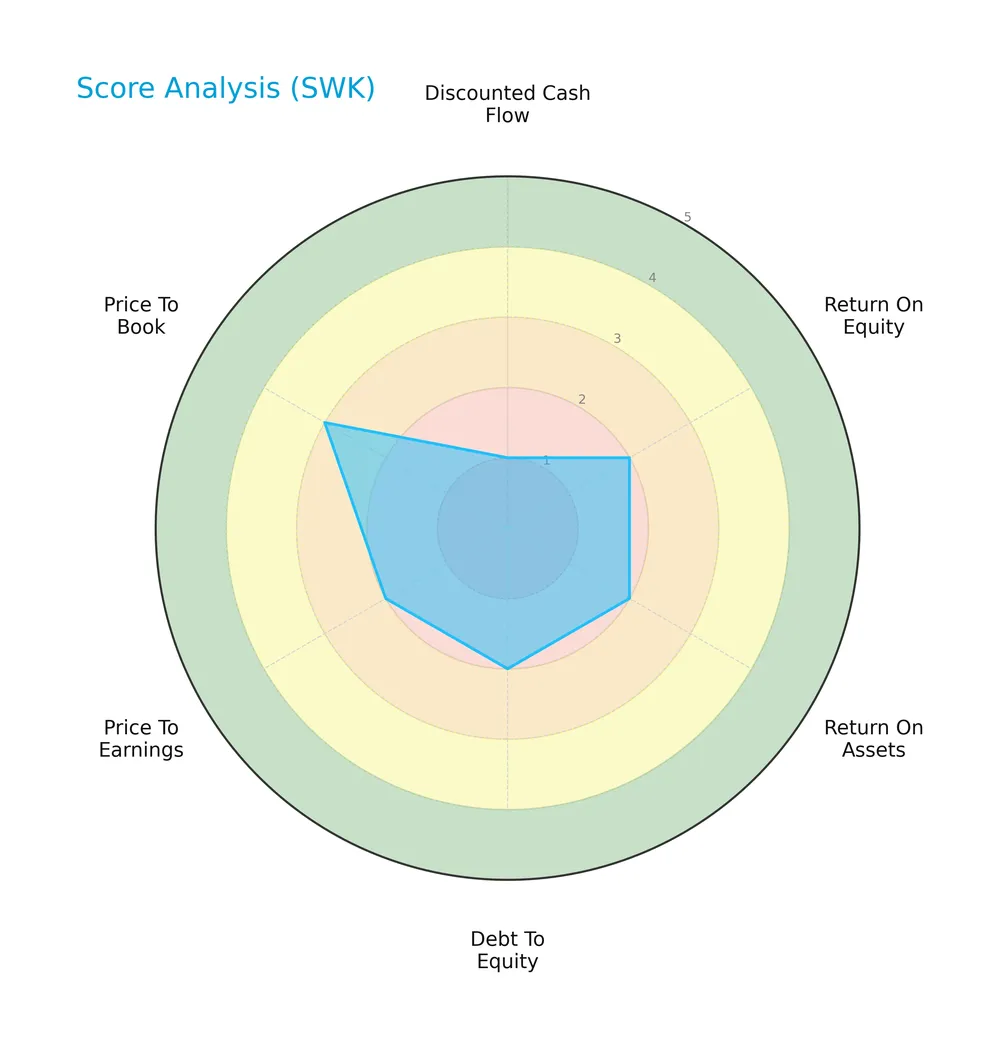
The discounted cash flow score is favorable at 4, but profitability scores for ROE and ROA are both unfavorable at 2. The debt-to-equity and price-to-earnings scores also remain unfavorable at 2, while the price-to-book score shows moderate strength at 3.
Analysis of the company’s bankruptcy risk
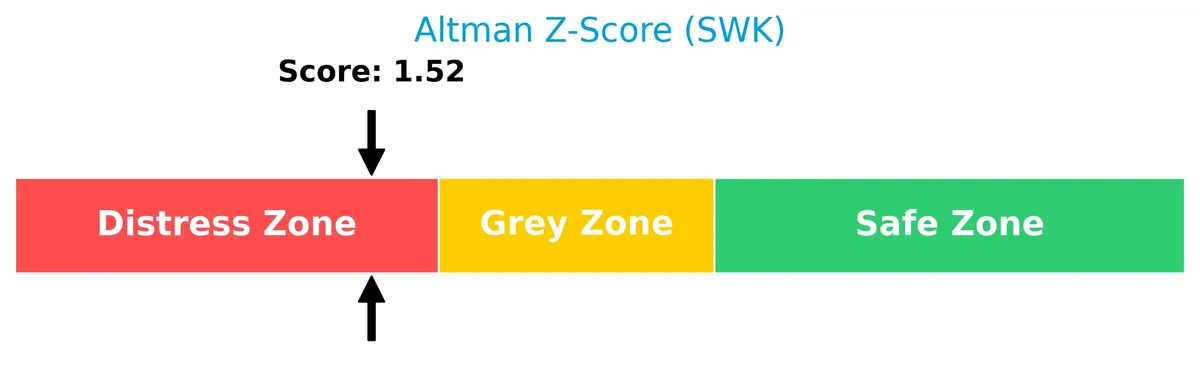
The Altman Z-Score places the company in the distress zone, indicating a high risk of financial distress and potential bankruptcy:
Is the company in good financial health?
The Piotroski Score diagram provides insight into the company’s financial strength:
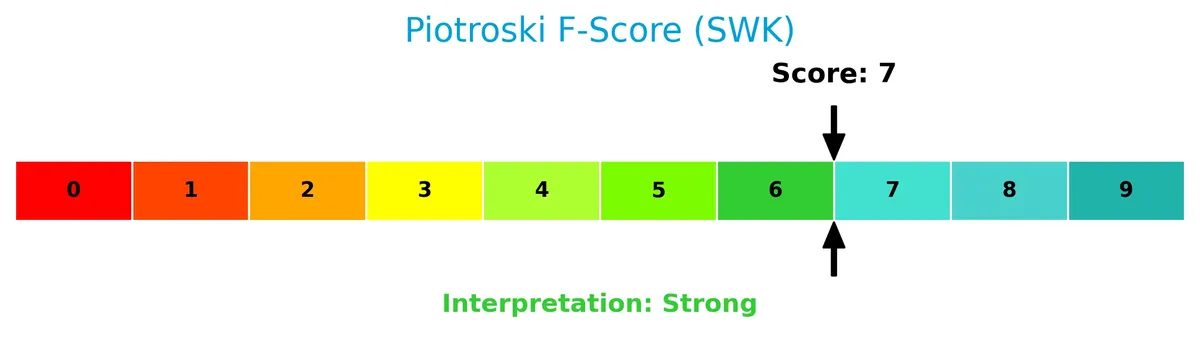
With a score of 7, Stanley Black & Decker demonstrates strong financial health, suggesting robust profitability, liquidity, and operational efficiency despite other risks.
Competitive Landscape & Sector Positioning
This sector analysis examines Stanley Black & Decker’s strategic positioning, revenue segments, and key products. I will assess whether the company holds a competitive advantage over its main competitors.
Strategic Positioning
Stanley Black & Decker concentrates on tools, storage, and industrial equipment with two main segments: Tools & Storage and Industrial. Its geographic exposure spans the US, Europe, Asia, and the Americas, with the US dominating revenues near 9.3B in 2025, emphasizing strong domestic market reliance.
Revenue by Segment
This pie chart illustrates Stanley Black & Decker’s revenue breakdown by segment, focusing on the fiscal year 2024.
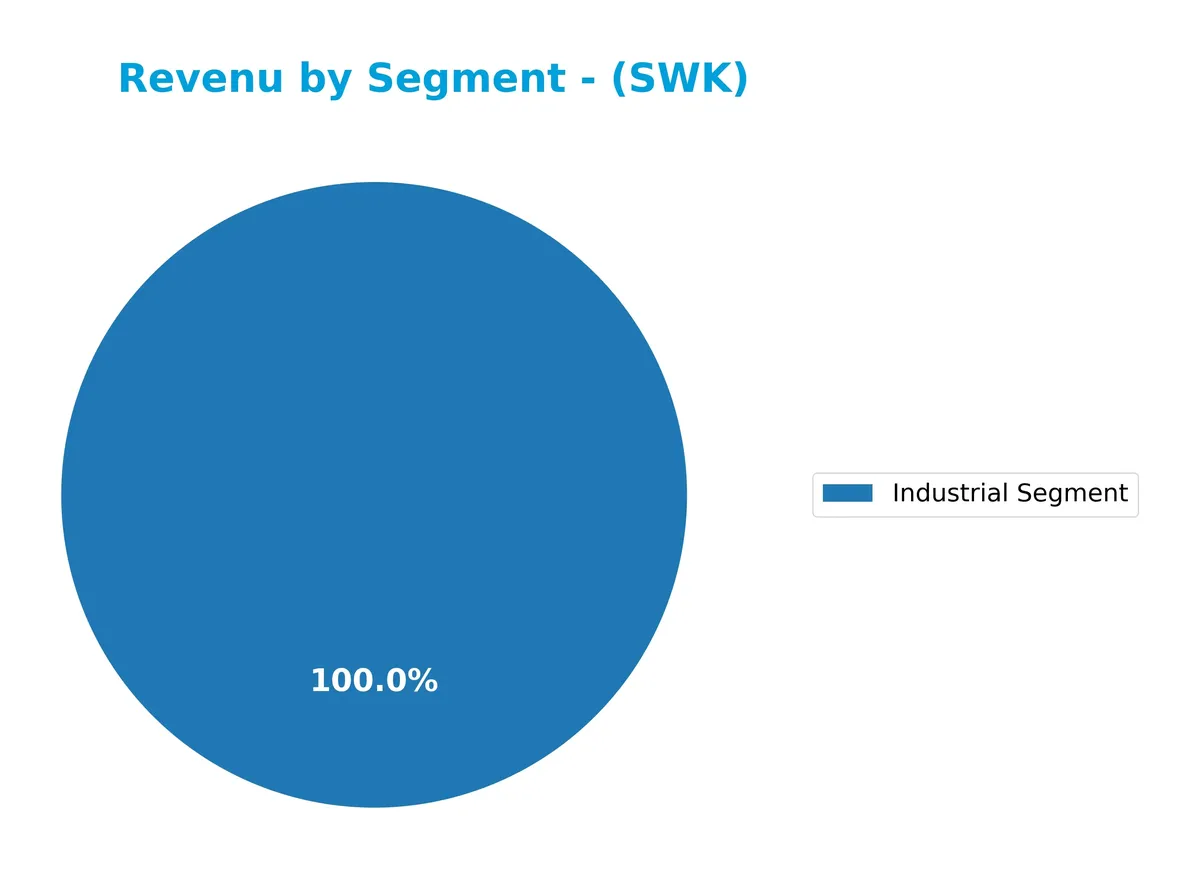
Stanley Black & Decker’s revenue centers on two main segments: Industrial and Construction & Do It Yourself. The Industrial Segment generated 2.06B in 2024, showing a decline from prior years. The Construction segment, historically dominant, peaked at over 12.8B in 2021 but is absent in recent years’ data, indicating potential reporting changes or strategic shifts. The latest figures suggest concentration risk as Industrial revenue contracts.
Key Products & Brands
Stanley Black & Decker’s main products and brands span tools, storage, and industrial equipment segments:
| Product | Description |
|---|---|
| Professional Power Tools | Corded and cordless electric power tools and pneumatic tools for professional users. |
| Consumer Power Tools | Corded and cordless electric tools under the BLACK+DECKER brand, including lawn and garden products. |
| Hand Tools & Accessories | Hand tools, power tool accessories, and storage products for consumers and industrial customers. |
| Engineered Fastening Systems | Fastening products serving automotive, manufacturing, electronics, aerospace, and construction industries. |
| Pipeline Equipment & Services | Custom pipe handling, welding, coating equipment, and pipeline inspection services for oil and gas sectors. |
| Hydraulic Tools & Heavy Equipment Attachments | Hydraulic tools and heavy equipment attachments for industrial applications. |
| Automatic Doors | Automatic door systems sold to commercial customers. |
Stanley Black & Decker leverages a broad portfolio targeting both professional and consumer markets. Its industrial products address specialized sectors like automotive and pipeline construction, complementing its strong consumer-facing brands.
Main Competitors
There are 3 competitors in the Industrials sector; the table lists the top 3 leaders by market capitalization:
| Competitor | Market Cap. |
|---|---|
| Snap-on Incorporated | 18.3B |
| Lincoln Electric Holdings, Inc. | 13.2B |
| Stanley Black & Decker, Inc. | 11.8B |
Stanley Black & Decker ranks 3rd among its competitors with a market cap at 75% of the leader, Snap-on. It sits below the average market cap of the top 10 but above the sector median. The company trails Lincoln Electric Holdings by about 4.6%, indicating a narrow gap with its closest rival.
Comparisons with competitors
Check out how we compare the company to its competitors:
Does SWK have a competitive advantage?
Stanley Black & Decker currently lacks a competitive advantage, as its ROIC falls below WACC by 1.05%, indicating value destruction and declining profitability. Historically, this trend signals inefficiency in capital allocation, a red flag in manufacturing sectors where sustained ROIC above WACC is crucial.
Looking ahead, the company’s broad product range and geographic diversification across the US, Europe, and Asia offer opportunities to stabilize revenue streams. However, recent revenue declines and margin pressures highlight challenges in leveraging these markets for profitable growth.
SWOT Analysis
This SWOT analysis highlights Stanley Black & Decker’s key internal strengths and weaknesses alongside external opportunities and threats.
Strengths
- strong brand portfolio
- global distribution network
- favorable debt-to-assets ratio
Weaknesses
- declining revenue growth
- negative ROIC trend
- low quick ratio signals liquidity risk
Opportunities
- expanding industrial automation
- growing demand in Asia
- innovation in cordless tools
Threats
- intense competition
- raw material cost volatility
- exposure to economic cycles in key markets
Stanley Black & Decker faces pressure from shrinking profitability and liquidity concerns. Strategic focus on innovation and market expansion is essential to offset declining returns and external risks.
Stock Price Action Analysis
The weekly stock chart of Stanley Black & Decker, Inc. (SWK) reveals significant price movements and volatility over the analyzed period:
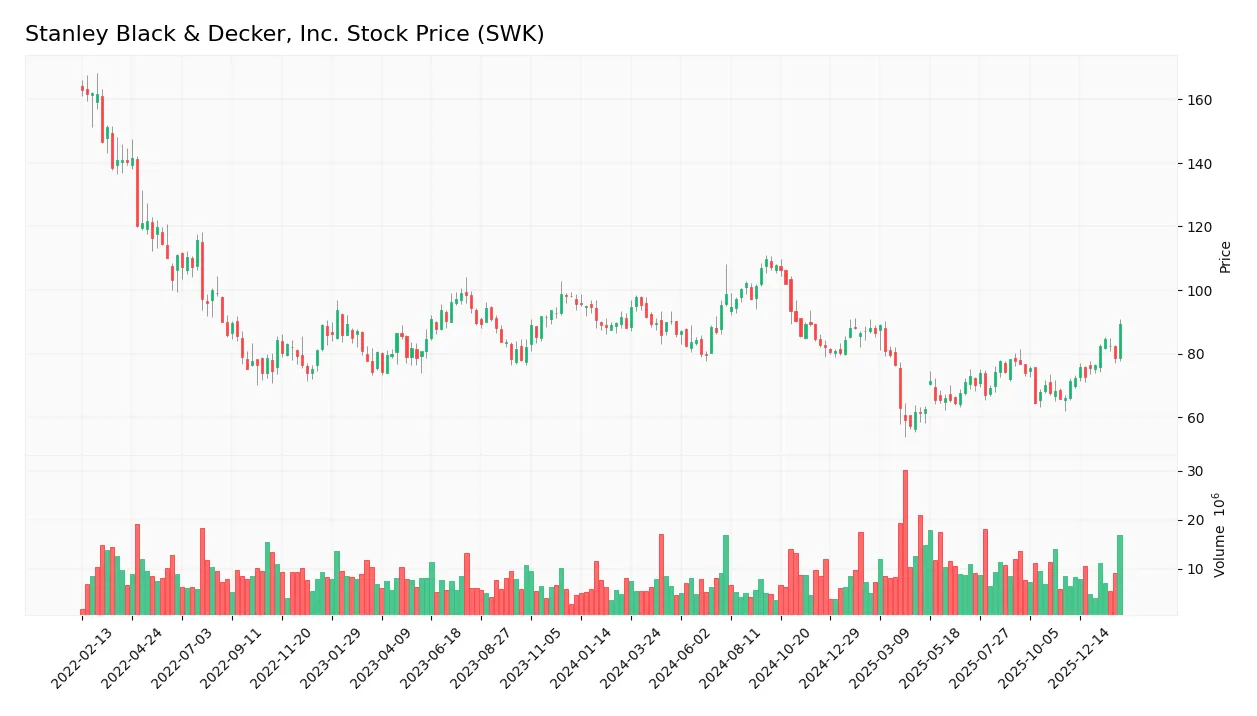
Trend Analysis
Over the past 12 months, SWK’s stock price declined by 6.46%, indicating a bearish trend. The price showed acceleration in this downward movement with high volatility, reflected by a 12.23 standard deviation. The stock hit a high of 109.72 and a low of 57.21, underscoring wide price swings.
Volume Analysis
Trading volume is increasing, with seller volume exceeding buyer volume overall (55% vs. 45%). However, in the recent three months, buyer dominance surged to 71.45%, signaling strong buyer-driven activity. This shift suggests growing market participation and improving investor sentiment.
Target Prices
Analysts present a balanced target price consensus for Stanley Black & Decker, Inc.
| Target Low | Target High | Consensus |
|---|---|---|
| 82 | 100 | 89.33 |
The range from 82 to 100 indicates moderate optimism with a consensus near 89, reflecting steady confidence in the stock’s potential.

Don’t Let Luck Decide Your Entry Point
Optimize your entry points with our advanced ProRealTime indicators. You’ll get efficient buy signals with precise price targets for maximum performance. Start outperforming now!
Analyst & Consumer Opinions
This section examines Stanley Black & Decker, Inc.’s recent analyst ratings alongside consumer feedback and sentiment trends.
Stock Grades
Here are the latest verified grades from major financial institutions for Stanley Black & Decker, Inc.:
| Grading Company | Action | New Grade | Date |
|---|---|---|---|
| Citigroup | Maintain | Buy | 2026-02-06 |
| Wells Fargo | Maintain | Equal Weight | 2026-01-14 |
| UBS | Maintain | Buy | 2026-01-05 |
| Baird | Maintain | Neutral | 2025-12-23 |
| UBS | Maintain | Buy | 2025-11-06 |
| Wells Fargo | Maintain | Equal Weight | 2025-11-05 |
| Wells Fargo | Maintain | Equal Weight | 2025-10-06 |
| Wells Fargo | Maintain | Equal Weight | 2025-07-30 |
| Barclays | Maintain | Overweight | 2025-07-30 |
| Baird | Maintain | Neutral | 2025-07-22 |
The consensus reveals a balanced outlook with multiple “Buy” and “Equal Weight” ratings indicating cautious optimism. Analysts maintain steady positions without recent upgrades or downgrades.
Consumer Opinions
Stanley Black & Decker sparks strong feelings from its user base, reflecting its complex market position.
| Positive Reviews | Negative Reviews |
|---|---|
| Durable tools that last through tough jobs | Customer service slow to respond |
| Innovative product designs improve efficiency | Higher prices compared to competitors |
| Wide product range covers all needs | Some products have quality control issues |
Overall, consumers praise Stanley Black & Decker for durability and innovation. However, recurring complaints about service delays and occasional quality inconsistencies suggest areas for improvement.
Risk Analysis
The following table outlines key risks that Stanley Black & Decker faces, categorized by likelihood and potential impact:
| Category | Description | Probability | Impact |
|---|---|---|---|
| Financial Health | Altman Z-Score at 1.57 signals distress zone, indicating elevated bankruptcy risk. | High | High |
| Profitability | Low net margin (2.66%) and ROE (4.44%) reflect weak profitability amid competitive pressure. | High | Medium |
| Liquidity | Quick ratio of 0.35 signals weak short-term liquidity, risking operational flexibility. | Medium | Medium |
| Debt and Interest | Interest coverage ratio at 1.89 is low, raising concerns over debt servicing in downturns. | Medium | High |
| Valuation | High P/E ratio of 28.82 suggests overvaluation risk compared to sector benchmarks. | Medium | Medium |
| Market Volatility | Beta of 1.204 indicates above-average stock price volatility relative to the S&P 500. | Medium | Low |
Stanley Black & Decker’s most pressing risk is its financial distress signal from the Altman Z-Score. Despite a strong Piotroski score of 7, the low profitability and tight liquidity could constrain growth. The interest coverage ratio warns of vulnerability to rising debt costs. Investors should weigh these risks against the stock’s premium valuation and moderate market volatility.
Should You Buy Stanley Black & Decker, Inc.?
Stanley Black & Decker appears to be a company with deteriorating operational efficiency and a very unfavorable moat, as value creation declines. Despite a manageable leverage profile, its moderate B- rating and distress-zone Altman Z-Score suggest cautious analytical interpretation.
Strength & Efficiency Pillars
Stanley Black & Decker’s operational margins show resilience, with a gross margin of 29.86% and an interest expense ratio of 3.07%, both favorable in this capital-intensive sector. The EBIT margin of 5.82% and net margin of 2.66% remain modest but stable. While ROIC at 7.21% nearly matches the WACC of 8.26%, indicating neutral value creation, the company’s dividend yield of 4.32% provides attractive income potential. However, declining profitability trends suggest caution on efficiency gains.
Weaknesses and Drawbacks
The company is in financial distress, as flagged by an Altman Z-Score of 1.57, signaling a high bankruptcy risk that overrides other metrics. Profitability metrics are weak, with ROE at 4.44% and net margin low at 2.66%. Valuation appears stretched, with a P/E ratio of 28.82 indicating a premium price amid declining revenue (-1.53%) and gross profit (-1.81%) growth. Liquidity is strained, evidenced by a quick ratio of 0.35, while interest coverage at 1.89 highlights vulnerability to debt servicing costs.
Our Final Verdict about Stanley Black & Decker, Inc.
Despite some operational strengths, Stanley Black & Decker’s solvency risk as reflected by the Altman Z-Score of 1.57 makes its investment profile highly speculative. The company’s declining profitability and financial distress suggest it remains too risky for conservative capital. Investors seeking stability should exercise caution and consider alternatives until the firm demonstrates a stronger financial footing.
Disclaimer: This content is for informational purposes only and does not constitute financial, investment, or other professional advice. Investing in financial markets involves a significant risk of loss, and past performance is not indicative of future results.
Additional Resources
- Stanley Black & Decker Announces 1st Quarter 2026 Dividend – PR Newswire (Feb 24, 2026)
- Assessing Stanley Black & Decker (SWK) Valuation As Recent Momentum Meets Mixed Long Term Returns – Yahoo Finance (Feb 25, 2026)
- Decoding Stanley Black & Decker Inc (SWK): A Strategic SWOT Insi – GuruFocus (Feb 25, 2026)
- Stanley Black & Decker to pay $0.83 per share to investors in March – Stock Titan (Feb 24, 2026)
- STANLEY BLACK & DECKER, INC. SEC 10-K Report – TradingView (Feb 24, 2026)
For more information about Stanley Black & Decker, Inc., please visit the official website: stanleyblackanddecker.com