Home > Analyses > Consumer Defensive > Spectrum Brands Holdings, Inc.
Spectrum Brands Holdings, Inc. touches everyday lives through a diverse portfolio of trusted household and personal care products, pet care essentials, and garden solutions. Renowned for brands like Black & Decker, Remington, and IAMS, the company stands as a dynamic leader in consumer goods, innovating to meet evolving customer needs globally. As we explore Spectrum Brands’ current fundamentals and market position, the question remains: does its growth potential still justify investor confidence in 2026?
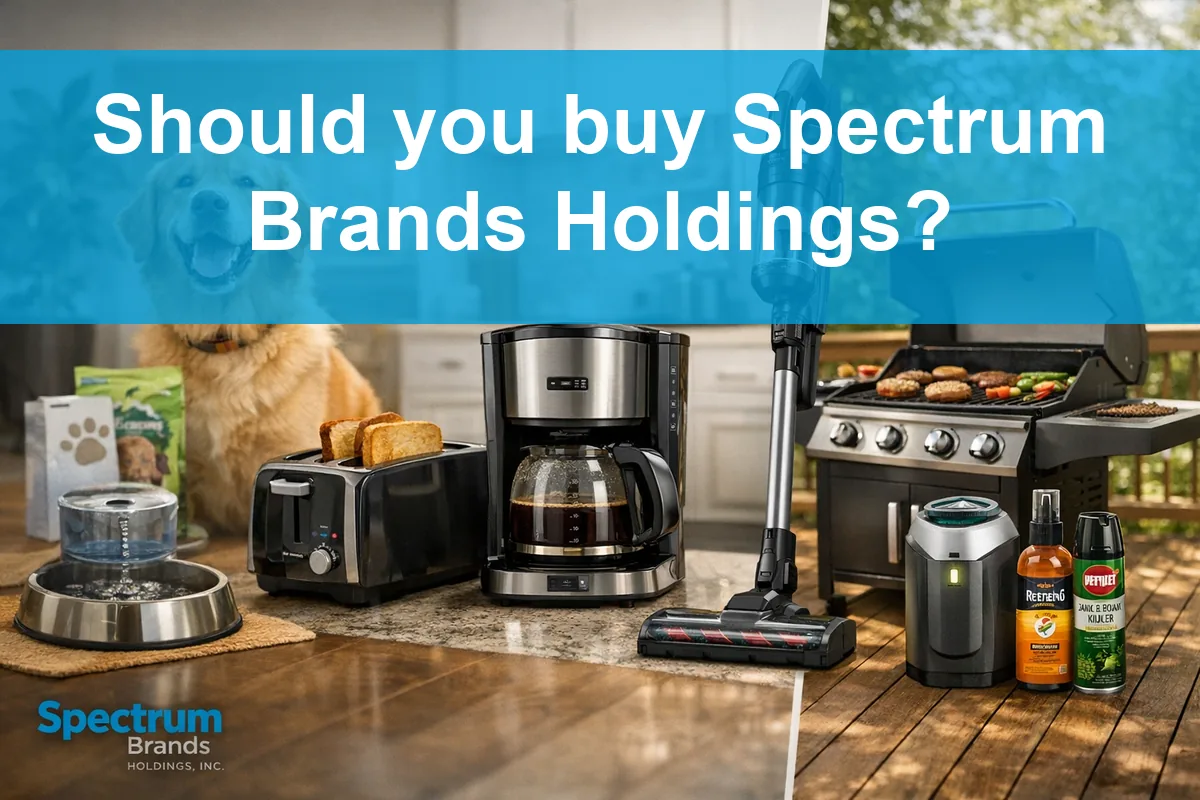
Table of contents
Business Model & Company Overview
Spectrum Brands Holdings, Inc., founded in 2009 and headquartered in Middleton, Wisconsin, is a leading player in the Household & Personal Products industry. The company operates a cohesive ecosystem spanning Home and Personal Care, Global Pet Care, and Home and Garden segments. Its portfolio includes well-known brands such as Black & Decker, Remington, Tetra, and Spectracide, delivering a diverse range of consumer products designed to enhance everyday living.
The company’s revenue engine balances durable home appliances, pet care consumables, and outdoor solutions, generating steady cash flows through retail, e-commerce, and wholesale channels across the Americas, Europe, and Asia. With a market cap of 1.57B USD and 3,100 employees, Spectrum Brands leverages its broad geographic footprint and brand depth to build a robust economic moat, shaping the future of consumer essentials worldwide.
Financial Performance & Fundamental Metrics
In this section, I analyze Spectrum Brands Holdings, Inc.’s income statement, key financial ratios, and dividend payout policy to assess its financial health and investment potential.
Income Statement
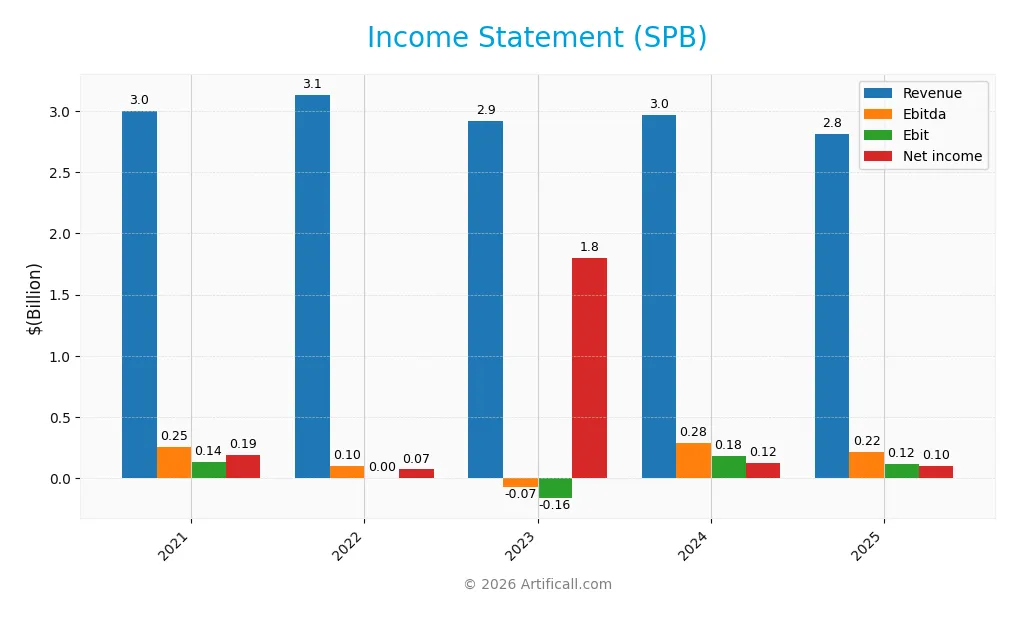
Below is the Income Statement of Spectrum Brands Holdings, Inc. (ticker: SPB) for the fiscal years 2021 through 2025, presented in USD.
| 2021 | 2022 | 2023 | 2024 | 2025 | |
|---|---|---|---|---|---|
| Revenue | 3.00B | 3.13B | 2.92B | 2.96B | 2.81B |
| Cost of Revenue | 1.96B | 2.14B | 1.99B | 1.85B | 1.78B |
| Operating Expenses | 939M | 967M | 1.13B | 939M | 907M |
| Gross Profit | 1.04B | 991M | 925M | 1.11B | 1.03B |
| EBITDA | 253M | 104M | -72M | 285M | 215M |
| EBIT | 136M | 5M | -163M | 183M | 117M |
| Interest Expense | 117M | 99M | 127M | 59M | 30M |
| Net Income | 190M | 72M | 1.80B | 125M | 100M |
| EPS | 4.44 | 1.75 | 45.65 | 4.12 | 3.88 |
| Filing Date | 2021-11-23 | 2022-11-22 | 2024-01-25 | 2024-11-15 | 2025-11-18 |
Income Statement Evolution
Between 2021 and 2025, Spectrum Brands Holdings, Inc. experienced a decline in both revenue and net income, with revenue decreasing by 6.31% overall and net income dropping by 47.31%. Gross margins remained relatively stable and favorable at 36.74%, but EBIT and net margins showed neutral to unfavorable trends. The company’s profitability margins deteriorated over the period, reflecting challenges in sustaining earnings growth.
Is the Income Statement Favorable?
In fiscal year 2025, revenue fell 5.23% to $2.81B, with gross profit declining nearly 7%, indicating cost pressures or weaker sales mix. Operating expenses decreased slightly but not enough to offset margin compression. EBIT margin stayed neutral at 4.17%, while net margin declined to 3.56%. Interest expense remained favorable at 1.07% of revenue. Overall, the fundamentals in 2025 appear unfavorable, consistent with a broader trend of declining profitability and earnings per share over the recent years.
Financial Ratios
The table below summarizes key financial ratios for Spectrum Brands Holdings, Inc. (SPB) over the last five fiscal years, providing insight into profitability, valuation, liquidity, leverage, and efficiency:
| Ratios | 2021 | 2022 | 2023 | 2024 | 2025 |
|---|---|---|---|---|---|
| Net Margin | 6.3% | 2.3% | 61.7% | 4.2% | 3.6% |
| ROE | 12.9% | 5.7% | 71.6% | 5.8% | 5.2% |
| ROIC | -3.2% | 0.4% | -3.7% | 3.3% | 4.3% |
| P/E | 21.5 | 22.3 | 1.7 | 23.1 | 13.5 |
| P/B | 2.8 | 1.3 | 1.2 | 1.3 | 0.7 |
| Current Ratio | 2.5 | 2.7 | 3.8 | 2.3 | 2.3 |
| Quick Ratio | 2.0 | 2.1 | 3.2 | 1.6 | 1.4 |
| D/E | 1.7 | 2.5 | 0.7 | 0.3 | 0.3 |
| Debt-to-Assets | 48% | 56% | 32% | 17% | 19% |
| Interest Coverage | 0.8 | 0.2 | -1.6 | 2.9 | 4.2 |
| Asset Turnover | 0.6 | 0.5 | 0.6 | 0.8 | 0.8 |
| Fixed Asset Turnover | 9.5 | 9.0 | 7.6 | 8.0 | 8.6 |
| Dividend Yield | 1.8% | 4.3% | 2.1% | 1.8% | 3.6% |
Evolution of Financial Ratios
Over the period, Spectrum Brands Holdings, Inc. showed a decline in Return on Equity (ROE), falling from 12.88% in 2021 to 5.23% in 2025, indicating reduced profitability. The Current Ratio remained relatively stable, averaging around 2.3, reflecting consistent liquidity. The Debt-to-Equity Ratio improved significantly, decreasing from 1.74 in 2021 to 0.34 in 2025, suggesting a stronger balance sheet with lower leverage.
Are the Financial Ratios Favorable?
In 2025, profitability ratios such as net margin (3.56%) and ROE (5.23%) were unfavorable, indicating subdued earnings efficiency. Liquidity ratios, including a current ratio of 2.26 and quick ratio of 1.41, were favorable, supporting solid short-term financial health. Leverage ratios, with a debt-to-equity of 0.34 and debt-to-assets at 19.36%, were also favorable, implying manageable debt levels. Market valuation ratios like price-to-earnings (13.51) and price-to-book (0.71) were favorable, while interest coverage and asset turnover ratios were neutral. Overall, 64.29% of key ratios were favorable, suggesting a generally positive financial profile.
Shareholder Return Policy
Spectrum Brands Holdings, Inc. maintains a consistent dividend payout with a ratio near 48% in 2025, offering a 3.57% yield supported by free cash flow coverage of approximately 81%. The company also engages in share buybacks, balancing distributions with capital expenditures.
This policy appears aimed at sustainable shareholder value, combining moderate dividends and buybacks while maintaining operational cash flow adequacy. The approach mitigates risks of excessive payouts, suggesting prudent long-term capital allocation.
Score analysis
The following radar chart presents a comprehensive view of Spectrum Brands Holdings, Inc.’s key financial scores:
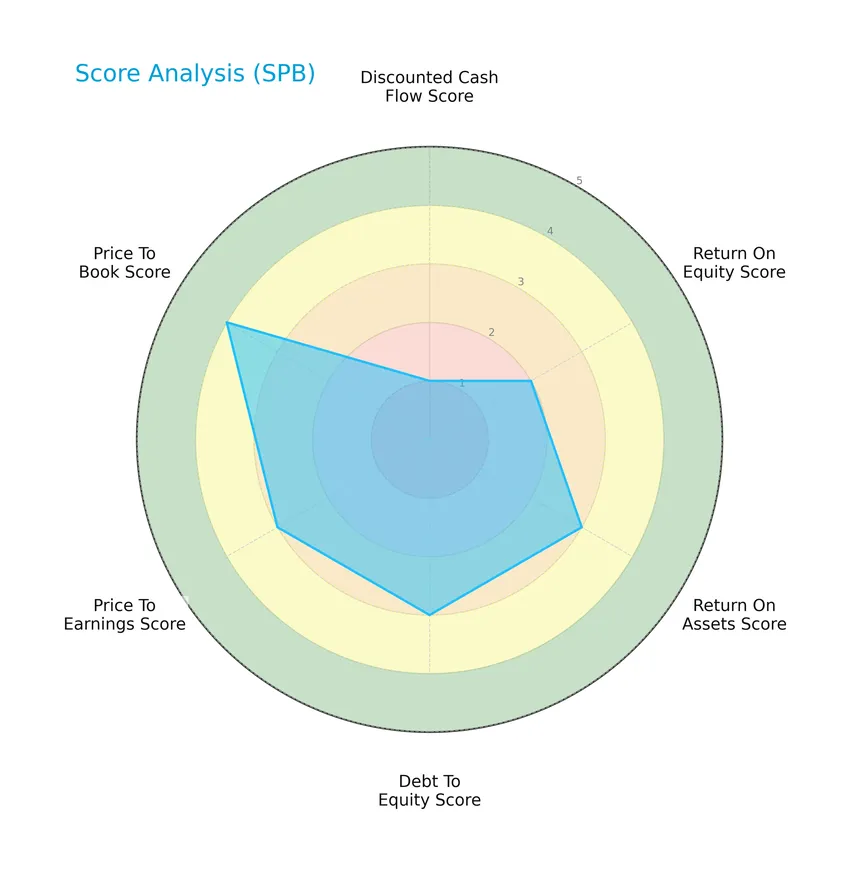
The company shows a range of scores from very unfavorable in discounted cash flow (1) to favorable in price-to-book (4). Most other metrics, including return on equity, return on assets, debt to equity, and price to earnings, hold moderate scores of 2 or 3, reflecting a balanced but cautious financial profile.
Analysis of the company’s bankruptcy risk
Spectrum Brands Holdings, Inc. is currently positioned in the grey zone for bankruptcy risk, indicating a moderate chance of financial distress:

Is the company in good financial health?
Here is the Piotroski Score chart illustrating the company’s financial health:

With a Piotroski Score of 6, Spectrum Brands Holdings, Inc. falls into the average category, suggesting a moderate level of financial strength based on profitability, leverage, liquidity, and operational efficiency metrics.
Competitive Landscape & Sector Positioning
This sector analysis will explore the strategic positioning, revenue segments, key products, and main competitors of Spectrum Brands Holdings, Inc. I will also assess whether the company holds a competitive advantage over its industry peers.
Strategic Positioning
Spectrum Brands Holdings, Inc. maintains a diversified product portfolio spanning Home and Personal Care ($1.15B), Global Pet Supplies ($1.08B), and Home and Garden ($573M) segments. Geographically, it is heavily concentrated in the U.S. market ($1.57B), with smaller exposures in EMEA ($882M), Latin America ($213M), Asia Pacific ($93M), and North America ex-U.S. ($53M).
Revenue by Segment
The pie chart illustrates Spectrum Brands Holdings, Inc.’s revenue distribution by segment for the fiscal year 2025, highlighting the contributions of key business areas.
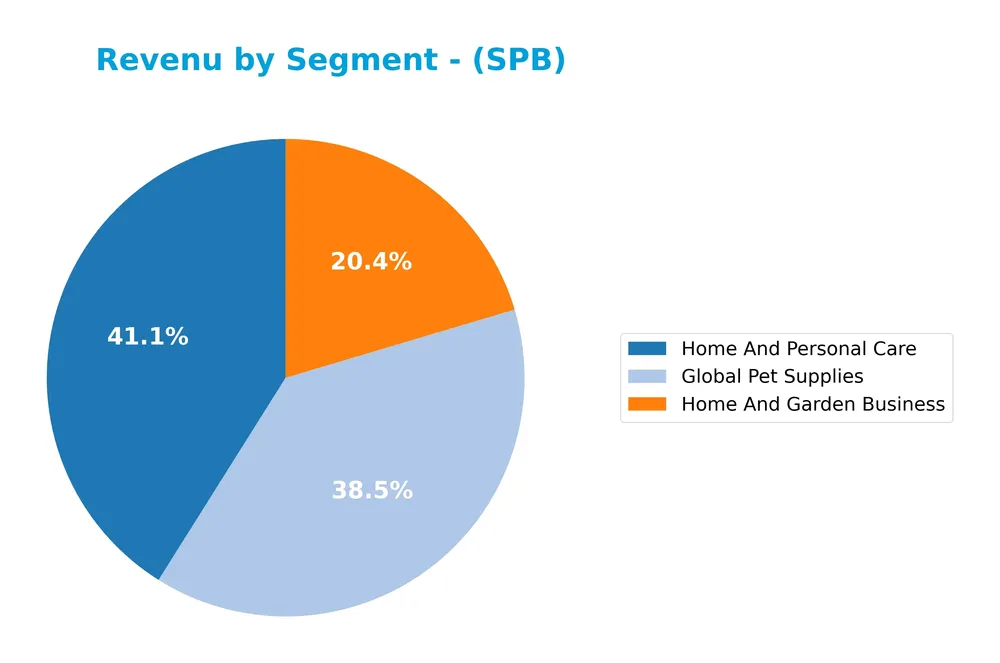
In 2025, Home And Personal Care led with $1.15B, followed closely by Global Pet Supplies at $1.08B, and Home And Garden Business at $573M. The data shows a slight decline in Home And Personal Care and Global Pet Supplies compared to 2024, indicating a mild slowdown. However, these three segments remain the primary drivers, with no significant structural shifts, suggesting stable but cautious growth prospects.
Key Products & Brands
Below is an overview of Spectrum Brands Holdings, Inc.’s key product segments and associated brands:
| Product | Description |
|---|---|
| Home and Personal Care | Home appliances brands include Black & Decker, Russell Hobbs, George Foreman, Toastmaster, Juiceman, Farberware, Breadman; personal care brands Remington, LumaBella. |
| Global Pet Care | Pet supplies and products under brands such as 8IN1 (8-in-1), Dingo, Nature’s Miracle, Wild Harvest, Littermaid, Jungle, Excel, FURminator, IAMS, Eukanuba, and more. Aquarium products include Tetra, Marineland, Whisper, Instant Ocean, GloFish, OmegaOne, OmegaSea. |
| Home and Garden | Outdoor insect and weed control, animal repellents (Spectracide, Garden Safe, Liquid Fence, EcoLogic), household pest control (Hot Shot, Black Flag, Real-Kill, Ultra Kill, The Ant Trap, Rid-A-Bug), surface cleaning and maintenance (Rejuvenate), and personal-use pesticides and insect repellents (Cutter, Repel). |
Spectrum Brands Holdings operates across three main segments with well-recognized brands in home appliances, pet care, and garden/home maintenance products, reflecting a diversified consumer product portfolio.
Main Competitors
Spectrum Brands Holdings, Inc. faces competition from 17 companies in its sector, with the top 10 leaders by market capitalization listed below:
| Competitor | Market Cap. |
|---|---|
| The Procter & Gamble Company | 331B |
| Unilever PLC | 143B |
| Colgate-Palmolive Company | 62.6B |
| The Estée Lauder Companies Inc. | 38.5B |
| Kimberly-Clark Corporation | 33.7B |
| Kenvue Inc. | 33.2B |
| Church & Dwight Co., Inc. | 20.2B |
| The Clorox Company | 12.3B |
| e.l.f. Beauty, Inc. | 4.3B |
| Inter Parfums, Inc. | 2.7B |
Spectrum Brands Holdings, Inc. ranks 13th among 17 competitors, with a market cap roughly 0.47% that of the leader, The Procter & Gamble Company. It sits below both the average market cap of the top 10 competitors (68B) and the sector median (4.3B). The company is narrowly behind its closest competitor by about 0.4%, indicating a very tight gap at its position.
Comparisons with competitors
Check out how we compare the company to its competitors:
Does SPB have a competitive advantage?
Spectrum Brands Holdings, Inc. currently does not present a strong competitive advantage, as its ROIC is below its WACC, indicating value destruction despite a growing ROIC trend. The company’s financials show mostly unfavorable income statement growth and a net margin of 3.56%, reflecting challenges in profitability.
Looking ahead, Spectrum Brands operates a diverse portfolio in household, personal care, pet care, and home and garden segments with well-known brands. Opportunities may arise from expanding product lines and markets worldwide, particularly leveraging its global presence and established brand recognition.
SWOT Analysis
This SWOT analysis highlights Spectrum Brands Holdings, Inc.’s key internal strengths and weaknesses alongside external opportunities and threats to inform strategic decisions.
Strengths
- Diverse product portfolio across home, personal care, pet care, and garden segments
- Strong brand recognition with multiple established brands
- Solid balance sheet with low debt-to-equity ratio
Weaknesses
- Declining revenue and profit trends over recent years
- Moderate profitability with low net and EBIT margins
- Financial distress risk indicated by Altman Z-score in grey zone
Opportunities
- Expansion in emerging markets with growing demand
- Innovation in sustainable and health-conscious products
- E-commerce growth enhancing direct-to-consumer sales channels
Threats
- Intense competition in consumer products sector
- Volatility in raw material costs impacting margins
- Economic downturns reducing consumer discretionary spending
Overall, Spectrum Brands exhibits robust brand strength and financial stability, but ongoing declines in profitability and revenue require strategic focus on innovation and market expansion to mitigate competitive and economic risks.
Stock Price Action Analysis
The following weekly stock chart of Spectrum Brands Holdings, Inc. (SPB) illustrates price movements and volume trends over the last 12 months:
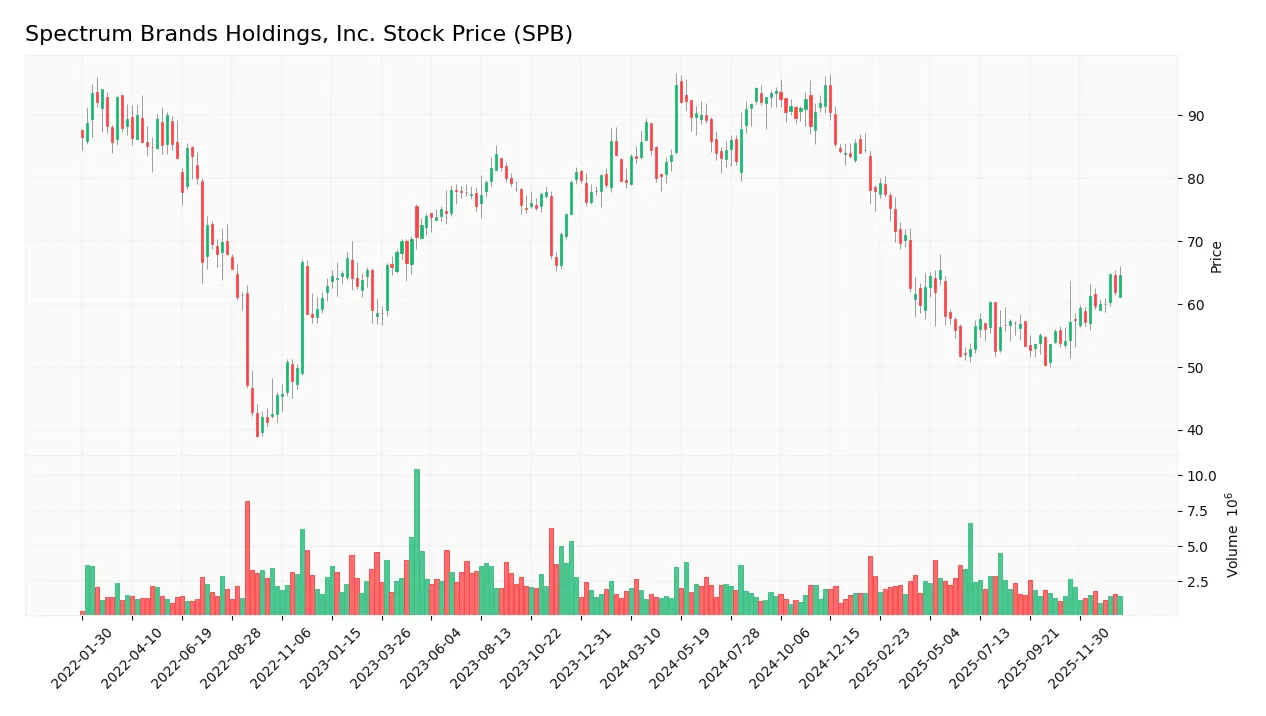
Trend Analysis
Over the past 12 months, SPB’s stock price declined by 18.6%, indicating a bearish trend with accelerating downward momentum. The price ranged between a high of 94.88 and a low of 50.35, with volatility reflected in a standard deviation of 15.05. However, from November 2025 to January 2026, the stock rebounded 19.38%, showing a recent short-term bullish correction.
Volume Analysis
In the last three months, trading volumes have been decreasing overall despite a buyer-dominant market with 68.45% buyer volume in the recent period. This reduction in volume suggests weakening market participation but continued investor interest on the buy side, reflecting cautious optimism among shareholders.
Target Prices
The consensus target price for Spectrum Brands Holdings, Inc. (SPB) is firmly set at $75.
| Target High | Target Low | Consensus |
|---|---|---|
| 75 | 75 | 75 |
This unified target suggests analysts expect the stock to stabilize around the $75 mark, indicating limited price variability in their forecasts.

Don’t Let Luck Decide Your Entry Point
Optimize your entry points with our advanced ProRealTime indicators. You’ll get efficient buy signals with precise price targets for maximum performance. Start outperforming now!
Analyst & Consumer Opinions
This section examines recent analyst ratings and consumer feedback related to Spectrum Brands Holdings, Inc. (SPB).
Stock Grades
The following table presents recent verified stock grades for Spectrum Brands Holdings, Inc. from reputable financial institutions:
| Grading Company | Action | New Grade | Date |
|---|---|---|---|
| Canaccord Genuity | Maintain | Buy | 2025-11-17 |
| Wells Fargo | Maintain | Equal Weight | 2025-11-14 |
| Wells Fargo | Maintain | Equal Weight | 2025-09-25 |
| Canaccord Genuity | Maintain | Buy | 2025-08-08 |
| Wells Fargo | Maintain | Equal Weight | 2025-07-09 |
| Canaccord Genuity | Maintain | Buy | 2025-06-25 |
| UBS | Maintain | Buy | 2025-05-09 |
| UBS | Maintain | Buy | 2025-04-17 |
| Wells Fargo | Maintain | Equal Weight | 2025-04-16 |
| Wells Fargo | Maintain | Equal Weight | 2025-04-02 |
Overall, the consensus among graders leans toward a Buy rating, with Canaccord Genuity and UBS consistently maintaining Buy grades, while Wells Fargo consistently holds an Equal Weight stance, reflecting a balanced outlook on the stock.
Consumer Opinions
Consumers of Spectrum Brands Holdings, Inc. (SPB) express a mixed but generally favorable sentiment toward the company’s product range and customer service.
| Positive Reviews | Negative Reviews |
|---|---|
| “High-quality products with reliable performance.” | “Customer support response times can be slow.” |
| “Wide variety of household items at reasonable prices.” | “Some products have durability issues after extended use.” |
| “Innovative features that simplify daily tasks.” | “Occasional delays in shipping and delivery.” |
Overall, consumers appreciate Spectrum Brands for product innovation and variety, though consistent service delays and durability concerns appear as notable areas for improvement.
Risk Analysis
The following table summarizes key risks associated with Spectrum Brands Holdings, Inc., highlighting probability and potential impact on the company’s performance:
| Category | Description | Probability | Impact |
|---|---|---|---|
| Financial Health | Altman Z-Score in the grey zone (1.82) signals moderate risk of financial distress. | Medium | High |
| Profitability | Unfavorable net margin (3.56%) and ROE (5.23%) indicate weak profitability and earnings power. | High | Medium |
| Market Volatility | Stock price volatility is moderate with beta of 0.68, less sensitive to market swings. | Low | Low |
| Competitive Market | Intense competition in household and personal products may pressure margins and market share. | High | Medium |
| Operational Risk | Moderate efficiency metrics and interest coverage ratio (3.91) may constrain operational flexibility. | Medium | Medium |
| Debt Levels | Low debt-to-equity (0.34) and debt-to-assets (19.36%) ratios reduce financial risk. | Low | Low |
Spectrum Brands faces its most significant risks from modest profitability and moderate financial distress indicators, reflected in its grey zone Altman Z-score. While leverage is well-managed, ongoing competition and suboptimal returns require cautious monitoring to mitigate downside risks.
Should You Buy Spectrum Brands Holdings, Inc.?
Spectrum Brands Holdings, Inc. appears to be navigating a slightly unfavorable moat with growing profitability, though it could be seen as shedding value. Its leverage profile is moderate, supported by a grey zone Altman Z-score and an average Piotroski score, suggesting a B rating with cautious operational efficiency.
Strength & Efficiency Pillars
Spectrum Brands Holdings, Inc. exhibits a generally favorable financial health profile, supported by a strong Altman Z-score of 1.82 placing it in the grey zone, and an average Piotroski score of 6 indicating moderate financial strength. The company maintains a solid balance sheet with a debt-to-equity ratio of 0.34 and a current ratio of 2.26, reflecting good liquidity and moderate leverage. Valuation metrics are attractive, with a price-to-earnings ratio at 13.51 and a price-to-book of 0.71, signaling undervaluation. Although its return on invested capital (ROIC) at 4.31% trails the weighted average cost of capital (WACC) at 5.53%, suggesting the company is currently shedding value, operational efficiency is supported by a favorable fixed asset turnover of 8.55 and a dividend yield of 3.57%.
Weaknesses and Drawbacks
Despite some favorable metrics, Spectrum Brands faces notable profitability challenges, with a net margin of only 3.56% and a return on equity (ROE) of 5.23%, both flagged as unfavorable. The company’s earnings growth is under pressure, evidenced by a steep 35.99% decline in EBIT over the past year and a 47.31% reduction in net income over the overall period 2021-2025. Revenue trends are also negative, with a 5.23% drop in the last year and an overall decline of 6.31%. These factors indicate weakening operational performance. Although leverage and liquidity are healthy, the modest interest coverage ratio of 3.91 reflects some vulnerability in meeting debt obligations should earnings further deteriorate.
Our Verdict about Spectrum Brands Holdings, Inc.
The long-term fundamental profile of Spectrum Brands may appear mixed, reflecting moderate financial strength but subdued profitability and value destruction relative to capital costs. However, the recent period shows buyer dominance at 68.45% and a positive price trend slope of 0.77, suggesting improving market sentiment. Despite this technical positivity, the overall bearish trend and fundamental weaknesses might suggest a cautious, wait-and-see approach for investors seeking a more favorable entry point in the near term.
Disclaimer: This content is for informational purposes only and does not constitute financial, investment, or other professional advice. Investing in financial markets involves a significant risk of loss, and past performance is not indicative of future results.
Additional Resources
- Spectrum Brands Holdings to Report Fiscal 2026 First Quarter Financial Results and Hold Conference Call and Webcast on February 5, 2026 – Yahoo Finance (Jan 22, 2026)
- RBC maintains Outperform on Spectrum Brands stock, $114 target – MSN (Jan 21, 2026)
- Spectrum Brands Holdings Inc. (NYSE:SPB) Given Average Recommendation of “Moderate Buy” by Analysts – MarketBeat (Jan 17, 2026)
- A Look At Spectrum Brands Holdings (SPB) Valuation After Recent Share Price Weakness – simplywall.st (Jan 17, 2026)
- Spectrum Brands Holdings Reports Fiscal 2025 Fourth Quarter Results – Business Wire (Nov 13, 2025)
For more information about Spectrum Brands Holdings, Inc., please visit the official website: spectrumbrands.com