Home > Analyses > Industrials > Southwest Airlines Co.
Southwest Airlines Co. revolutionizes air travel with its distinctive low-cost model, connecting millions across the U.S. and nearby international destinations. Its extensive fleet of Boeing 737s and customer-centric innovations—like Rapid Rewards and EarlyBird Check-In—set industry standards for convenience and value. As competition intensifies and operational costs fluctuate, I question whether Southwest’s solid market presence still translates into sustainable growth and justifies its current valuation.

Table of contents
Business Model & Company Overview
Southwest Airlines Co., founded in 1967 and headquartered in Dallas, Texas, dominates the U.S. and near-international passenger airline market. It operates a fleet of 728 Boeing 737s, serving 121 destinations across 42 states and 10 nearby countries. Its cohesive ecosystem combines scheduled air transportation with inflight entertainment, connectivity, and loyalty rewards, creating a seamless travel experience for millions annually. This integrated approach solidifies its competitive advantage in a fiercely contested industry.
Southwest generates revenue primarily through ticket sales, supplemented by ancillary services like EarlyBird Check-In and pet transportation. Its digital platforms, including SWABIZ and mobile apps, enhance customer engagement and streamline operations across the Americas and Caribbean markets. This diversified revenue engine, blending hardware assets with software-driven services, underpins its robust cash flow generation. Southwest’s enduring economic moat stems from its cost-efficient model and loyal customer base, shaping the future of low-cost air travel.
Financial Performance & Fundamental Metrics
I analyze Southwest Airlines Co.’s income statement, key financial ratios, and dividend payout policy to assess its core profitability and capital return strategy.
Income Statement
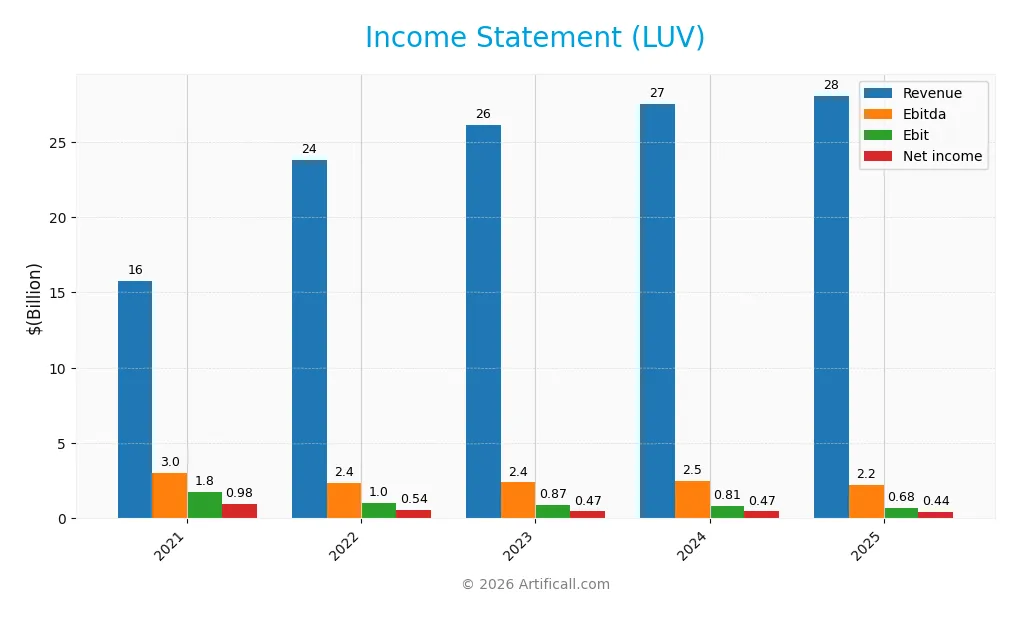
The table below summarizes Southwest Airlines Co.’s key income statement metrics for the fiscal years 2021 to 2025, reflecting revenue, expenses, and profitability trends.
| 2021 | 2022 | 2023 | 2024 | 2025 | |
|---|---|---|---|---|---|
| Revenue | 15.79B | 23.81B | 26.09B | 27.48B | 28.06B |
| Cost of Revenue | 11.68B | 19.06B | 21.87B | 23.02B | 23.17B |
| Operating Expenses | 2.39B | 3.74B | 4.00B | 4.14B | 4.47B |
| Gross Profit | 4.12B | 4.75B | 4.22B | 4.46B | 4.90B |
| EBITDA | 3.03B | 2.38B | 2.39B | 2.47B | 2.24B |
| EBIT | 1.76B | 1.03B | 0.87B | 0.81B | 0.68B |
| Interest Expense | 0.43B | 0.30B | 0.24B | 0.21B | 0.11B |
| Net Income | 0.98B | 0.54B | 0.47B | 0.47B | 0.44B |
| EPS | 1.65 | 0.91 | 0.81 | 0.81 | 0.82 |
| Filing Date | 2022-02-07 | 2023-02-07 | 2024-02-06 | 2025-02-07 | 2026-02-05 |
Income Statement Evolution
From 2021 to 2025, Southwest Airlines’ revenue grew significantly by 78%, reflecting steady demand recovery. However, net income declined sharply by 55%, indicating margin pressures. Gross margin remained stable around 17%, while EBIT margin contracted to 2.4%, signaling rising operating expenses relative to revenue growth.
Is the Income Statement Favorable?
In 2025, revenue increased 2.1%, but EBIT fell 16.8%, and net margin declined 7.1%, pointing to profitability challenges. Interest expense was low at 0.4% of revenue, a positive factor. Overall, fundamentals appear unfavorable due to earnings deterioration despite moderate top-line growth and stable gross margins.
Financial Ratios
The following table summarizes key financial ratios for Southwest Airlines Co. (LUV) over recent fiscal years, providing a clear view of profitability, liquidity, leverage, efficiency, and shareholder returns:
| Ratios | 2021 | 2022 | 2023 | 2024 | 2025 |
|---|---|---|---|---|---|
| Net Margin | 6.2% | 2.3% | 1.8% | 1.7% | 1.6% |
| ROE | 9.4% | 5.0% | 4.4% | 4.5% | 5.5% |
| ROIC | 4.6% | 3.0% | 0.7% | 1.1% | 1.8% |
| P/E | 26.0 | 37.0 | 37.0 | 43.2 | 50.6 |
| P/B | 2.4 | 1.9 | 1.6 | 1.9 | 2.8 |
| Current Ratio | 2.0 | 1.4 | 1.1 | 0.9 | 0.5 |
| Quick Ratio | 1.9 | 1.4 | 1.1 | 0.9 | 0.4 |
| D/E | 1.18 | 0.89 | 0.87 | 0.78 | 0.85 |
| Debt-to-Assets | 34% | 27% | 25% | 24% | 23% |
| Interest Coverage | 4.0 | 3.4 | 0.9 | 1.5 | 3.8 |
| Asset Turnover | 0.43 | 0.67 | 0.72 | 0.81 | 0.97 |
| Fixed Asset Turnover | 0.96 | 1.27 | 1.27 | 1.35 | 1.32 |
| Dividend Yield | 0% | 0% | 2.5% | 2.1% | 1.8% |
All percentages are rounded to one decimal place. Ratios reflect Southwest Airlines’ evolving efficiency and leverage across the airline industry’s recovery cycle.
Evolution of Financial Ratios
Over 2021-2025, Southwest Airlines’ Return on Equity (ROE) declined significantly from 9.38% to 5.53%. The Current Ratio weakened sharply from 1.97 to 0.52, indicating diminishing short-term liquidity. Debt-to-Equity Ratio improved modestly, moving from 1.18 to 0.85, reflecting somewhat reduced leverage. Profitability margins showed instability, with net margin falling to 1.57% in 2025.
Are the Financial Ratios Favorable?
In 2025, profitability ratios like net margin (1.57%) and ROE (5.53%) remain unfavorable against sector benchmarks. Liquidity ratios, including Current (0.52) and Quick (0.45), are unfavorable, signaling potential short-term liquidity stress. Leverage metrics show mixed signals: Debt-to-Equity (0.85) is neutral, while Debt-to-Assets (23.22%) is favorable. Market valuation ratios like P/E (50.61) appear stretched, contributing to a slightly unfavorable overall ratios profile.
Shareholder Return Policy
Southwest Airlines Co. maintains a dividend payout ratio near 90%, with a dividend yield around 1.8% in 2025. The company also conducts share buybacks, though free cash flow coverage of dividends and buybacks appears weak, presenting potential sustainability concerns.
The high payout ratio amid negative free cash flow signals cautious capital allocation. Historically in the airline sector, maintaining dividend payments during cash flow pressures can strain resources. This policy may challenge long-term shareholder value if cash generation does not improve.
Score analysis
The following radar chart illustrates Southwest Airlines Co.’s valuation and profitability metrics scores:
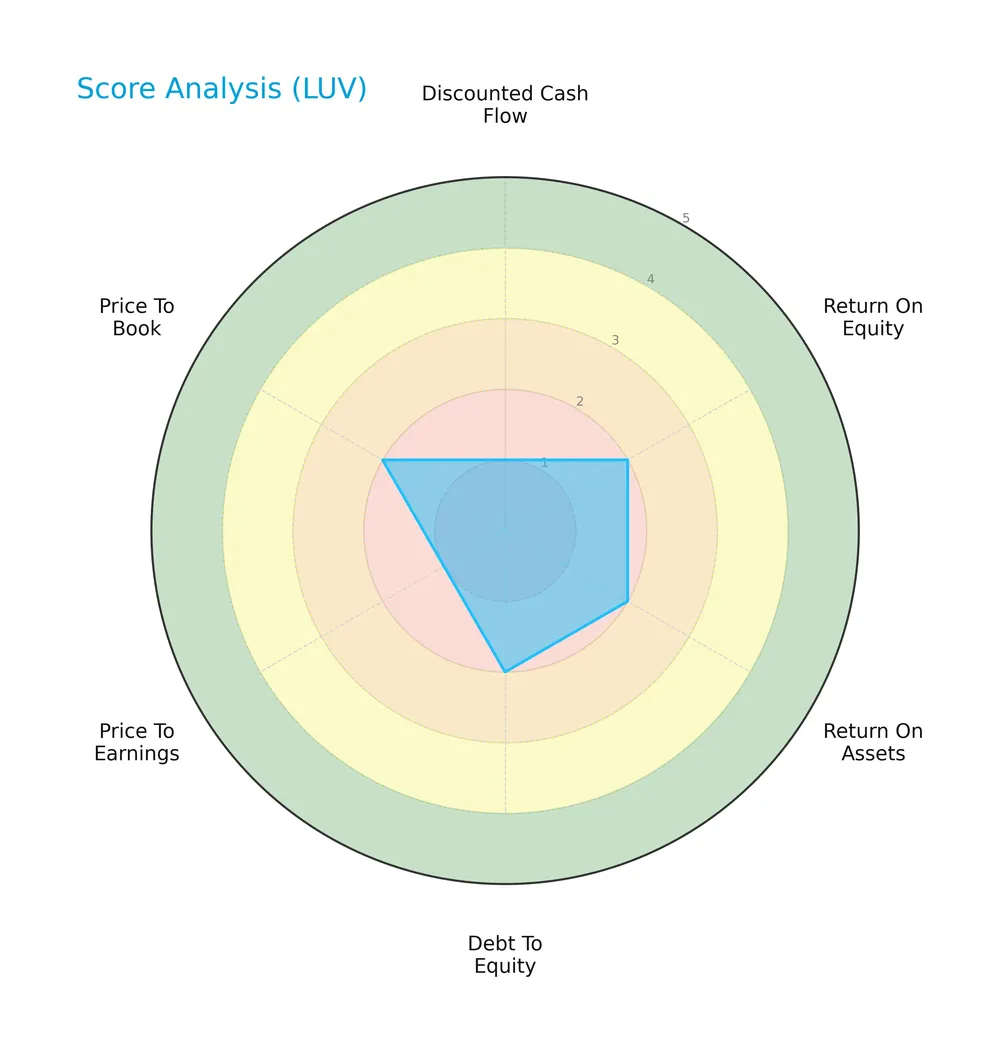
Southwest Airlines shows moderate scores in return on equity, assets, debt-to-equity, and price-to-book ratios. The discounted cash flow and price-to-earnings scores remain very unfavorable, reflecting valuation challenges.
Analysis of the company’s bankruptcy risk
Southwest Airlines’ Altman Z-Score places it in the grey zone, indicating a moderate risk of financial distress and bankruptcy:

Is the company in good financial health?
The Piotroski Score diagram highlights Southwest Airlines’ financial strength based on nine key criteria:

With a Piotroski Score of 7, the company demonstrates strong financial health, suggesting solid profitability, leverage, and efficiency metrics.
Competitive Landscape & Sector Positioning
This section examines Southwest Airlines Co.’s strategic positioning and revenue drivers within the airlines sector. We will evaluate its key products, main competitors, and competitive advantages. I will assess whether Southwest holds a sustainable edge over its industry peers.
Strategic Positioning
Southwest Airlines concentrates primarily on passenger air transportation, generating over $24B in 2024, with cargo and ancillary services contributing marginally. Geographically, it focuses on North America, especially the US, with limited exposure to Latin America, reflecting a relatively concentrated portfolio by region and product.
Revenue by Segment
This pie chart illustrates Southwest Airlines Co.’s revenue breakdown by segment for fiscal year 2024, highlighting key contributors to the company’s total sales.
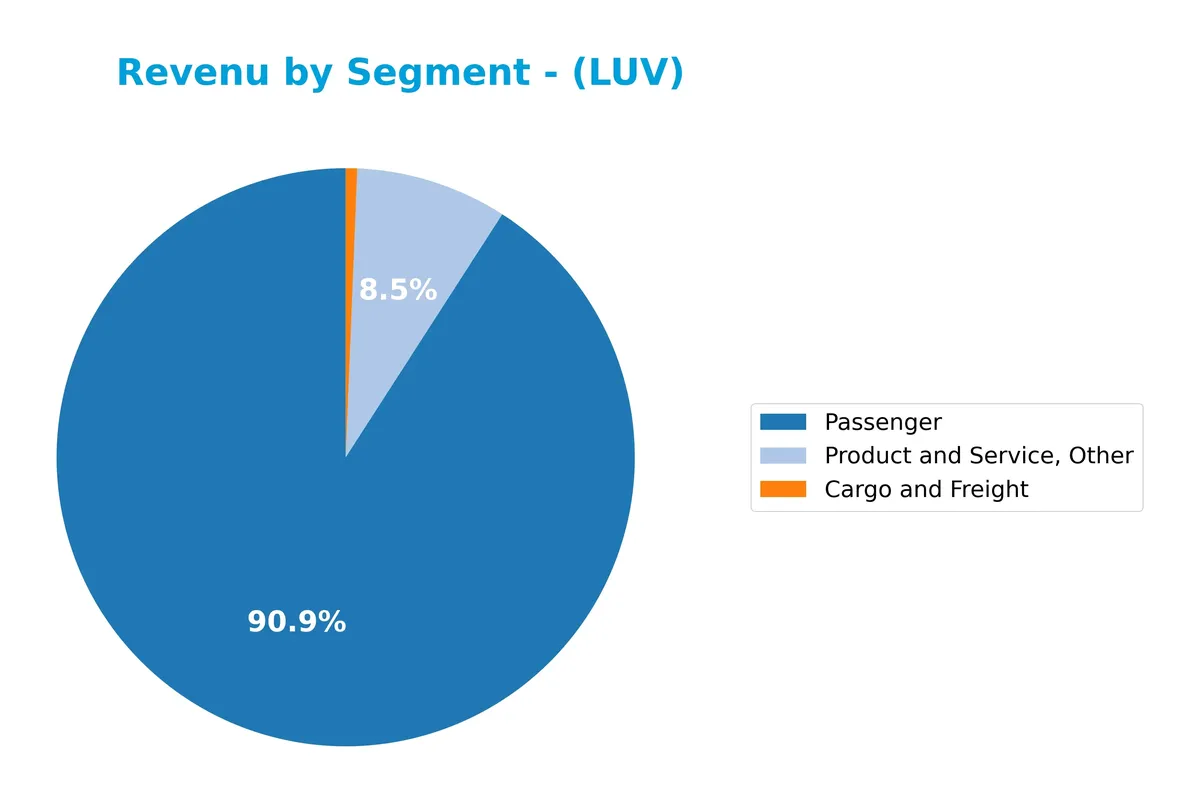
Passenger revenue overwhelmingly drives Southwest’s business, reaching $24.98B in 2024, up from $23.64B in 2023. Product and Service, Other also steadily grows, hitting $2.33B. Cargo and Freight remains a minor but stable contributor near $175M. The latest year shows continued acceleration in passenger demand, reflecting strong travel trends, though concentration risk persists given heavy reliance on this segment.
Key Products & Brands
Southwest Airlines Co.’s key revenue streams and brand offerings include the following core products and services:
| Product | Description |
|---|---|
| Passenger | Scheduled air transportation services across 121 destinations in the US and near-international markets. |
| Cargo and Freight | Transportation of cargo and freight on Southwest’s fleet, contributing a smaller but consistent revenue stream. |
| Product and Service, Other | Ancillary services including inflight entertainment, Wi-Fi connectivity, Rapid Rewards loyalty program, and digital platforms. |
Southwest Airlines generates the bulk of its revenue from passenger air travel. Cargo and ancillary services complement this core, reflecting a diversified revenue base within the airline industry.
Main Competitors
There are 3 main competitors in the Airlines, Airports & Air Services industry; the table shows the top 3 leaders by market capitalization:
| Competitor | Market Cap. |
|---|---|
| Delta Air Lines, Inc. | 45B |
| United Airlines Holdings, Inc. | 37B |
| Southwest Airlines Co. | 21B |
Southwest Airlines ranks 3rd among its peers, with a market cap about 60% of the leader, Delta Air Lines. It sits below both the average market cap of the top 10 competitors (34B) and the sector median (37B). The company trails United Airlines by 35%, reflecting a significant gap from its nearest rival.
Comparisons with competitors
Check out how we compare the company to its competitors:
Does Southwest Airlines Co. have a competitive advantage?
Southwest Airlines currently lacks a competitive advantage, reflected by a very unfavorable moat status and declining ROIC well below its WACC, indicating value destruction. Its profitability metrics remain neutral to unfavorable, with net margin shrinking over recent years despite stable revenue growth.
Looking ahead, Southwest’s extensive network of 121 destinations and near-international markets, combined with digital platforms and loyalty programs, offer growth opportunities. However, improving capital efficiency and reversing the ROIC decline will be critical for sustaining any future competitive edge.
SWOT Analysis
This SWOT analysis highlights Southwest Airlines Co.’s key internal and external factors affecting its competitive position.
Strengths
- strong brand loyalty through Rapid Rewards
- extensive domestic network in North America
- low interest expense supporting financial stability
Weaknesses
- declining ROIC signaling value destruction
- weak current and quick ratios indicating liquidity risk
- high P/E ratio pointing to overvaluation
Opportunities
- expanding near-international routes
- digital platform enhancements improving customer experience
- ancillary service growth boosting revenue streams
Threats
- intense competition in airline industry
- economic downturn reducing travel demand
- fuel price volatility increasing operating costs
Southwest Airlines’ strengths lie in its loyal customer base and broad network. However, deteriorating profitability and liquidity warrant caution. The company must leverage growth in international travel and digital innovation while navigating competitive pressures and cost risks.
Stock Price Action Analysis
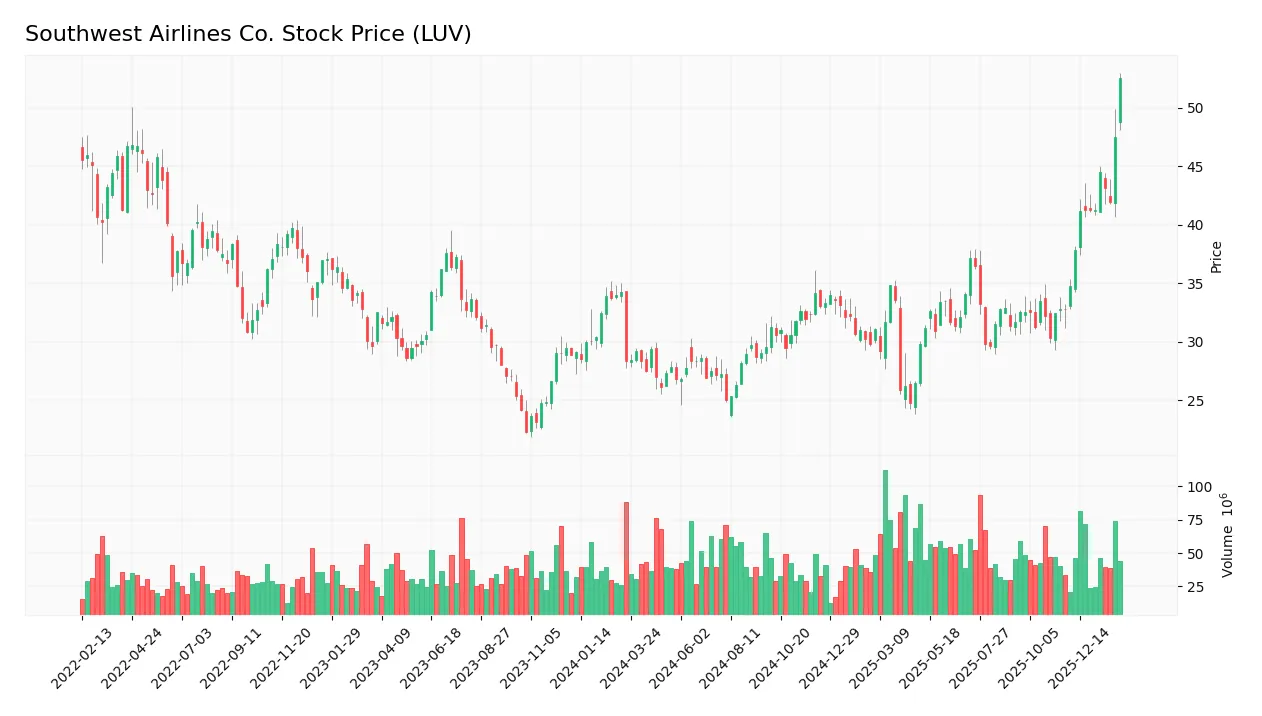
The weekly stock chart of Southwest Airlines Co. (LUV) reveals sustained upward momentum with notable price acceleration over the past year:
Trend Analysis
Over the past 12 months, LUV’s stock price surged 85.22%, indicating a strong bullish trend with acceleration in upward momentum. The price ranged from a low of 24.74 to a high of 52.51, reflecting significant investor enthusiasm. Volatility, measured by a standard deviation of 4.76, remains moderate for this sector.
Volume Analysis
Trading volume has increased, driven predominantly by buyers who represent 60.7% of total volume historically, rising to 79.47% dominance in the recent 12-week period. This strong buyer activity signals robust market participation and positive investor sentiment toward LUV.
Target Prices
Analysts set a clear target consensus for Southwest Airlines Co. reflecting moderate upside potential.
| Target Low | Target High | Consensus |
|---|---|---|
| 32 | 57.5 | 49.58 |
The target range from $32 to $57.5 signals varied risk appetites but an overall bullish view with a consensus near $50.

Don’t Let Luck Decide Your Entry Point
Optimize your entry points with our advanced ProRealTime indicators. You’ll get efficient buy signals with precise price targets for maximum performance. Start outperforming now!
Analyst & Consumer Opinions
This section examines Southwest Airlines Co.’s recent analyst ratings alongside consumer feedback trends and satisfaction scores.
Stock Grades
Here is a summary of the latest verified stock grades for Southwest Airlines Co.:
| Grading Company | Action | New Grade | Date |
|---|---|---|---|
| Susquehanna | Maintain | Neutral | 2026-02-03 |
| Jefferies | Maintain | Hold | 2026-02-02 |
| UBS | Maintain | Neutral | 2026-02-02 |
| B of A Securities | Maintain | Underperform | 2026-01-30 |
| Wells Fargo | Maintain | Equal Weight | 2026-01-30 |
| Morgan Stanley | Maintain | Overweight | 2026-01-30 |
| Goldman Sachs | Maintain | Sell | 2026-01-30 |
| BMO Capital | Upgrade | Outperform | 2026-01-30 |
| TD Cowen | Maintain | Hold | 2026-01-30 |
| Evercore ISI Group | Maintain | In Line | 2026-01-29 |
The consensus leans toward a Hold rating, reflecting cautious optimism with a mix of neutral, hold, and some outperform and sell opinions. The majority of firms maintain their prior ratings, indicating stability in market expectations.
Consumer Opinions
Southwest Airlines Co. consistently garners passionate feedback from its customers, reflecting a blend of admiration and frustration.
| Positive Reviews | Negative Reviews |
|---|---|
| Friendly and attentive cabin crew | Frequent flight delays and cancellations |
| Competitive ticket prices | Limited route options compared to competitors |
| Generous baggage policy with no fees | Overcrowded flights during peak times |
| Efficient boarding process | Inconsistent customer service at airports |
Overall, customers praise Southwest for its affordability and customer-friendly policies. However, recurring complaints about delays and service inconsistencies highlight operational challenges.
Risk Analysis
Below is a summary of key risks facing Southwest Airlines Co., highlighting their likelihood and potential impact:
| Category | Description | Probability | Impact |
|---|---|---|---|
| Financial Health | Current ratio at 0.52 signals liquidity stress, risking cash flow issues. | High | High |
| Profitability | Low net margin (1.57%) and ROIC (1.79%) below WACC (7.82%) suggest weak returns. | High | High |
| Valuation | Elevated P/E ratio (50.61) indicates overvaluation risk. | Medium | Medium |
| Debt Management | Debt-to-assets at 23.22% is manageable; interest coverage is favorable. | Low | Low |
| Market Volatility | Beta of 1.107 implies above-average sensitivity to market swings. | Medium | Medium |
| Industry Cyclicality | Exposure to fuel price spikes and economic downturns affects demand. | High | High |
Southwest’s liquidity remains a critical red flag, with a current ratio well below 1, indicating potential short-term funding difficulties. Profitability metrics lag industry averages, reflecting pressure from operational costs and competitive pricing. The stock’s high P/E ratio also raises valuation concerns amid uncertain growth. Despite manageable debt, cyclical risks from volatile fuel prices and economic shifts continue to weigh heavily on performance.
Should You Buy Southwest Airlines Co.?
Southwest Airlines Co. appears to have a challenging profitability and leverage profile, with declining ROIC suggesting value erosion despite manageable debt levels. While operational efficiency could improve, the overall rating of C indicates a moderate risk-return balance worth careful consideration.
Strength & Efficiency Pillars
Southwest Airlines Co. shows a strong financial health profile, with an Altman Z-score of 2.38 placing it in the grey zone, signaling moderate bankruptcy risk. Its Piotroski score of 7 indicates robust financial strength. Interest coverage stands favorable at 5.98, reflecting manageable debt costs. However, profitability metrics such as ROIC at 1.79% lag behind WACC of 7.82%, marking the company as a value destroyer rather than creator. Despite this, operational efficiency remains neutral with asset turnover near 1.0.
Weaknesses and Drawbacks
Profitability challenges weigh heavily, with a low net margin of 1.57% and ROE at 5.53%, both unfavorable compared to industry averages. The stock trades at a high P/E of 50.61, implying a premium valuation that may not be justified by earnings growth. Liquidity poses a red flag; current and quick ratios of 0.52 and 0.45 reveal potential short-term solvency issues. These factors contribute to a slightly unfavorable ratio outlook and heightened risk amid mixed income statement signals.
Our Verdict about Southwest Airlines Co.
Southwest Airlines presents an unfavorable long-term fundamental profile due to weak profitability and value destruction. Yet, the bullish overall stock trend and strong recent buyer dominance (79.47%) suggest positive market sentiment. Despite these technical strengths, the fundamental challenges imply that investors might consider a cautious, wait-and-see approach before committing capital.
Disclaimer: This content is for informational purposes only and does not constitute financial, investment, or other professional advice. Investing in financial markets involves a significant risk of loss, and past performance is not indicative of future results.
Additional Resources
- Some May Be Optimistic About Southwest Airlines’ (NYSE:LUV) Earnings – Yahoo Finance (Feb 05, 2026)
- Southwest Airlines Co. $LUV Shares Sold by Jones Financial Companies Lllp – MarketBeat (Feb 05, 2026)
- Southwest Airlines marks 188th quarterly dividend to shareholders – Stock Titan (Feb 05, 2026)
- Southwest Airlines (LUV) posts $7.4B revenue for Q4 2025 as EPS beats guidance – MSN (Feb 04, 2026)
- Southwest Airlines Co (LUV) Shares Up 3.3% on Feb 2 – GuruFocus (Feb 02, 2026)
For more information about Southwest Airlines Co., please visit the official website: southwest.com