Home > Analyses > Healthcare > Solventum Corporation
Solventum Corporation transforms healthcare delivery with cutting-edge medical and dental solutions. Its innovative products enhance patient care, from advanced wound management to precision dental aligners and filtration technologies. The company leverages software to streamline clinical workflows and optimize outcomes. As a rising force in healthcare innovation, Solventum’s growth trajectory commands attention. Yet, investors must ask: do its fundamentals justify current valuations and future expansion potential?

Table of contents
Business Model & Company Overview
Solventum Corporation, founded in 2023 and headquartered in Maplewood, MN, stands as a rapidly emerging leader in the Medical – Care Facilities industry. Its ecosystem integrates advanced wound care, dental and orthodontic products, health information systems, and purification technologies. This cohesive portfolio directly addresses critical customer and patient needs, reflecting a mission to enhance healthcare outcomes across multiple fronts.
The company drives revenue through a balanced mix of tangible medical supplies and innovative software solutions. Its Medsurg and Dental Solutions segments supply essential consumables, while Health Information Systems delivers recurring software services that increase operational efficiency. Solventum’s presence spans the Americas, Europe, and Asia, cementing its competitive advantage in global healthcare markets. I see its diverse product suite as a robust economic moat, shaping the future landscape of medical care.
Financial Performance & Fundamental Metrics
I will analyze Solventum Corporation’s income statement, key financial ratios, and dividend payout policy to assess its profitability, efficiency, and shareholder returns.
Income Statement
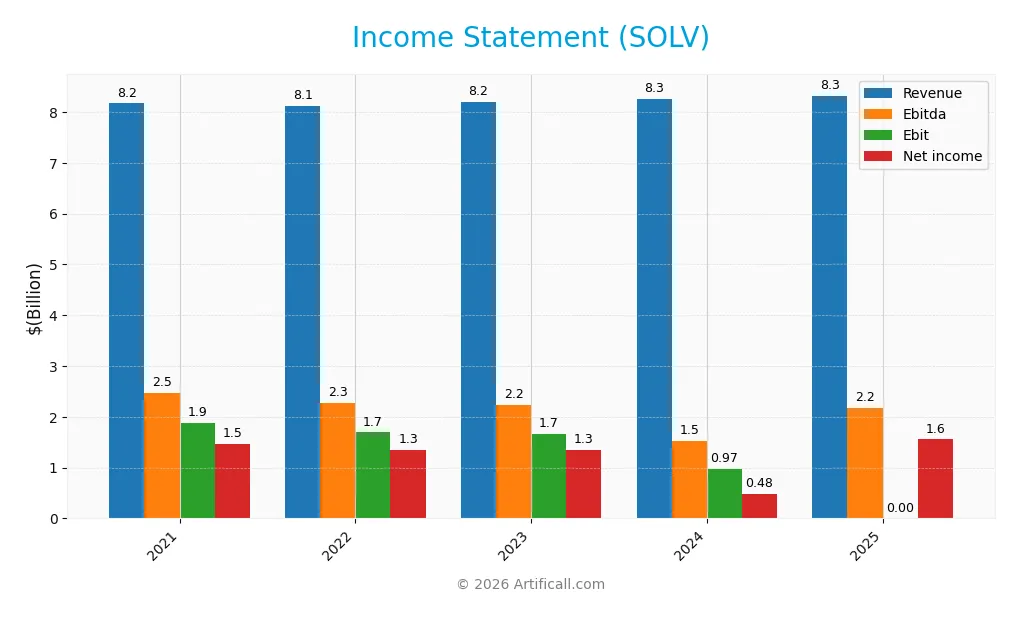
The table below summarizes Solventum Corporation’s key income statement items for the fiscal years 2021 through 2025, reported in USD.
| 2021 | 2022 | 2023 | 2024 | 2025 | |
|---|---|---|---|---|---|
| Revenue | 8.17B | 8.13B | 8.20B | 8.25B | 8.33B |
| Cost of Revenue | 3.25B | 3.44B | 3.50B | 3.66B | 3.87B |
| Operating Expenses | 3.04B | 3.00B | 3.00B | 3.56B | 3.82B |
| Gross Profit | 4.92B | 4.70B | 4.69B | 4.59B | 4.45B |
| EBITDA | 2.48B | 2.27B | 2.23B | 1.53B | 2.18B |
| EBIT | 1.88B | 1.69B | 1.67B | 972M | 0 |
| Interest Expense | 0 | 0 | 0 | 367M | 347M |
| Net Income | 1.46B | 1.34B | 1.35B | 479M | 1.56B |
| EPS | 8.47 | 7.79 | 7.79 | 2.77 | 8.94 |
| Filing Date | 2021-12-31 | 2022-12-31 | 2023-12-31 | 2025-02-28 | 2026-02-26 |
Income Statement Evolution
Solventum’s revenue grew modestly by 0.9% in 2025, continuing a slow upward trend over five years with a 1.9% total increase. Gross profit declined 3.1% last year, compressing the gross margin to 53.5%. Meanwhile, net income rose 222%, lifting net margin to a favorable 18.7%, reflecting improved bottom-line efficiency despite stagnant top-line growth.
Is the Income Statement Favorable?
In 2025, Solventum reported $8.33B revenue and $1.56B net income, yielding an 18.7% net margin, a notable improvement from prior years. However, EBIT dropped to zero, an unfavorable sign contrasting with consistent EBITDA growth. Interest expense remains manageable at 4.2% of revenue. Overall, the fundamentals appear favorable, supported by strong net income growth and stable margins.
Financial Ratios
The table below presents key financial ratios for Solventum Corporation (SOLV) over the past five fiscal years, illustrating profitability, valuation, liquidity, leverage, and efficiency metrics:
| Ratios | 2021 | 2022 | 2023 | 2024 | 2025 |
|---|---|---|---|---|---|
| Net Margin | 18% | 17% | 16% | 6% | 19% |
| ROE | 12% | 11% | 12% | 16% | 31% |
| ROIC | 12% | 11% | 11% | 7% | 18% |
| P/E | 9.5 | 10.3 | 10.3 | 23.9 | 8.9 |
| P/B | 1.14 | 1.18 | 1.18 | 3.87 | 2.73 |
| Current Ratio | 1.56 | 1.70 | 1.46 | 1.20 | 1.23 |
| Quick Ratio | 0.98 | 1.04 | 0.96 | 0.84 | 0.89 |
| D/E | 0 | 0 | 0.71 | 2.71 | 1.00 |
| Debt-to-Assets | 0 | 0 | 60% | 55% | 35% |
| Interest Coverage | 0 | 0 | 0 | 2.82 | 6.29 |
| Asset Turnover | 0.58 | 0.60 | 0.59 | 0.57 | 0.58 |
| Fixed Asset Turnover | 6.26 | 6.16 | 5.63 | 5.09 | 6.28 |
| Dividend Yield | 0% | 0% | 0% | 0% | 0% |
Evolution of Financial Ratios
Return on Equity (ROE) surged from 11.5% in 2023 to 30.8% in 2025, reflecting improved profitability. The Current Ratio declined from 1.46 to 1.23, signaling reduced short-term liquidity. Debt-to-Equity Ratio rose sharply from 0.71 to 1.0, indicating increased leverage but remaining moderate. Profit margins stabilized near 18.7% in 2025 after prior variability.
Are the Financial Ratios Favorable?
Profitability ratios such as ROE (30.8%) and net margin (18.7%) are favorable, outperforming typical sector averages. Liquidity ratios like the Current Ratio (1.23) and Quick Ratio (0.89) are neutral, suggesting adequate but not strong liquidity. Leverage metrics, including Debt-to-Equity at 1.0 and Debt-to-Assets at 35%, are neutral. Interest coverage is unfavorable at 0.0, raising concern. Overall, the ratios present a slightly favorable financial profile.
Shareholder Return Policy
Solventum Corporation does not pay dividends, reflecting its focus on reinvestment and growth. The absence of dividend payouts aligns with its strategy to prioritize capital allocation towards operations and possibly acquisitions. The company engages in share buybacks, although free cash flow coverage for these activities appears limited, signaling cautious capital deployment.
This non-distribution approach fits a long-term value creation model, provided operational margins and cash flow improve sustainably. However, investors should monitor free cash flow trends closely, as persistent negative free cash flow could constrain future buybacks or dividend initiation, posing a risk to shareholder returns.
Score analysis
The following radar chart summarizes Solventum Corporation’s key financial scores for investor evaluation:
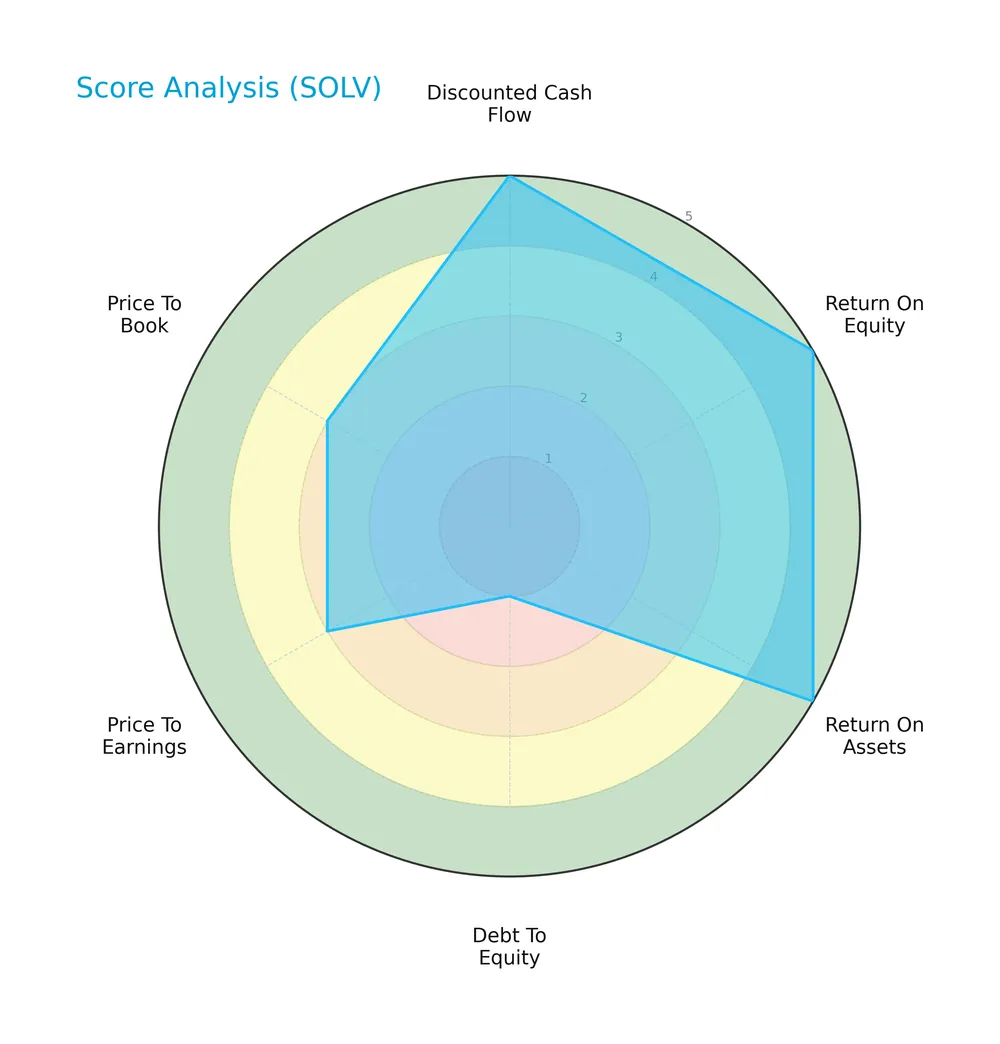
Solventum scores very favorably on discounted cash flow, ROE, and ROA at 5 each, reflecting strong profitability and cash generation. Debt to equity scores poorly at 1, signaling high leverage risk. Price-to-earnings and price-to-book ratios rate moderate at 3, indicating fair valuation metrics.
Analysis of the company’s bankruptcy risk
Solventum’s Altman Z-Score places it in the grey zone, suggesting moderate bankruptcy risk that warrants cautious monitoring:

Is the company in good financial health?
The Piotroski Score chart highlights Solventum’s average financial health status:

With a score of 6, Solventum shows reasonable strength but leaves room for improvement in profitability, leverage, or efficiency metrics to reach a robust financial position.
Competitive Landscape & Sector Positioning
This section analyzes Solventum Corporation’s strategic positioning and revenue distribution across its four business segments. I will assess whether Solventum holds a competitive advantage relative to its main industry peers.
Strategic Positioning
Solventum Corporation maintains a diversified product portfolio across four distinct healthcare segments: Medsurg, Dental Solutions, Health Information Systems, and Purification and Filtration. Its revenue balance shows a significant geographic exposure, with 4.75B USD from the U.S. and 3.51B USD from international markets.
Revenue by Segment
This pie chart illustrates Solventum Corporation’s revenue distribution by segment for the fiscal year 2024, highlighting the company’s reliance on product sales.
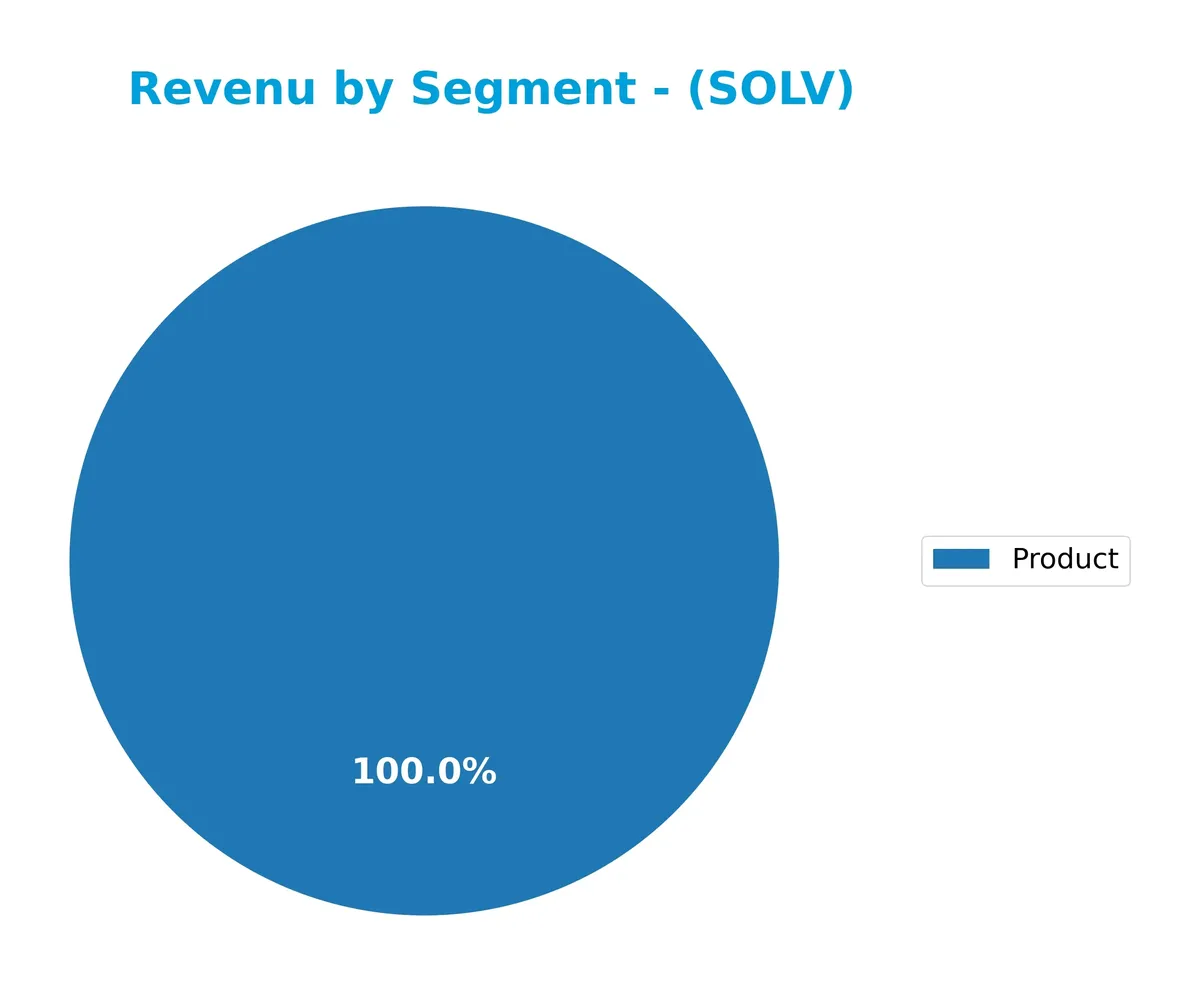
In 2024, Solventum’s revenue is driven exclusively by its Product segment, generating 6.3B USD. The absence of other segments indicates a concentrated business model focused on product sales. This concentration can signal strong expertise but also raises risks if market demand shifts or competition intensifies. Investors should watch for diversification efforts in future reports to mitigate concentration risk.
Key Products & Brands
The following table outlines Solventum Corporation’s main products and brands across its operating segments:
| Product | Description |
|---|---|
| Medsurg | Advanced wound care, I.V. site management, sterilization assurance, temperature management, surgical supplies, stethoscopes, medical electrodes. |
| Dental Solutions | Dental and orthodontic products including brackets, aligners, restorative cements, bonding agents. |
| Health Information Systems | Software solutions such as physician documentation, direct-to-bill automation, coding, speech recognition, and data visualization platforms. |
| Purification and Filtration | Purification technologies including filters, purifiers, cartridges, and membranes. |
Solventum’s diversified portfolio spans medical supplies, dental products, healthcare IT, and filtration technologies, addressing critical healthcare needs through innovation and comprehensive solutions.
Main Competitors
There are 4 main competitors in the Healthcare sector for Medical – Care Facilities, with the top 10 leaders by market capitalization listed below:
| Competitor | Market Cap. |
|---|---|
| HCA Healthcare, Inc. | 114B |
| Universal Health Services, Inc. | 14B |
| Solventum Corporation | 13.7B |
| DaVita Inc. | 8.1B |
Solventum Corporation ranks 3rd among its 4 competitors. Its market cap is 11.7% of the leader, HCA Healthcare. Solventum sits below both the average market cap of the top 10 competitors (37.5B) and the median sector market cap (13.9B). It holds a 6.23% gap above its nearest competitor Universal Health Services.
Comparisons with competitors
Check out how we compare the company to its competitors:
Does SOLV have a competitive advantage?
Solventum Corporation demonstrates a very favorable competitive advantage, consistently creating value by generating a ROIC well above its WACC. Its growing ROIC trend signals strong and sustainable profitability in the healthcare sector.
Looking ahead, Solventum’s diversified segments—Medsurg, Dental Solutions, Health Information Systems, and Purification and Filtration—offer varied growth opportunities. The company’s focus on innovative solutions positions it well to capture new markets and meet evolving customer needs.
SWOT Analysis
This analysis highlights Solventum Corporation’s core strategic factors to guide investment decisions.
Strengths
- Strong ROIC at 17.8% well above WACC
- Diversified healthcare segments
- Favorable net margin at 18.7%
Weaknesses
- Flat revenue growth 0.9% in 2025
- Unfavorable EBIT margin at 0%
- Moderate liquidity ratios (current 1.23)
Opportunities
- Expansion in health IT software
- Growth in dental solutions market
- Increasing demand for purification technologies
Threats
- Competitive healthcare sector
- Regulatory risks in medical devices
- Economic sensitivity affecting capital spending
Solventum shows a solid value-creating moat and robust profitability. However, revenue stagnation and weak EBIT highlight operational challenges. The company must leverage innovation and market expansion to sustain growth amid sector headwinds.
Stock Price Action Analysis
The following weekly chart illustrates Solventum Corporation’s stock price movements over the past 12 months, highlighting key highs and lows:
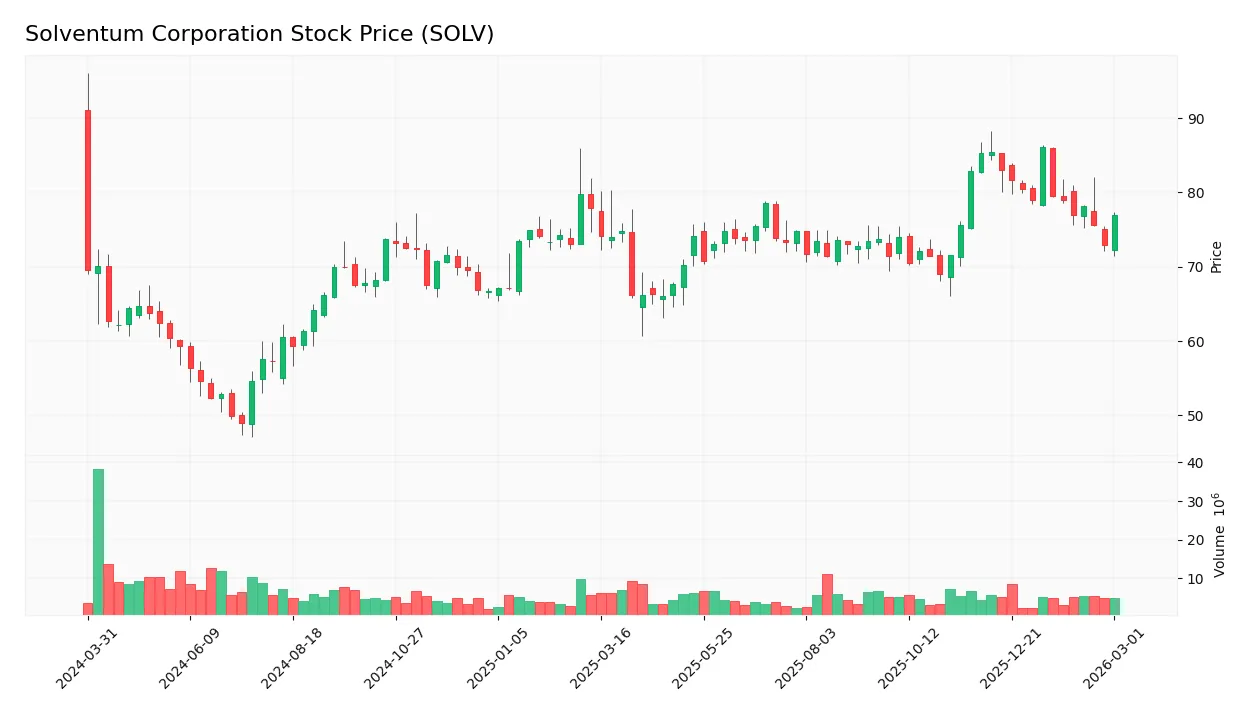
Trend Analysis
Over the past 12 months, SOLV’s stock rose 9.82%, indicating a bullish trend with decelerating momentum. The price ranged from a low of 49.0 to a high of 86.14, with volatility measured by a standard deviation of 7.62. Recent months show a reversal, with a 7.28% decline since December 2025, signaling short-term bearish pressure.
Volume Analysis
Trading volume for SOLV has been decreasing overall, with sellers dominating recent activity at 73% of volume since December 2025. This seller-driven pattern suggests waning investor confidence and reduced market participation, reflecting caution among shareholders amid recent price weakness.
Target Prices
Analysts set a clear target consensus for Solventum Corporation, reflecting moderate optimism.
| Target Low | Target High | Consensus |
|---|---|---|
| 77 | 105 | 95.8 |
The target range suggests upside potential near 10% from current levels. Analysts expect steady growth but acknowledge some volatility.

Don’t Let Luck Decide Your Entry Point
Optimize your entry points with our advanced ProRealTime indicators. You’ll get efficient buy signals with precise price targets for maximum performance. Start outperforming now!
Analyst & Consumer Opinions
This section examines analyst ratings and consumer feedback to provide a comprehensive view of Solventum Corporation’s market perception.
Stock Grades
Here are the latest verified analyst grades for Solventum Corporation from leading firms:
| Grading Company | Action | New Grade | Date |
|---|---|---|---|
| Keybanc | Upgrade | Overweight | 2026-01-26 |
| Mizuho | Upgrade | Outperform | 2026-01-20 |
| Stifel | Maintain | Buy | 2026-01-07 |
| BTIG | Upgrade | Buy | 2025-12-02 |
| UBS | Maintain | Neutral | 2025-11-10 |
| Piper Sandler | Maintain | Overweight | 2025-11-07 |
| Wells Fargo | Maintain | Equal Weight | 2025-09-15 |
| Wells Fargo | Maintain | Equal Weight | 2025-08-08 |
| Piper Sandler | Maintain | Overweight | 2025-08-08 |
| Morgan Stanley | Upgrade | Overweight | 2025-07-15 |
The consensus shows a clear trend toward positive sentiment, with multiple upgrades to buy and overweight ratings. Neutral and hold views remain but are fewer, indicating growing confidence in the stock’s outlook.
Consumer Opinions
Consumer sentiment around Solventum Corporation reveals a mix of enthusiasm and concern, reflecting the company’s evolving market position.
| Positive Reviews | Negative Reviews |
|---|---|
| “Solventum’s product reliability exceeds expectations.” | “Customer service response times are frustratingly slow.” |
| “Impressive innovation and user-friendly design.” | “Pricing feels steep compared to competitors.” |
| “The company delivers consistent quality over time.” | “Occasional delays in order fulfillment.” |
Overall, consumers praise Solventum for its product quality and innovation, fostering loyalty. However, recurring complaints about customer service and pricing suggest areas for urgent improvement to maintain competitive advantage.
Risk Analysis
Below is a detailed table outlining key risks facing Solventum Corporation, their probability, and potential impact:
| Category | Description | Probability | Impact |
|---|---|---|---|
| Financial Leverage | Debt-to-equity ratio of 1.0 signals moderate leverage risk, increasing financial expenses. | Medium | Medium |
| Liquidity | Current ratio at 1.23 and quick ratio at 0.89 indicate tight short-term liquidity conditions. | Medium | Medium |
| Interest Coverage | Interest coverage is zero, a red flag suggesting inability to cover interest expenses from EBIT. | High | High |
| Dividend Policy | No dividend yield may deter income-focused investors, impacting market sentiment. | High | Low |
| Market Volatility | Beta of 0.51 suggests low sensitivity to market swings but potential underperformance in rallies. | Low | Medium |
| Bankruptcy Risk | Altman Z-Score at 2.16 places Solventum in the grey zone, implying moderate bankruptcy risk. | Medium | High |
| Operational Risk | Diverse segments expose the company to sector-specific regulatory and competitive pressures. | Medium | Medium |
I emphasize the interest coverage risk and moderate bankruptcy risk as most critical. Zero interest coverage warns of strained earnings against debt costs. The Altman Z-Score in the grey zone signals caution despite strong ROIC and ROE metrics. Investors must monitor debt management closely amid rising interest rates.
Should You Buy Solventum Corporation?
Solventum appears to be in a very favorable position with a durable moat supported by strong value creation and improving profitability. Despite a challenging leverage profile, its overall rating of A suggests a solid financial foundation, though some caution around debt remains prudent.
Strength & Efficiency Pillars
Solventum Corporation exhibits strong operational efficiency with a net margin of 18.69% and a return on equity (ROE) of 30.82%. Its return on invested capital (ROIC) stands at 17.76%, well above the weighted average cost of capital (WACC) at 5.87%, confirming the company as a clear value creator. The firm maintains a favorable gross margin of 53.47%, underscoring operational strength despite a flat EBIT margin. A growing ROIC trend further signals improving profitability and a sustainable competitive advantage.
Weaknesses and Drawbacks
Solventum faces moderate financial risks with an Altman Z-Score of 2.16, placing it in the grey zone—indicating some solvency concerns. The company’s debt-to-equity ratio of 1.0 and interest coverage ratio at 0.0 raise caution about its ability to service debt comfortably. While the P/E ratio of 8.87 is reasonable, the P/B ratio of 2.73 and neutral liquidity ratios (current ratio 1.23, quick ratio 0.89) suggest limited cushion against market volatility. Recent seller dominance (27.11% buyer volume) signals short-term market pressure.
Our Final Verdict about Solventum Corporation
Solventum’s long-term fundamentals appear solid, driven by strong profitability and value creation. However, its grey zone Altman Z-Score and weak interest coverage highlight solvency vulnerabilities. Despite a bullish overall price trend, recent seller dominance suggests a cautious stance. This profile might appear attractive for investors willing to accept moderate financial risk but warrants a wait-and-see approach for conservative capital.
Disclaimer: This content is for informational purposes only and does not constitute financial, investment, or other professional advice. Investing in financial markets involves a significant risk of loss, and past performance is not indicative of future results.
Additional Resources
- Solventum Reports Fourth Quarter 2025 Financial Results and Introduces 2026 Full-Year Guidance – PR Newswire (Feb 26, 2026)
- Solventum (SOLV) Surpasses Q4 Earnings and Revenue Estimates – Yahoo Finance (Feb 26, 2026)
- Solventum’s (NYSE:SOLV) Q4 CY2025 Sales Top Estimates – Finviz (Feb 26, 2026)
- Solventum Corporation 2025 Q4 – Results – Earnings Call Presentation (NYSE:SOLV) 2026-02-26 – Seeking Alpha (Feb 26, 2026)
- Solventum Corporation Announces Increase In Q4 Income – Nasdaq (Feb 26, 2026)
For more information about Solventum Corporation, please visit the official website: solventum.com