Home > Analyses > Technology > Snowflake Inc.
Snowflake transforms how businesses harness data, turning scattered information into a unified, actionable asset. Its cloud-native platform leads the application software industry, enabling organizations to unlock powerful insights and build data-driven solutions. Renowned for innovation and scalability, Snowflake shapes the future of enterprise data management. Yet, as market valuations fluctuate, I question whether its fundamentals still support robust growth and justify investor confidence in 2026.

Table of contents
Business Model & Company Overview
Snowflake Inc., founded in 2012 and headquartered in Bozeman, Montana, commands a leading role in the Software – Application sector. Its cloud-based Data Cloud platform unifies data into a single source of truth, empowering organizations of all sizes to generate actionable insights, develop data-driven applications, and share information seamlessly. This cohesive ecosystem drives its core mission to transform how businesses harness data globally.
The company’s revenue engine balances scalable software subscriptions with recurring services, fueling growth across the Americas, Europe, and Asia. Snowflake’s platform-centric model leverages its robust infrastructure to attract diverse industries, enhancing customer retention and lifetime value. Its strong competitive advantage lies in pioneering data cloud solutions that shape the future of enterprise data management.
Financial Performance & Fundamental Metrics
I analyze Snowflake Inc.’s income statement, key financial ratios, and dividend payout policy to assess its core financial health and shareholder value.
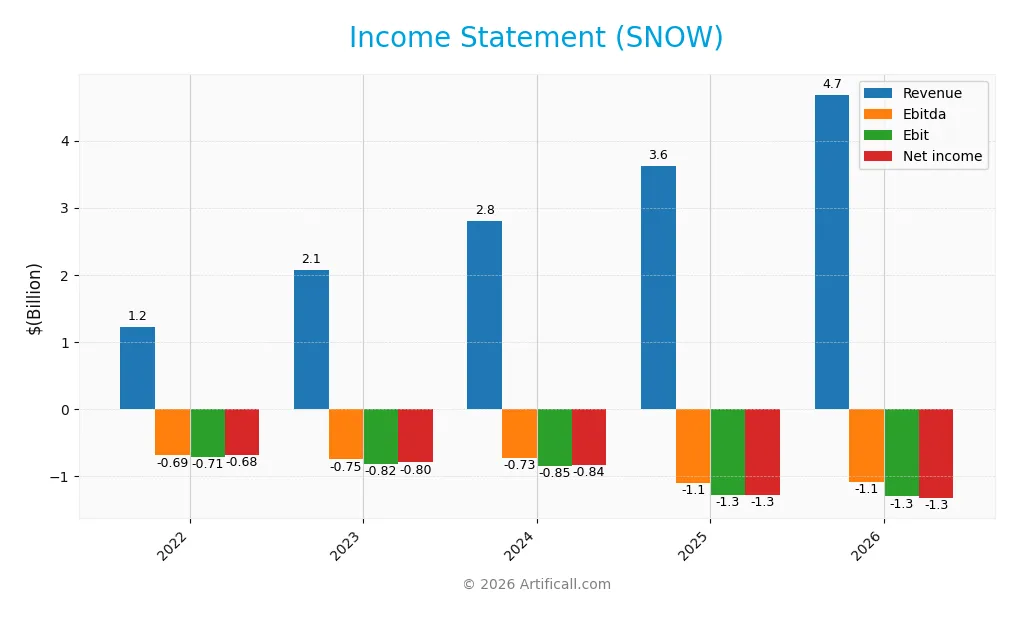
Income Statement
The table below summarizes Snowflake Inc.’s income statement for fiscal years 2022 through 2026, reflecting revenue growth alongside persistent operating losses.
| 2022 | 2023 | 2024 | 2025 | 2026 | |
|---|---|---|---|---|---|
| Revenue | 1.22B | 2.07B | 2.81B | 3.63B | 4.68B |
| Cost of Revenue | 458M | 718M | 899M | 1.21B | 1.54B |
| Operating Expenses | 1.48B | 2.19B | 3.00B | 3.87B | 4.58B |
| Gross Profit | 761M | 1.35B | 1.91B | 2.41B | 3.15B |
| EBITDA | -694M | -752M | -729M | -1.10B | -1.08B |
| EBIT | -715M | -816M | -849M | -1.28B | -1.30B |
| Interest Expense | 0 | 0 | 0 | 2.76M | 8.30M |
| Net Income | -680M | -797M | -836M | -1.29B | -1.33B |
| EPS | -2.26 | -2.50 | -2.55 | -3.86 | -3.95 |
| Filing Date | 2022-03-30 | 2023-03-29 | 2024-03-26 | 2025-03-21 | 2026-03-20 |
Income Statement Evolution
Snowflake’s revenue surged 29.2% from 2025 to 2026, continuing a strong growth trend since 2022. Gross profit expanded 30.5%, maintaining a favorable gross margin near 67%. However, EBIT declined slightly by 1.7%, reflecting continued operating losses. Net income remained negative but improved margin-wise, showing a 19.8% net margin growth over one year.
Is the Income Statement Favorable?
In 2026, Snowflake posted $4.68B revenue with a 67.2% gross margin, indicating solid top-line profitability. Operating expenses grew proportionally, leading to an unfavorable EBIT margin of -27.8%. Interest expense remained minimal at 0.18% of revenue, a positive note. Despite a net loss of $1.33B, net margin showed improvement, supporting a generally favorable fundamental outlook.
Financial Ratios
The following table summarizes key financial ratios for Snowflake Inc. over the last five fiscal years:
| Ratios | 2022 | 2023 | 2024 | 2025 | 2026 |
|---|---|---|---|---|---|
| Net Margin | -56% | -39% | -30% | -35% | -28% |
| ROE | -13% | -15% | -16% | -43% | -69% |
| ROIC | -14% | -14% | -20% | -25% | -30% |
| P/E | -122 | -63 | -77 | -47 | -49 |
| P/B | 16.4 | 9.1 | 12.4 | 20.1 | 33.8 |
| Current Ratio | 3.29 | 2.50 | 1.85 | 1.75 | 1.30 |
| Quick Ratio | 3.29 | 2.50 | 1.85 | 1.75 | 1.30 |
| D/E | 0.04 | 0.05 | 0.06 | 0.90 | 1.42 |
| Debt-to-Assets | 3.1% | 3.3% | 3.5% | 29.7% | 30.0% |
| Interest Coverage | 0 | 0 | 0 | -528 | -173 |
| Asset Turnover | 0.18 | 0.27 | 0.34 | 0.40 | 0.51 |
| Fixed Asset Turnover | 4.13 | 5.27 | 5.62 | 5.53 | 8.95 |
| Dividend Yield | 0 | 0 | 0 | 0 | 0 |
Note: Percentages are rounded to nearest whole number. Negative P/E reflects net losses. Interest coverage ratio below zero signals inability to cover interest expenses from earnings.
Evolution of Financial Ratios
Between 2022 and 2026, Snowflake’s Return on Equity (ROE) declined sharply from -13.47% to -69.21%. The Current Ratio dropped steadily from 3.29 to 1.30, signaling reduced short-term liquidity. Debt-to-Equity Ratio surged from 0.04 to 1.42, reflecting increased leverage. Profitability remained negative throughout, with margins worsening before a slight improvement in gross profit margin.
Are the Financial Ratios Favorable?
In 2026, Snowflake’s profitability ratios remain unfavorable, with net margin at -28.43% and ROE at -69.21%. Liquidity is mixed: the Current Ratio of 1.3 is neutral, while Quick Ratio is favorable at 1.3. Leverage is elevated, with a Debt-to-Equity Ratio of 1.42 marked unfavorable. Asset turnover is neutral, and market valuation ratios like Price-to-Book at 33.8 are unfavorable. Overall, the ratio profile is slightly unfavorable.
Shareholder Return Policy
Snowflake Inc. does not pay dividends, reflecting its continued net losses and reinvestment strategy focused on growth and innovation. Despite no dividend yield, the company has not engaged in share buybacks, signaling prioritization of capital for expansion rather than immediate shareholder payouts.
This approach aligns with long-term value creation through reinvestment in R&D and market share gains. However, persistent negative profitability and high leverage remain risks, requiring investors to monitor whether future cash flows can sustainably support shareholder returns.
Score analysis
This radar chart illustrates Snowflake Inc.’s valuation and financial performance scores across key metrics:
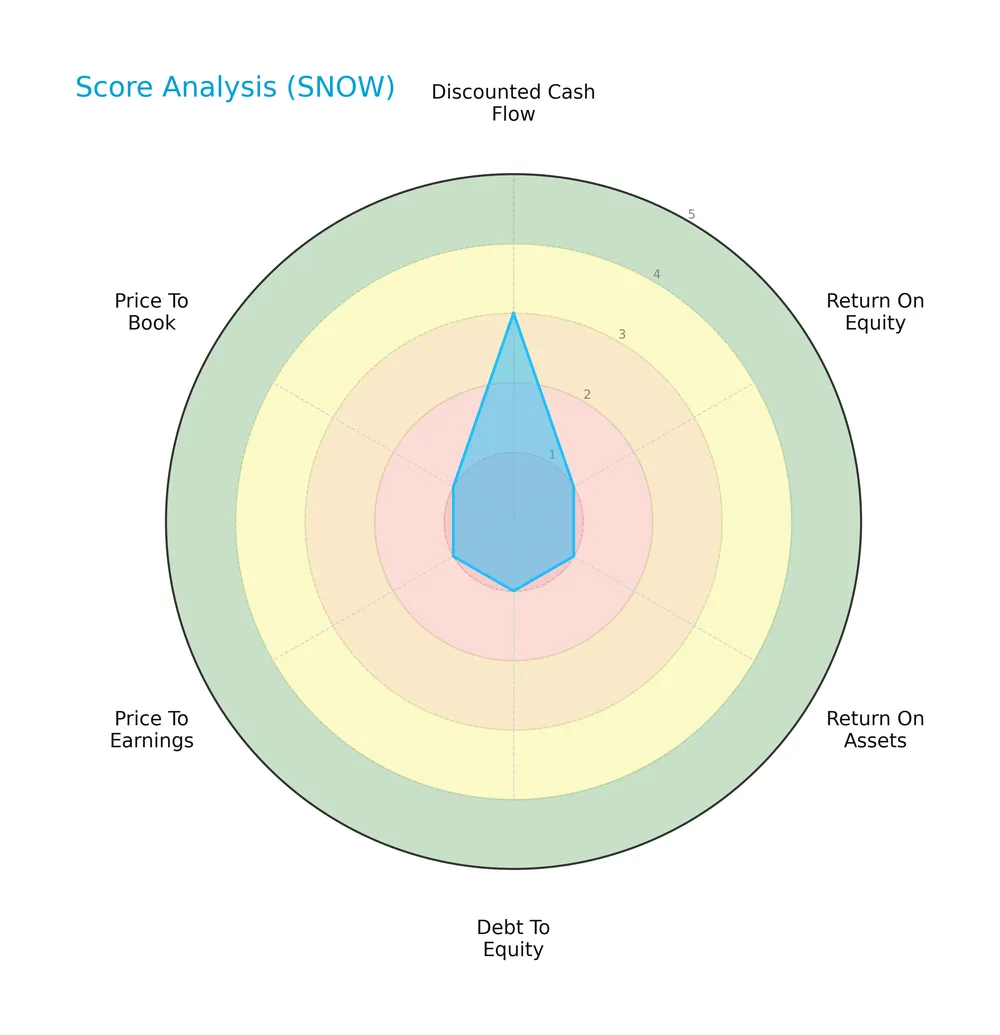
Snowflake’s discounted cash flow score registers a moderate 3, while all other scores—including ROE, ROA, debt-to-equity, PE, and PB—are very unfavorable at 1. This highlights challenges in profitability, leverage, and valuation metrics.
Analysis of the company’s bankruptcy risk
The Altman Z-Score places Snowflake firmly in the safe zone, indicating a low risk of bankruptcy based on financial stability and liquidity:

Is the company in good financial health?
The Piotroski Score diagram summarizes Snowflake’s financial strength with an average rating:

A score of 4 suggests mixed signals on profitability, leverage, and efficiency, reflecting moderate financial health but room for improvement in key operational areas.
Competitive Landscape & Sector Positioning
This analysis examines Snowflake Inc.’s strategic positioning within the software-application sector. It covers revenue by segment, key products, main competitors, and competitive advantages. I will assess whether Snowflake holds a sustainable edge over its industry peers.
Strategic Positioning
Snowflake Inc. concentrates revenue heavily in its core product segment, which surged to $4.47B in 2026, with professional services remaining a small fraction. Geographically, it dominates the US market at $3.65B, while expanding steadily in EMEA and Asia-Pacific regions.
Revenue by Segment
This pie chart illustrates Snowflake Inc.’s revenue breakdown by segment for fiscal year 2026, highlighting the contributions of Product and Professional Services and Other.
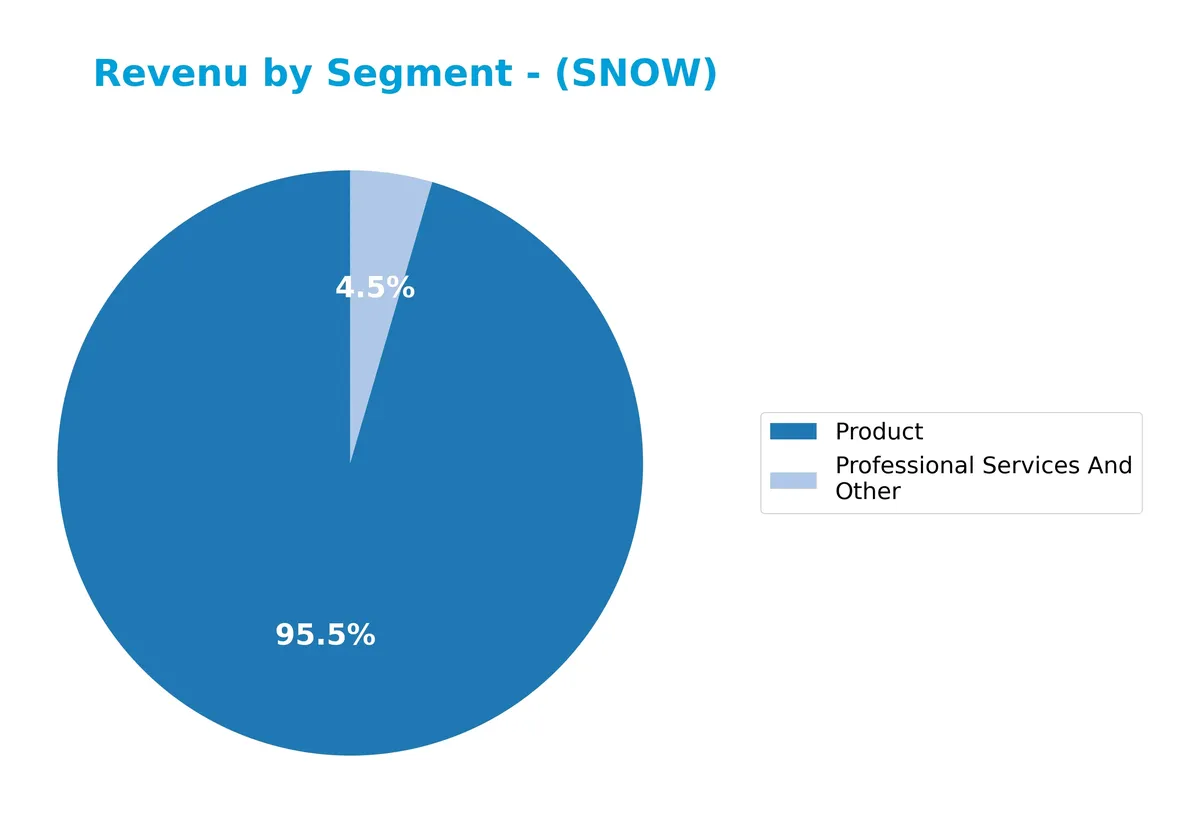
Snowflake’s revenue remains heavily concentrated in its Product segment, which surged to $4.47B in 2026 from $3.46B in 2025, reflecting strong platform adoption and scale. Professional Services, while much smaller at $212M, also shows steady growth. This concentration underscores Snowflake’s reliance on its core software offerings, emphasizing the need to monitor product innovation and competitive pressures closely.
Key Products & Brands
The table below presents Snowflake Inc.’s main products and services with their respective descriptions:
| Product | Description |
|---|---|
| Product | Cloud-based Data Cloud platform enabling data consolidation, insights, applications, and data sharing. |
| Professional Services And Other | Consulting, implementation, and additional services supporting the core cloud data platform. |
Snowflake’s revenue primarily derives from its Data Cloud platform, supplemented by professional services. The product segment drives substantial growth, reflecting strong demand for cloud data solutions.
Main Competitors
Snowflake Inc. faces competition from 33 companies, with the following top 10 leaders ranked by market capitalization:
| Competitor | Market Cap. |
|---|---|
| Salesforce, Inc. | 242.5B |
| Shopify Inc. | 209.6B |
| AppLovin Corporation | 209.0B |
| Intuit Inc. | 175.2B |
| Uber Technologies, Inc. | 172.2B |
| ServiceNow, Inc. | 153.0B |
| Cadence Design Systems, Inc. | 84.5B |
| Snowflake Inc. | 73.4B |
| Autodesk, Inc. | 61.2B |
| Workday, Inc. | 54.9B |
Snowflake ranks 8th among its 33 competitors. It holds 21.8% of the market cap of the leader, Salesforce. Snowflake’s market cap is below the average of the top 10 competitors but above the sector median. It maintains a significant 60% gap to the next competitor above, Cadence Design Systems.
Comparisons with competitors
Check out how we compare the company to its competitors:
Does SNOW have a competitive advantage?
Snowflake Inc. does not currently present a competitive advantage. Its return on invested capital (ROIC) is significantly below its cost of capital, indicating value destruction and declining profitability.
Looking ahead, Snowflake’s strong revenue growth and expanding international sales suggest opportunities in new markets. The company’s cloud-based data platform may drive future gains despite current challenges in profitability.
SWOT Analysis
This SWOT analysis highlights Snowflake Inc.’s key internal and external factors shaping its strategic outlook.
Strengths
- Strong revenue growth at 29% YoY
- Robust gross margins above 67%
- Leading cloud data platform with global reach
Weaknesses
- Negative net margin near -28%
- Declining ROIC well below WACC
- High debt-to-equity ratio at 1.42
Opportunities
- Expanding international markets, especially EMEA and Asia
- Increasing demand for cloud data solutions
- Potential for operational efficiency improvements
Threats
- Intense competition in cloud software
- Market volatility impacting valuation
- Rising costs pressure profitability
Snowflake exhibits impressive top-line momentum and a scalable platform but struggles with profitability and capital efficiency. Its strategy must focus on converting growth into sustainable earnings while managing leverage and competitive risks.
Stock Price Action Analysis
The following weekly chart illustrates Snowflake Inc.’s stock price movement over the last 12 months, highlighting key fluctuations and trend shifts:
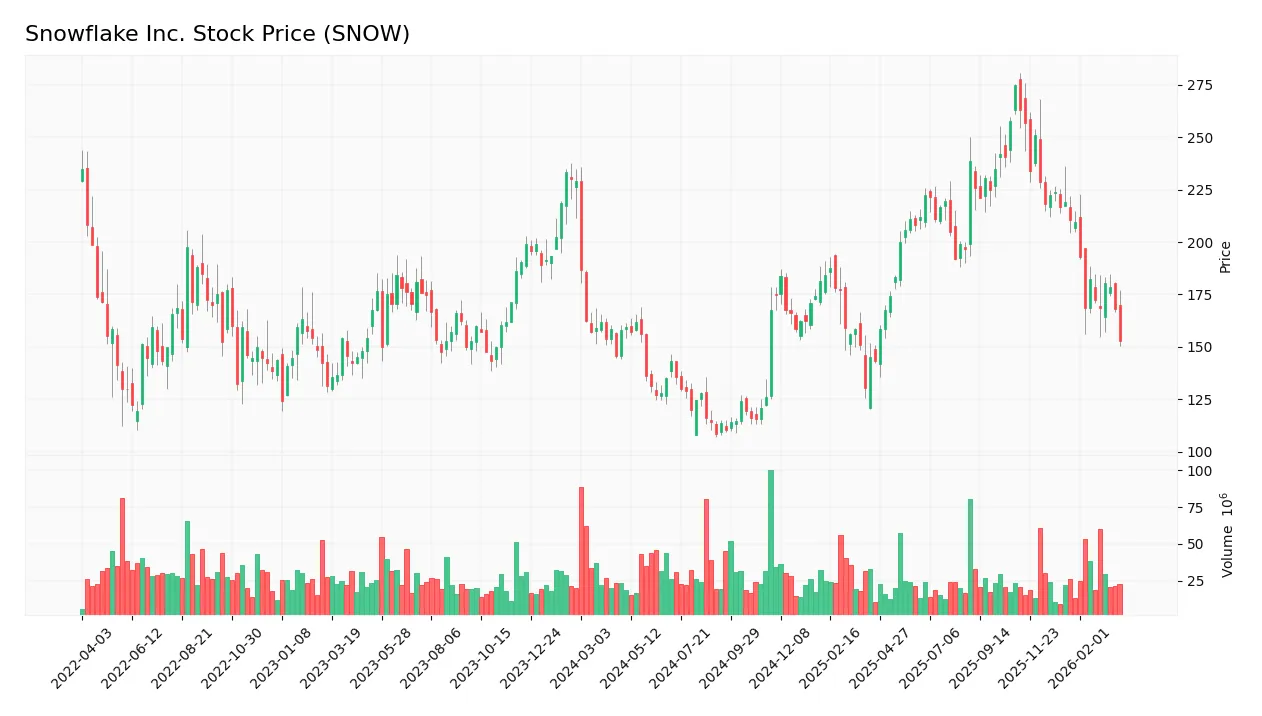
Trend Analysis
Over the past 12 months, SNOW’s price declined by 4.09%, indicating a bearish trend. The stock peaked at 274.88 and bottomed at 108.56, showing high volatility with a 42.15 standard deviation. The trend shows deceleration, suggesting a slowing pace of decline.
Volume Analysis
In the last three months, trading volumes decreased with sellers dominating at 74.37%. Buyer participation dropped to 25.63%, reflecting weaker demand and bearish investor sentiment. The declining volume signals reduced market engagement amid selling pressure.
Target Prices
Analysts set a clear target consensus for Snowflake Inc., indicating strong growth expectations.
| Target Low | Target High | Consensus |
|---|---|---|
| 177 | 325 | 249.35 |
The target range from 177 to 325 reflects varied optimism, with a consensus near 250 signaling robust confidence in Snowflake’s future performance.

Don’t Let Luck Decide Your Entry Point
Optimize your entry points with our advanced ProRealTime indicators. You’ll get efficient buy signals with precise price targets for maximum performance. Start outperforming now!
Analyst & Consumer Opinions
This section examines Snowflake Inc.’s analyst ratings and consumer feedback to provide a balanced performance overview.
Stock Grades
Here are the latest grades from top-tier analysts on Snowflake Inc., reflecting a consistent stance across firms:
| Grading Company | Action | New Grade | Date |
|---|---|---|---|
| JP Morgan | Maintain | Overweight | 2026-02-26 |
| UBS | Maintain | Buy | 2026-02-26 |
| Wells Fargo | Maintain | Overweight | 2026-02-26 |
| DA Davidson | Maintain | Buy | 2026-02-26 |
| Morgan Stanley | Maintain | Overweight | 2026-02-26 |
| Barclays | Maintain | Equal Weight | 2026-02-26 |
| Truist Securities | Maintain | Buy | 2026-02-26 |
| Evercore ISI Group | Maintain | Outperform | 2026-02-26 |
| Bernstein | Maintain | Market Perform | 2026-02-26 |
| Stifel | Maintain | Buy | 2026-02-26 |
The consensus leans strongly toward Buy and Overweight ratings, with no downgrades or negative actions reported. This unanimity signals steady analyst confidence without recent shifts in outlook.
Consumer Opinions
Snowflake Inc. garners a mix of praise and criticism from its user base, reflecting its complex role in the data cloud sector.
| Positive Reviews | Negative Reviews |
|---|---|
| “Exceptional data integration and scalability.” | “Pricing model is complex and expensive.” |
| “User-friendly interface speeds up workflows.” | “Occasional service outages disrupt operations.” |
| “Strong customer support and implementation help.” | “Learning curve is steep for new users.” |
Overall, consumers appreciate Snowflake’s scalability and support but frequently cite high costs and usability challenges as key concerns. These themes underscore the trade-offs of adopting advanced cloud solutions.
Risk Analysis
Below is a summary table highlighting key risks Snowflake Inc. faces, along with their likelihood and potential impact:
| Category | Description | Probability | Impact |
|---|---|---|---|
| Profitability | Negative net margin (-28.43%) signals ongoing losses. | High | High |
| Financial Health | Weak ROE (-69.21%) and ROIC (-30.15%) indicate poor returns. | High | High |
| Leverage | Elevated debt-to-equity ratio (1.42) risks financial strain. | Medium | Medium |
| Interest Coverage | Negative interest coverage (-157.1) threatens debt service. | High | High |
| Valuation | Extremely high P/B ratio (33.8) suggests overvaluation risk. | Medium | Medium |
| Liquidity | Current ratio at 1.3 is adequate but not robust. | Medium | Low |
Snowflake’s most critical risks are its deep unprofitability and weak returns on invested capital despite a safe Altman Z-score. The negative interest coverage ratio signals difficulty servicing debt, a red flag in the tech sector’s current volatility. High valuation multiples compound downside risk.
Should You Buy Snowflake Inc.?
Snowflake Inc. appears to be shedding value with a declining and negative ROIC trend, suggesting an eroding competitive moat. While its leverage profile seems manageable, the overall rating of C- reflects very unfavorable profitability and efficiency metrics, indicating caution.
Strength & Efficiency Pillars
Snowflake Inc. shows operational strength with a strong gross margin of 67.17%, reflecting efficient core business execution. The company benefits from favorable revenue growth, up 29.16% year-over-year, signifying market demand. However, the return on invested capital is negative at -30.15%, well below the 9.49% WACC, indicating the company is currently destroying value rather than creating it. Despite solid top-line momentum, profitability metrics like net margin (-28.43%) and ROE (-69.21%) remain unfavorable, limiting its efficiency credentials.
Weaknesses and Drawbacks
Snowflake is in the safe zone with an Altman Z-Score of 3.07, but it faces significant challenges. Its price-to-book ratio stands at 33.8, a clear sign of a highly premium valuation that could pressure future returns. The debt-to-equity ratio at 1.42 signals elevated leverage, increasing financial risk. Recent market activity confirms seller dominance with only 25.63% buyer volume, which may exert downward pressure on the stock. Negative interest coverage (-157.1) further highlights weak earnings to service debt.
Our Final Verdict about Snowflake Inc.
Snowflake’s long-term fundamentals appear mixed. The safe Altman Z-Score reassures solvency, but the company’s value destruction and weak profitability remain key concerns. Despite strong revenue growth, recent bearish price action and seller dominance suggest a cautious stance. This profile might appear attractive only to investors willing to tolerate volatility and operational risk. A wait-and-see approach could be prudent before committing capital here.
Disclaimer: This content is for informational purposes only and does not constitute financial, investment, or other professional advice. Investing in financial markets involves a significant risk of loss, and past performance is not indicative of future results.
Additional Resources
- Nepsis Inc. Sells 11,143 Shares of Snowflake Inc. $SNOW – MarketBeat (Mar 28, 2026)
- Why the Market Dipped But Snowflake Inc. (SNOW) Gained Today – Yahoo Finance (Mar 26, 2026)
- INVESTOR ALERT: Pomerantz Law Firm Reminds Investors with Losses on their Investment in Snowflake Inc. of Class Action Lawsuit and Upcoming Deadlines – SNOW – PR Newswire (Mar 26, 2026)
- Analysts reaffirm bullish view on Snowflake Inc.’s (SNOW) AI strategy – MSN (Mar 27, 2026)
- SNOWFLAKE INC. (SNOW) SHAREHOLDER ALERT Bernstein Liebhard – GlobeNewswire (Mar 26, 2026)
For more information about Snowflake Inc., please visit the official website: snowflake.com