Home > Analyses > Industrials > Snap-on Incorporated
Snap-on Incorporated powers the hands that build, fix, and innovate across industries worldwide. Renowned for its premium tools, diagnostic systems, and service solutions, Snap-on commands a leadership position in manufacturing tools and accessories. Its blend of innovation and quality fuels professional users in automotive, aerospace, and industrial sectors. As Snap-on navigates evolving market demands, I question whether its robust fundamentals continue to justify its premium valuation and future growth potential.

Table of contents
Business Model & Company Overview
Snap-on Incorporated, founded in 1920 and based in Kenosha, Wisconsin, stands as a leader in the Manufacturing – Tools & Accessories sector. It delivers a comprehensive ecosystem of professional tools, diagnostics, and repair information. Its product suite spans hand and power tools, diagnostic software, and vehicle service equipment, serving diverse industries from aerospace to mining. This integrated approach reinforces its dominant market position and brand reliability worldwide.
The company drives revenue through a balanced mix of hardware sales, software solutions, and recurring services like financing and training. Snap-on commands strategic footprints across the Americas, Europe, and Asia, supporting vehicle dealerships, repair centers, and industrial clients. Its robust after-sales support and analytics enhance customer retention. This solid blend forms a durable economic moat, underpinning Snap-on’s role in shaping the future of professional tooling and diagnostics.
Financial Performance & Fundamental Metrics
I will analyze Snap-on Incorporated’s income statement, key financial ratios, and dividend payout policy to assess its financial health and shareholder value.
Income Statement
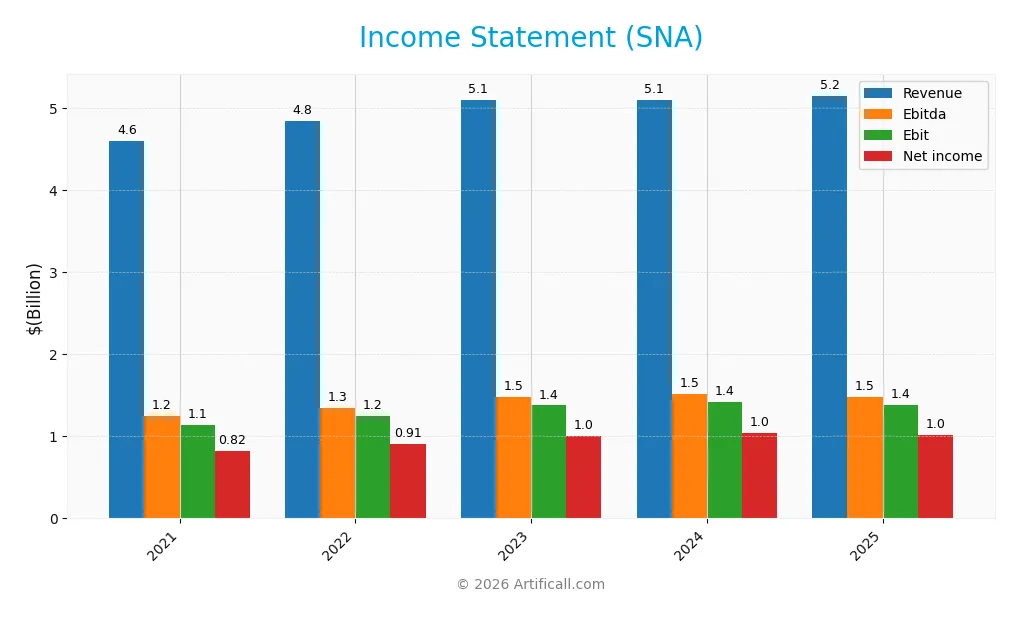
The table below summarizes Snap-on Incorporated’s key income statement items for fiscal years 2021 through 2025, showing consistent revenue growth and profitability metrics.
| 2021 | 2022 | 2023 | 2024 | 2025 | |
|---|---|---|---|---|---|
| Revenue | 4.60B | 4.84B | 5.11B | 5.11B | 5.16B |
| Cost of Revenue | 2.22B | 2.40B | 2.49B | 2.45B | 2.49B |
| Operating Expenses | 1.26B | 1.24B | 1.31B | 1.31B | 1.34B |
| Gross Profit | 2.38B | 2.45B | 2.62B | 2.65B | 2.67B |
| EBITDA | 1.24B | 1.35B | 1.48B | 1.52B | 1.48B |
| EBIT | 1.14B | 1.25B | 1.38B | 1.42B | 1.39B |
| Interest Expense | 53M | 47M | 50M | 50M | 51M |
| Net Income | 820M | 912M | 1.01B | 1.04B | 1.02B |
| EPS | 15.22 | 17.14 | 19.11 | 19.85 | 19.52 |
| Filing Date | 2022-02-11 | 2023-02-09 | 2024-02-16 | 2025-02-13 | 2026-02-12 |
Income Statement Evolution
Snap-on’s revenue rose 12.1% from 2021 to 2025 but slowed to under 1% in the last year. Net income grew 24% overall, though it dipped slightly in 2025. Gross margin held steady near 51.7%, while net margin improved by over 10% across the period, highlighting consistent profitability despite modest recent growth.
Is the Income Statement Favorable?
In 2025, Snap-on reported $5.16B revenue and $1.02B net income, with a 19.7% net margin, reflecting solid profitability. EBIT margin remained strong at 26.9%, and interest expense was less than 1% of revenue, a favorable capital structure indicator. However, recent earnings and margin growth slowed, signaling caution despite generally sound fundamentals.
Financial Ratios
The table below summarizes Snap-on Incorporated’s key financial ratios from 2021 to 2025, highlighting profitability, liquidity, leverage, and efficiency metrics:
| Ratios | 2021 | 2022 | 2023 | 2024 | 2025 |
|---|---|---|---|---|---|
| Net Margin | 17.8% | 18.8% | 19.8% | 20.4% | 19.7% |
| ROE | 19.6% | 20.3% | 19.9% | 19.4% | 17.1% |
| ROIC | 14.9% | 15.5% | 15.4% | 15.0% | 13.8% |
| P/E | 14.1 | 13.3 | 15.1 | 17.3 | 18.0 |
| P/B | 2.78 | 2.71 | 3.01 | 3.35 | 3.08 |
| Current Ratio | 3.11 | 3.47 | 3.88 | 4.15 | 4.79 |
| Quick Ratio | 2.29 | 2.40 | 2.81 | 3.17 | 3.68 |
| D/E | 0.30 | 0.28 | 0.25 | 0.24 | 0.22 |
| Debt-to-Assets | 18.6% | 18.1% | 16.9% | 16.4% | 15.8% |
| Interest Coverage | 21.1 | 25.6 | 26.3 | 27.1 | 26.3 |
| Asset Turnover | 0.68 | 0.69 | 0.68 | 0.65 | 0.61 |
| Fixed Asset Turnover | 8.07 | 8.43 | 8.32 | 8.08 | 8.11 |
| Dividend Yield | 2.38% | 2.58% | 2.33% | 2.25% | 2.53% |
Evolution of Financial Ratios
Snap-on Incorporated’s Return on Equity (ROE) exhibited a modest decline from 19.94% in 2024 to 17.14% in 2025, reflecting some pressure on profitability. The Current Ratio improved steadily, reaching 4.79 in 2025, indicating stronger liquidity. Meanwhile, the Debt-to-Equity Ratio decreased to 0.22, signaling reduced leverage and improved financial stability.
Are the Financial Ratios Fovorable?
In 2025, Snap-on’s profitability ratios, including a 19.72% net margin and 13.79% ROIC, remain favorable and comfortably exceed the 7.05% WACC. Liquidity appears mixed: a high Current Ratio (4.79) is unfavorable, possibly indicating excess assets, but the Quick Ratio (3.68) is favorable. Leverage is well managed with a 0.22 Debt-to-Equity ratio and strong interest coverage (27.45). Market multiples show neutrality or slight weakness, with a 17.98 P/E and an unfavorable 3.08 P/B ratio. Overall, 71% of key ratios are favorable.
Shareholder Return Policy
Snap-on Incorporated maintains a consistent dividend payout ratio around 35-45%, with dividends per share rising from $5.12 in 2021 to $8.87 in 2025. The annual dividend yield stands near 2.5%, supported by strong free cash flow coverage and a dividend-plus-capex coverage ratio above 2.
The company also engages in share buybacks but avoids excessive repurchases, balancing capital returns with reinvestment. This disciplined approach, coupled with stable profitability and cash flow, suggests a shareholder return policy that supports sustainable long-term value creation.
Score analysis
The following radar chart illustrates Snap-on Incorporated’s key financial scores across valuation, profitability, and leverage metrics:
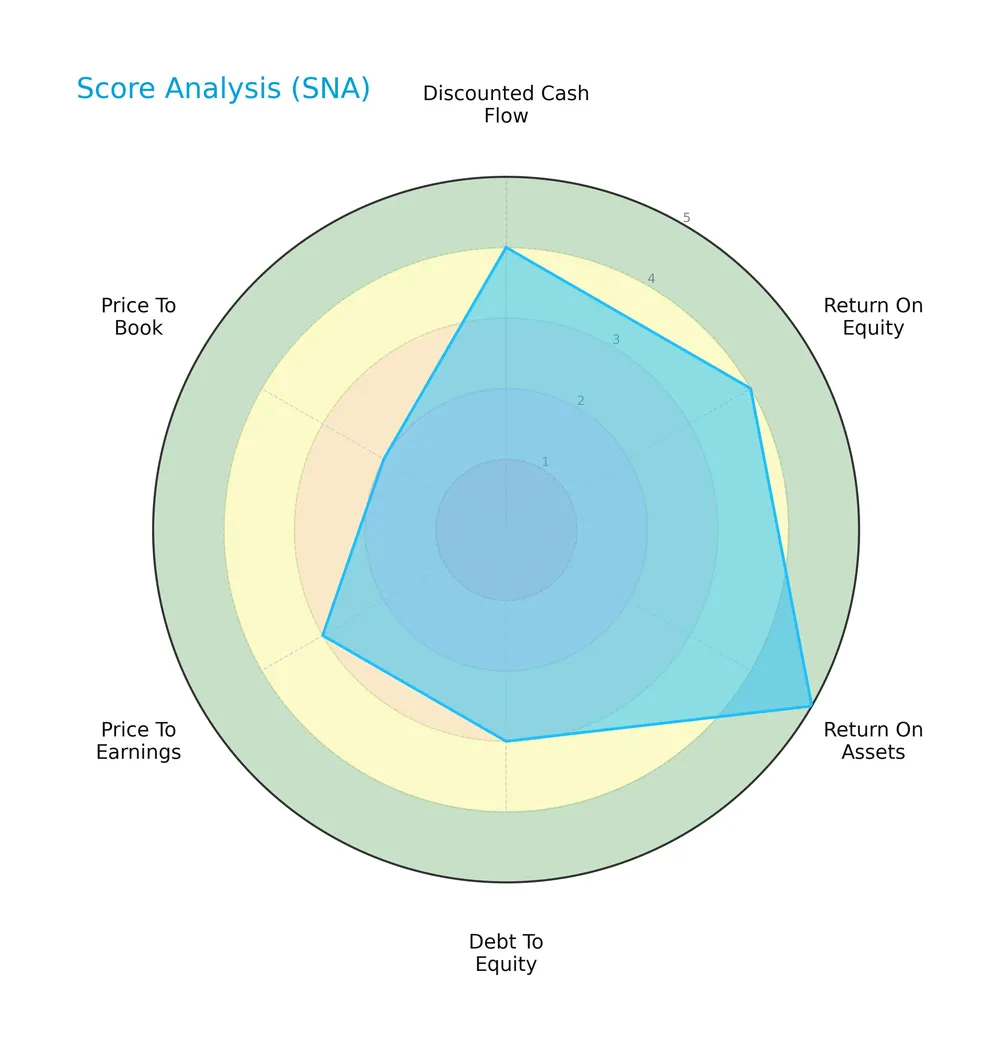
Snap-on delivers strong profitability with a return on assets score of 5 and return on equity score of 4. Its discounted cash flow score is favorable at 4. Debt-to-equity and price-to-earnings scores stand at moderate levels of 3, while the price-to-book score trails with an unfavorable 2.
Analysis of the company’s bankruptcy risk
Snap-on’s Altman Z-Score firmly places it in the safe zone, signaling a low risk of bankruptcy:

Is the company in good financial health?
The Piotroski Score diagram below offers insight into Snap-on’s financial strength based on nine fundamental criteria:

With a Piotroski Score of 6, Snap-on demonstrates average financial health. This suggests the company maintains solid fundamentals but has room for improvement to reach stronger financial robustness.
Competitive Landscape & Sector Positioning
This analysis examines Snap-on Incorporated’s strategic positioning within the manufacturing tools and accessories sector. It covers revenue segmentation, key products, main competitors, and competitive advantages. I will assess whether Snap-on holds a sustainable competitive edge over its peers.
Strategic Positioning
Snap-on Incorporated maintains a diversified product portfolio across tools, repair systems, commercial equipment, and financial services, with 2025 revenues led by Tools Group at $1.96B. Geographically, it focuses on North America ($3.53B), Europe ($826M), and other regions ($465M), balancing industrial and professional markets globally.
Revenue by Segment
This pie chart illustrates Snap-on Incorporated’s revenue distribution by segment for fiscal year 2025, highlighting key business areas and their contribution to total sales.

In 2025, Tools Group leads with $1.96B, closely followed by Repair Systems and Information Group at $1.88B. Commercial and Industrial Group contributes $1.46B, while Financial Services adds $413M. Despite a negative figure in Product and Services excluding Financial Services, core segments show steady performance. Tools and Repair Systems segments remain the primary revenue drivers, indicating concentration risk but also stable operational focus.
Key Products & Brands
The table below outlines Snap-on Incorporated’s main products and brand groups with brief descriptions:
| Product | Description |
|---|---|
| Commercial & Industrial Group | Tools and equipment designed for commercial, industrial, and specialty markets, including wheel alignment and vehicle service equipment. |
| Repair Systems & Information Group | Diagnostic products, software solutions, repair information, and business management systems for vehicle service shops. |
| Tools Group | Hand tools, power tools, and tool storage products such as wrenches, sockets, drills, and tool chests. |
| Financial Services | Financing programs supporting product sales and franchise operations. |
Snap-on’s portfolio spans professional-grade hand and power tools, diagnostic and repair systems, and financial services. This diversified suite targets vehicle, industrial equipment servicing, and commercial sectors.
Main Competitors
There are 3 main competitors in the Industrials sector, Manufacturing – Tools & Accessories industry. The table lists the top 3 leaders by market capitalization:
| Competitor | Market Cap. |
|---|---|
| Snap-on Incorporated | 18.3B |
| Lincoln Electric Holdings, Inc. | 13.2B |
| Stanley Black & Decker, Inc. | 11.8B |
Snap-on Incorporated ranks 1st among its 3 competitors. It surpasses the next largest rival by 52.14% and is 9.4% larger than the top market cap benchmark, positioning itself well above both the average market cap of the top 10 and the median in its sector.
Comparisons with competitors
Check out how we compare the company to its competitors:
Does Snap-on have a competitive advantage?
Snap-on demonstrates a competitive advantage with a ROIC 6.7% above its WACC, indicating value creation and efficient capital use. However, its ROIC trend shows a decline, signaling caution.
The company’s broad product portfolio and diversified segments offer growth potential. Expansion in Europe and emerging markets, plus new diagnostic and repair technologies, shape its future opportunities.
SWOT Analysis
This SWOT analysis highlights Snap-on Incorporated’s key strategic factors to inform investment decisions.
Strengths
- strong gross margin at 51.7%
- favorable net margin near 20%
- robust ROIC at 13.8%, well above WACC
Weaknesses
- declining ROIC trend
- unfavorable PB ratio at 3.08
- recent negative EPS growth
Opportunities
- expanding European market sales
- growing demand for diagnostic and repair tech
- leverage financial services for franchise growth
Threats
- intense competition in industrial tools
- sensitivity to economic cycles
- rising material and labor costs
Snap-on demonstrates strong operational profitability and value creation. However, declining ROIC and valuation concerns warrant caution. The company’s strategy should focus on innovation and geographic expansion while managing cost pressures.
Stock Price Action Analysis
The weekly stock chart of Snap-on Incorporated (SNA) reflects significant price movement and recent acceleration in trend direction:

Trend Analysis
Over the past 12 months, SNA’s stock price rose 31.88%, indicating a strong bullish trend with accelerating momentum. The price ranged between 255.35 and a high of 384.61. A standard deviation of 31.69 signals notable volatility during this period.
Volume Analysis
Trading volume is increasing with 189M shares exchanged overall. Buyers dominate with 59.11% of total volume. In the recent three months, buyer dominance strengthened to 68.03%, indicating strong investor confidence and active market participation.
Target Prices
Analysts set a confident target consensus for Snap-on Incorporated, reflecting solid growth expectations.
| Target Low | Target High | Consensus |
|---|---|---|
| 375 | 409 | 396.33 |
The target range suggests analysts anticipate Snap-on’s stock to perform well, with upside potential near 9% from current levels.

Don’t Let Luck Decide Your Entry Point
Optimize your entry points with our advanced ProRealTime indicators. You’ll get efficient buy signals with precise price targets for maximum performance. Start outperforming now!
Analyst & Consumer Opinions
This section reviews Snap-on Incorporated’s analyst ratings and consumer feedback to provide a balanced market perspective.
Stock Grades
Here are the latest verified grades from recognized financial firms for Snap-on Incorporated:
| Grading Company | Action | New Grade | Date |
|---|---|---|---|
| Roth Capital | Maintain | Buy | 2026-02-10 |
| Tigress Financial | Maintain | Buy | 2025-10-21 |
| Baird | Maintain | Neutral | 2025-10-17 |
| Barrington Research | Maintain | Outperform | 2025-10-15 |
| Barrington Research | Maintain | Outperform | 2025-09-23 |
| Tigress Financial | Maintain | Buy | 2025-08-29 |
| B of A Securities | Maintain | Underperform | 2025-07-18 |
| Baird | Maintain | Neutral | 2025-07-18 |
| Barrington Research | Maintain | Outperform | 2025-07-18 |
| Barrington Research | Maintain | Outperform | 2025-07-17 |
The overall trend shows a strong inclination toward positive ratings, with multiple “Buy” and “Outperform” grades maintained across recent months. However, a minority of “Neutral” and “Underperform” grades indicate some divergence in analyst sentiment.
Consumer Opinions
Consumer sentiment around Snap-on Incorporated (SNA) reveals a balanced mix of praise and criticism, reflecting the brand’s strong reputation tempered by areas for improvement.
| Positive Reviews | Negative Reviews |
|---|---|
| Durable, high-quality tools that last. | Premium pricing deters some buyers. |
| Excellent customer service and support. | Limited product availability in some regions. |
| Innovative designs that improve efficiency. | Occasional delays in shipping. |
Overall, consumers value Snap-on’s durability and innovation, reinforcing its moat in professional tools. However, pricing and availability pose challenges that could impact customer loyalty if not addressed.
Risk Analysis
Below is a summary table outlining key risks associated with Snap-on Incorporated’s business and financial profile:
| Category | Description | Probability | Impact |
|---|---|---|---|
| Market Cyclicality | Demand for tools and equipment fluctuates with industrial and automotive cycles. | Medium | High |
| Valuation Risk | High price-to-book ratio suggests potential overvaluation risk amid changing market sentiment. | Medium | Medium |
| Liquidity Concerns | Current ratio unusually high at 4.79, indicating possible inefficient asset use or working capital management issues. | Low | Medium |
| Competitive Risk | Intense competition in manufacturing tools sector could pressure margins and market share. | Medium | Medium |
| Economic Slowdown | Global industrial slowdown may reduce capital spending by key customers, affecting revenue. | Medium | High |
| Financial Health | Strong Altman Z-Score (7.86) reduces bankruptcy risk, but Piotroski score of 6 signals room for improvement. | Low | Low |
The most pressing risks for Snap-on are cyclical demand fluctuations and economic slowdowns, which historically hit industrial tool makers hard. Despite strong financial health, valuation and working capital efficiency warrant caution. I remain attentive to shifts in industrial capital expenditure trends and competitive dynamics.
Should You Buy Snap-on Incorporated?
Snap-on appears to be a robust value creator with a slightly favorable moat supported by positive ROIC above WACC despite a declining trend. Its leverage profile seems manageable, and the overall A- rating suggests a very favorable financial health profile.
Strength & Efficiency Pillars
Snap-on Incorporated demonstrates operational excellence with a robust net margin of 19.72% and a return on equity of 17.14%. Its return on invested capital stands at 13.79%, comfortably exceeding the weighted average cost of capital at 7.05%. This gap confirms Snap-on as a clear value creator. The company’s efficient capital allocation and strong interest coverage ratio of 27.45 reinforce its ability to generate sustainable profits while managing debt prudently.
Weaknesses and Drawbacks
Despite solid fundamentals, Snap-on’s valuation metrics raise caution. Its price-to-book ratio at 3.08 is unfavorable, suggesting the stock trades at a premium relative to its book value. The current ratio of 4.79, flagged as unfavorable, might indicate excessive short-term assets that could signal inefficient capital use. While the debt-to-equity ratio is moderate at 0.22, investors should watch for potential liquidity imbalances amid mixed growth signals, including a 0.93% revenue growth over one year, which lags behind sector averages.
Our Final Verdict about Snap-on Incorporated
Snap-on’s long-term fundamentals appear sound, driven by consistent profitability and value creation. The overall bullish price trend, supported by buyer dominance at 68.03% in the recent period, enhances its appeal. However, the elevated price-to-book ratio and mixed short-term growth suggest a cautious stance. This profile might appear attractive for long-term exposure but could warrant a wait-and-see approach for a better entry point amid valuation concerns.
Disclaimer: This content is for informational purposes only and does not constitute financial, investment, or other professional advice. Investing in financial markets involves a significant risk of loss, and past performance is not indicative of future results.
Additional Resources
- Snap-On Incorporated Declares Quarterly Dividend of $2.44 (NYSE:SNA) – MarketBeat (Feb 13, 2026)
- Snap-on Incorporated Declares Quarterly Dividend – Franchising.com (Feb 13, 2026)
- Understanding Snap-On (SNA) Reliance on International Revenue – Yahoo Finance (Feb 13, 2026)
- Snap-on Incorporated Declares Quarterly Dividend – Business Wire (Feb 12, 2026)
- Prescott Group Capital Management L.L.C. Purchases 6,000 Shares of Snap-On Incorporated $SNA – MarketBeat (Feb 13, 2026)
For more information about Snap-on Incorporated, please visit the official website: snapon.com