Home > Analyses > Communication Services > Snap Inc.
Snap Inc. transforms how millions capture and share moments through its innovative camera technology. Its flagship app, Snapchat, revolutionizes visual communication with features like Stories and Spotlight. Snap also pioneers augmented reality advertising, blending creativity with commerce. Known for bold innovation and a strong user base, Snap reshapes social interaction globally. The critical question now: do Snap’s fundamentals support its current valuation and future growth in a fiercely competitive landscape?

Table of contents
Business Model & Company Overview
Snap Inc., founded in 2010 and headquartered in Santa Monica, CA, leads the Internet Content & Information sector with its innovative camera ecosystem. Its core offering, Snapchat, integrates visual communication tools like Camera, Snap Map, Stories, and Spotlight. Complementing this, Spectacles eyewear enhances user experience by capturing life from a human perspective. Together, these products form a cohesive platform focused on dynamic, short-form visual content.
Snap’s revenue engine balances hardware sales with a robust advertising platform, including AR ads and diverse Snap ad formats. Its strategic presence spans North America, Europe, and beyond, optimizing monetization across major markets. This blend of engaging consumer hardware and scalable ad tech underpins Snap’s solid competitive advantage, securing its role as a pioneer in visual communication’s future.
Financial Performance & Fundamental Metrics
I analyze Snap Inc.’s income statement, key financial ratios, and dividend payout policy to assess its core profitability and shareholder value creation.
Income Statement
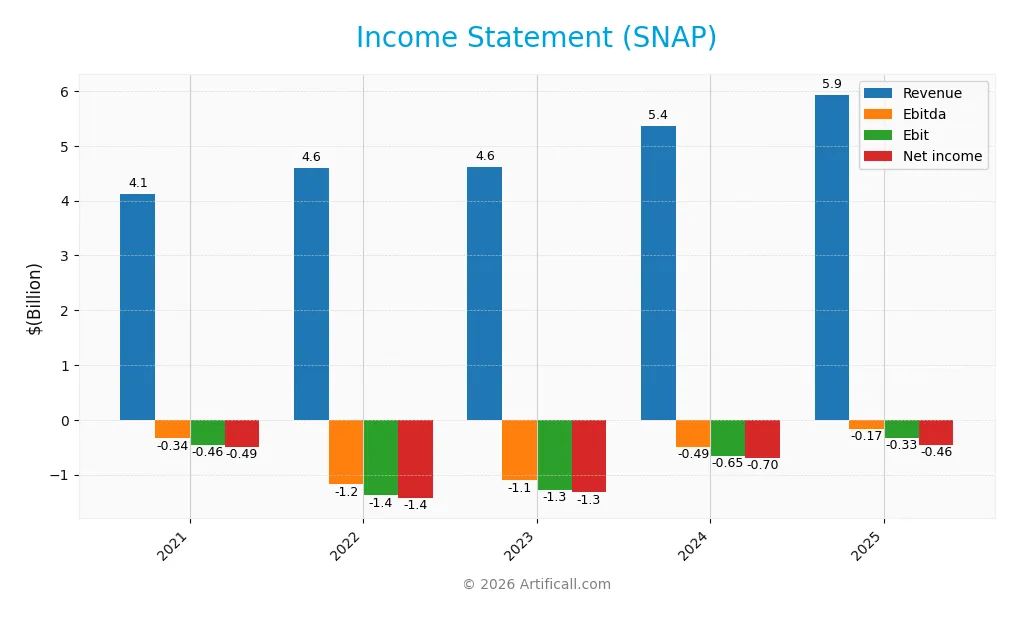
The table below presents Snap Inc.’s key income statement figures for fiscal years 2021 through 2025 in USD. It highlights revenue, expenses, profitability, and earnings per share trends.
| 2021 | 2022 | 2023 | 2024 | 2025 | |
|---|---|---|---|---|---|
| Revenue | 4.12B | 4.60B | 4.61B | 5.36B | 5.93B |
| Cost of Revenue | 1.75B | 1.82B | 2.11B | 2.47B | 2.67B |
| Operating Expenses | 3.07B | 4.18B | 3.89B | 3.67B | 3.79B |
| Gross Profit | 2.37B | 2.79B | 2.49B | 2.89B | 3.26B |
| EBITDA | -338M | -1.18B | -1.10B | -493M | -169M |
| EBIT | -457M | -1.38B | -1.27B | -651M | -329M |
| Interest Expense | 18M | 21M | 22M | 22M | 89M |
| Net Income | -488M | -1.43B | -1.32B | -698M | -460M |
| EPS | -0.31 | -0.89 | -0.82 | -0.42 | -0.28 |
| Filing Date | 2022-02-04 | 2023-02-01 | 2024-02-07 | 2025-02-05 | 2026-02-05 |
Income Statement Evolution
Snap Inc.’s revenue grew steadily from $4.1B in 2021 to $5.9B in 2025, a 44% increase over five years. Gross margin improved to 54.97%, reflecting efficient cost management. Despite revenue growth, net income remained negative, though losses narrowed, improving net margin from -34.7% in 2021 to -7.76% in 2025.
Is the Income Statement Favorable?
In 2025, Snap posted $5.9B revenue with a gross profit of $3.3B, showing solid top-line strength and margin control. Operating expenses rose proportionally, but EBIT loss shrank by nearly 50%, signaling improved operational leverage. Interest expense remained low at 1.5% of revenue. Overall, fundamentals appear favorable, driven by margin expansion and profitability trends.
Financial Ratios
The following table summarizes key financial ratios for Snap Inc. over the last five fiscal years, providing insight into profitability, liquidity, leverage, and valuation metrics:
| Ratios | 2021 | 2022 | 2023 | 2024 | 2025 |
|---|---|---|---|---|---|
| Net Margin | -11.85% | -31.07% | -28.71% | -13.02% | -7.76% |
| ROE | -12.87% | -55.40% | -54.78% | -28.48% | -20.18% |
| ROIC | -10.42% | -20.34% | -20.32% | -11.66% | -8.03% |
| P/E | -150.26 | -10.07 | -20.64 | -25.61 | -29.70 |
| P/B | 19.34 | 5.58 | 11.31 | 7.29 | 5.99 |
| Current Ratio | 5.70 | 4.32 | 4.39 | 3.95 | 3.56 |
| Quick Ratio | 5.70 | 4.32 | 4.39 | 3.95 | 3.56 |
| D/E | 0.69 | 1.62 | 1.80 | 1.73 | 0.29 |
| Debt-to-Assets | 35% | 52% | 55% | 53% | 9% |
| Interest Coverage | -39.72 | -65.02 | -63.49 | -36.53 | 4.36 |
| Asset Turnover | 0.55 | 0.57 | 0.58 | 0.68 | 0.77 |
| Fixed Asset Turnover | 7.84 | 7.16 | 4.97 | 5.26 | 5.47 |
| Dividend Yield | 0% | 0% | 0% | 0% | 0% |
Evolution of Financial Ratios
Snap Inc.’s Return on Equity (ROE) declined significantly, reaching -20.18% in 2025, signaling worsening profitability. The Current Ratio decreased from 5.70 in 2021 to 3.56 in 2025, indicating reduced liquidity but still above 1. Debt-to-Equity Ratio improved markedly, falling from 0.69 in 2021 to 0.29 in 2025, reflecting lowered leverage and stronger balance sheet discipline.
Are the Financial Ratios Fovorable?
In 2025, Snap shows unfavorable profitability metrics: negative net margin (-7.76%) and ROE (-20.18%), indicating losses despite a favorable Weighted Average Cost of Capital (7.92%). Liquidity is mixed, with a high current ratio (3.56, unfavorable) but a favorable quick ratio. Leverage metrics, including debt-to-equity (0.29) and debt-to-assets (8.51%), are favorable. Asset turnover is neutral, while valuation ratios present mixed signals. Overall, the ratios lean slightly unfavorable.
Shareholder Return Policy
Snap Inc. does not pay dividends, reflecting its ongoing net losses and focus on reinvestment. The company prioritizes growth and innovation over direct shareholder payouts, aligning with its high-expense, high-growth profile. Share buybacks are not reported.
This retention strategy supports long-term value creation by funding product development and market expansion. However, absence of dividends and buybacks may concern income-focused investors seeking immediate returns. The policy remains consistent with Snap’s current financial and strategic position.
Score analysis
The following radar chart illustrates Snap Inc.’s key financial scores across valuation, profitability, and leverage metrics:
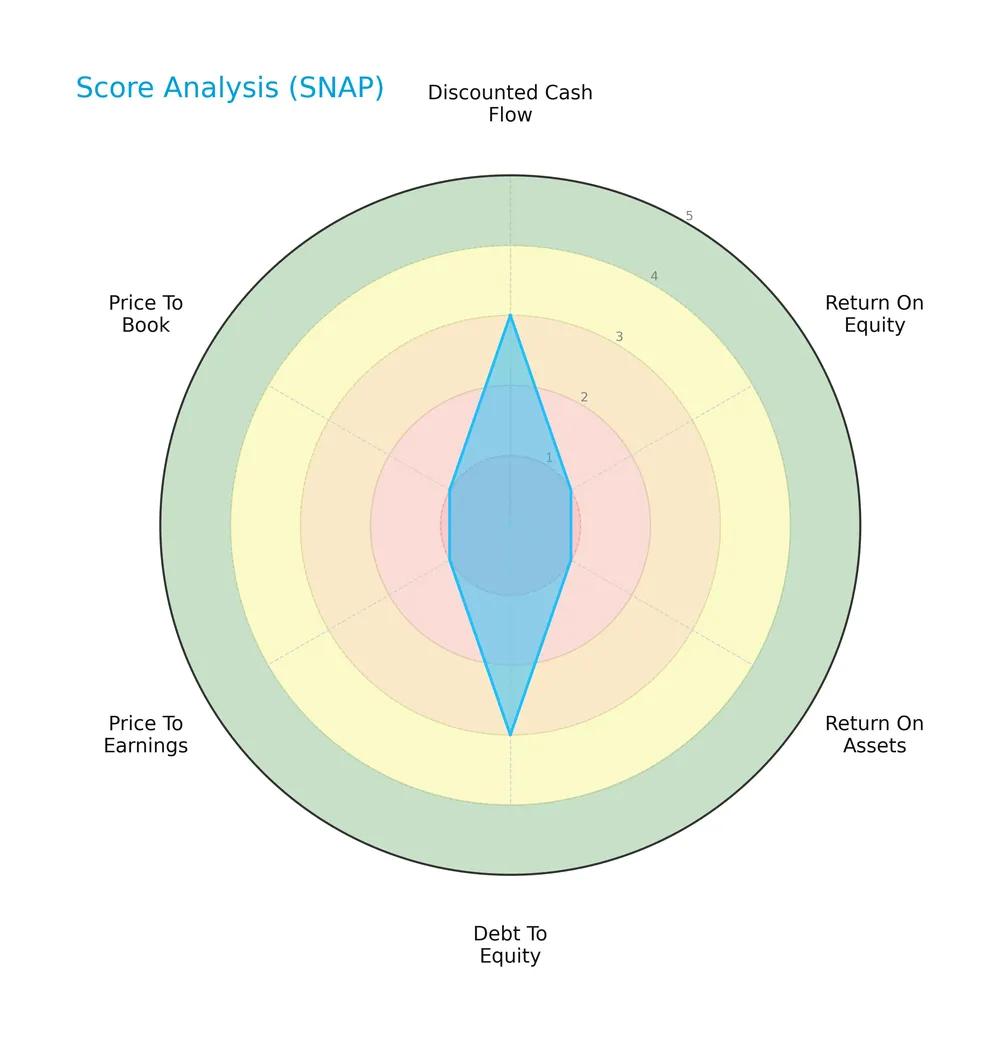
Snap’s discounted cash flow and debt-to-equity scores are moderate at 3 each, indicating some balance in capital structure and valuation. However, profitability and valuation multiples show significant weakness, with return on equity, return on assets, price-to-earnings, and price-to-book scores all at 1, signaling underperformance compared to peers.
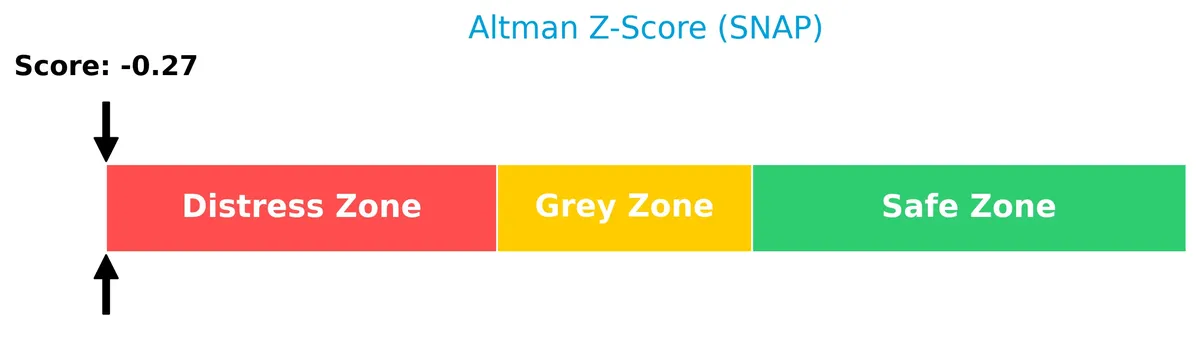
Analysis of the company’s bankruptcy risk
Snap Inc. currently resides in the distress zone based on its Altman Z-Score, indicating a high risk of financial distress and potential bankruptcy:
Is the company in good financial health?
The Piotroski Score diagram below reflects Snap Inc.’s financial health based on nine key criteria:
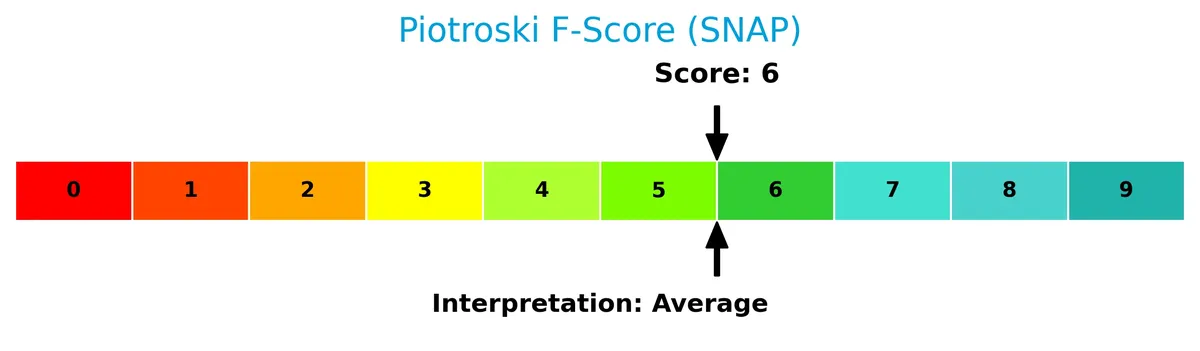
With a Piotroski Score of 6, Snap shows average financial strength. This suggests moderate stability but also highlights areas needing improvement to reach a strong or very strong health status.
Competitive Landscape & Sector Positioning
This sector analysis will examine Snap Inc.’s strategic positioning, revenue streams, key products, and main competitors. I will evaluate whether Snap holds a competitive advantage within its market segment.
Strategic Positioning
Snap Inc. concentrates revenue generation on advertising, with $5.19B in 2025, supported by a smaller $745M in other revenue. Geographically, it relies heavily on North America ($3.47B), while Europe ($1.09B) and Rest of World ($1.37B) contribute less, indicating moderate international diversification.
Revenue by Segment
This pie chart illustrates Snap Inc.’s revenue distribution by segment for fiscal year 2025, highlighting the contribution of advertising and other revenue streams.
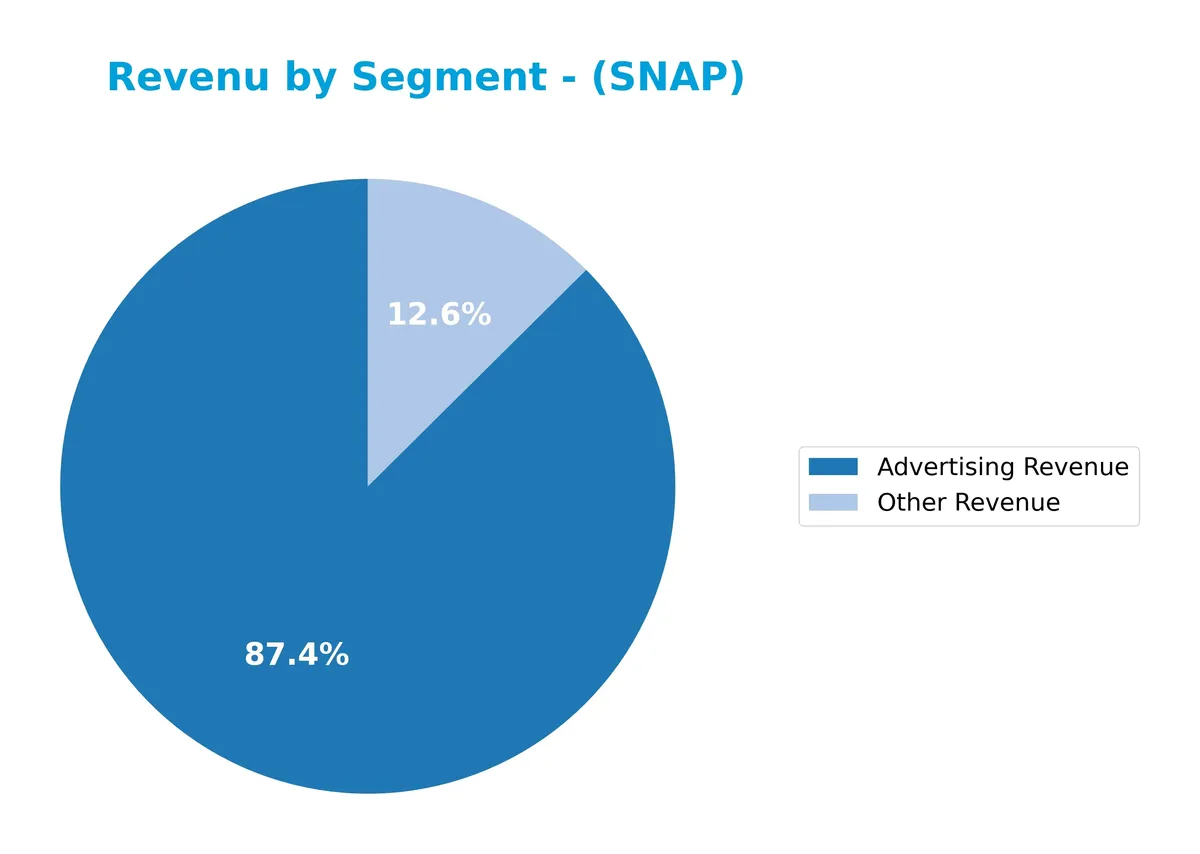
In 2025, Snap’s business remains heavily driven by Advertising Revenue, which totaled 5.2B, dominating overall sales. Other Revenue, at 745M, shows a smaller but meaningful contribution, reflecting some diversification. Compared to 2024’s aggregated segment reporting, the 2025 breakdown reveals a clear concentration risk in advertising, though slight growth in other streams may signal early attempts to broaden the revenue base.
Key Products & Brands
Snap Inc.’s core offerings and revenue drivers include the following key products and advertising formats:
| Product | Description |
|---|---|
| Snapchat | Camera application featuring Camera, Communication, Snap Map, Stories, and Spotlight for visual messaging. |
| Spectacles | Eyewear product syncing with Snapchat to capture photos and videos from a human perspective. |
| Advertising Products | Includes AR ads, Snap ads (single image/video), story ads, collection ads, dynamic ads, and commercials. |
Snap Inc. generates most revenue from advertising formats integrated within Snapchat’s platform. Spectacles complement the user experience by enabling unique content capture. The company’s product ecosystem centers on visual communication and immersive ad solutions.
Main Competitors
There are 6 main competitors in the sector, with the table below listing the top 6 leaders by market capitalization:
| Competitor | Market Cap. |
|---|---|
| Alphabet Inc. | 3.8T |
| Meta Platforms, Inc. | 1.6T |
| DoorDash, Inc. | 95B |
| Baidu, Inc. | 44B |
| Twilio Inc. | 22B |
| Snap Inc. | 14B |
Snap Inc. ranks 6th among its competitors, with a market cap at just 0.23% of the sector leader Alphabet Inc. It falls below both the average market cap of the top 10 competitors (936B) and the median market cap in the sector (70B). The company is 152% smaller than its nearest competitor, Twilio, highlighting a significant gap in scale.
Comparisons with competitors
Check out how we compare the company to its competitors:
Does Snap Inc. have a competitive advantage?
Snap Inc. currently lacks a strong competitive advantage, as its ROIC falls significantly below its WACC, indicating value destruction despite improving profitability. This slightly unfavorable moat suggests the company struggles to generate returns exceeding its cost of capital.
Looking ahead, Snap’s expanding product suite—including Snapchat’s visual communication tools and AR advertising formats—alongside geographic revenue growth, offers potential to strengthen its market position. Continued innovation and international expansion may improve its competitive stance over time.
SWOT Analysis
This SWOT analysis highlights Snap Inc.’s key internal and external factors affecting its strategic position in 2026.
Strengths
- strong revenue growth of 44% over 5 years
- solid gross margin near 55%
- growing profitability trend with improving EBIT
Weaknesses
- negative net margin at -7.76%
- ROIC below WACC indicating value destruction
- vulnerability to high valuation multiples (PB near 6)
Opportunities
- expanding international revenue, especially in Europe
- growing AR advertising market
- innovation in camera and social media features
Threats
- intense competition from larger social platforms
- regulatory risks on data privacy
- market volatility affecting ad spend
Snap Inc. shows promising growth and innovation but faces profitability challenges and valuation risks. The company must leverage its expanding global footprint and product innovations to overcome competitive and regulatory pressures.
Stock Price Action Analysis
The weekly chart below displays Snap Inc.’s stock price movements over the last 12 months, highlighting key highs and lows:
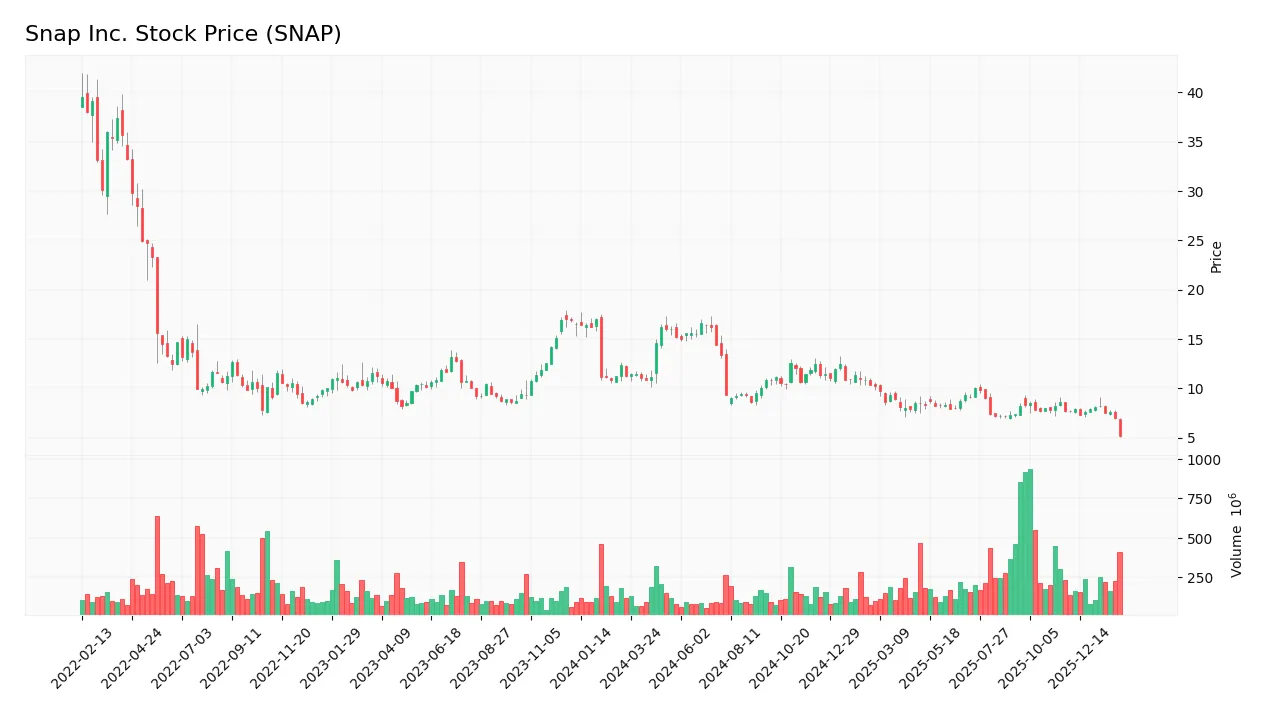
Trend Analysis
Over the past 12 months, Snap Inc.’s stock price declined by 54.24%, indicating a bearish trend with deceleration. The price fell from a high of 16.61 to a low of 5.12. Volatility remains notable, with a standard deviation of 2.64, confirming sustained downward pressure.
Volume Analysis
Trading volume has increased overall, with buyers accounting for 53.7% of activity historically. However, in the recent three months, seller volume dominates at 58%, showing a slightly seller-driven market. This shift suggests cautious or bearish investor sentiment in the near term.
Target Prices
Analysts present a cautious but optimistic consensus on Snap Inc.’s price outlook.
| Target Low | Target High | Consensus |
|---|---|---|
| 5.5 | 9.5 | 7.69 |
The target range reflects moderate upside potential with some downside risk, indicating mixed but generally positive sentiment among analysts.

Don’t Let Luck Decide Your Entry Point
Optimize your entry points with our advanced ProRealTime indicators. You’ll get efficient buy signals with precise price targets for maximum performance. Start outperforming now!
Analyst & Consumer Opinions
This section examines recent analyst ratings and consumer feedback to gauge Snap Inc.’s market perception and user sentiment.
Stock Grades
The following table summarizes the latest stock grades for Snap Inc. from recognized financial institutions as of early 2026:
| Grading Company | Action | New Grade | Date |
|---|---|---|---|
| B. Riley Securities | Upgrade | Buy | 2026-02-05 |
| Cantor Fitzgerald | Maintain | Neutral | 2026-02-05 |
| Evercore ISI Group | Maintain | In Line | 2026-02-05 |
| JP Morgan | Maintain | Underweight | 2026-02-05 |
| TD Cowen | Maintain | Hold | 2026-02-05 |
| Rosenblatt | Maintain | Neutral | 2026-02-05 |
| Susquehanna | Maintain | Neutral | 2026-02-05 |
| Mizuho | Maintain | Neutral | 2026-02-05 |
| Piper Sandler | Maintain | Neutral | 2026-02-05 |
| Wells Fargo | Maintain | Equal Weight | 2026-02-05 |
Most analysts maintain a cautious stance on Snap, with many holding neutral or hold ratings. Notably, only B. Riley Securities upgraded to a buy, while JP Morgan remains bearish with an underweight call, reflecting mixed market sentiment.
Consumer Opinions
Consumers express mixed feelings toward Snap Inc.’s platform, reflecting both enthusiasm and frustration.
| Positive Reviews | Negative Reviews |
|---|---|
| Intuitive user interface enhances engagement | Frequent app crashes disrupt user experience |
| Innovative AR features keep the app fresh | Privacy concerns over data handling |
| Strong community vibe encourages interaction | Algorithm changes reduce content relevance |
Overall, users praise Snap Inc. for its creativity and community focus. However, technical glitches and privacy issues consistently undermine satisfaction. Addressing these weaknesses is crucial for sustained user loyalty.
Risk Analysis
Below is a summary of key risks facing Snap Inc., with probability and impact assessments:
| Category | Description | Probability | Impact |
|---|---|---|---|
| Financial Health | Negative net margin (-7.76%) and ROE (-20.18%) indicate ongoing losses. | High | High |
| Bankruptcy Risk | Altman Z-Score in distress zone (-0.27) signals possible financial distress. | Moderate | High |
| Valuation | Unfavorable price-to-book (5.99) and price-to-earnings (negative) ratios. | High | Medium |
| Liquidity | Current ratio high (3.56), but interest coverage negative (-3.7), suggesting cash flow issues. | Moderate | Medium |
| Market Volatility | Stock price range wide (5.11-11.26) with 13% recent decline, reflecting investor uncertainty. | High | Medium |
| Competition | Intense pressure in Internet Content & Information sector with rapid innovation. | High | High |
The most pressing risk is Snap’s financial health. Negative profitability metrics paired with a distress-level Altman Z-Score raise bankruptcy concerns. Despite a strong current ratio, poor interest coverage highlights cash flow constraints. Market volatility and fierce sector competition add to uncertainty. Investors must weigh these risks carefully against Snap’s growth prospects.
Should You Buy Snap Inc.?
Snap Inc. appears to be shedding value despite improving profitability, suggesting a slightly unfavorable moat. Its leverage profile is manageable, yet financial distress indicators temper enthusiasm. Overall, the company’s profile could be seen as moderate with a C rating.
Strength & Efficiency Pillars
Snap Inc. displays mixed financial health with a gross margin of 54.97%, signaling solid core profitability. Its weighted average cost of capital (WACC) stands at a reasonable 7.92%, but return on invested capital (ROIC) is negative at -8.03%, indicating value destruction rather than creation. The Piotroski score of 6 reflects average financial strength, while the Altman Z-score of -0.27 places the company in the distress zone, raising red flags about bankruptcy risk. Despite profitability challenges, Snap’s low debt-to-equity ratio of 0.29 supports financial stability.
Weaknesses and Drawbacks
Snap faces significant hurdles, including a deeply negative net margin of -7.76% and return on equity (ROE) at -20.18%, both very unfavorable. The price-to-book ratio of 5.99 suggests an expensive valuation relative to its book value, while a current ratio of 3.56, surprisingly marked unfavorable, may imply inefficient asset use or liquidity concerns. Interest coverage is negative at -3.7, heightening risk in servicing debt. Recent market activity shows seller dominance at 57.93%, exerting downward pressure on the share price, which has declined over 54% overall.
Our Verdict about Snap Inc.
Snap’s long-term fundamental profile might appear unfavorable due to persistent losses and value destruction. The bearish overall market trend, combined with recent seller dominance, suggests caution. Despite some operational improvements and growing ROIC trends, the company’s financial distress and premium valuation warrant a wait-and-see approach for a better entry point. Investors should watch for clearer signs of sustained profitability before committing.
Disclaimer: This content is for informational purposes only and does not constitute financial, investment, or other professional advice. Investing in financial markets involves a significant risk of loss, and past performance is not indicative of future results.
Additional Resources
- Snap reports upbeat revenue as holiday season fuels ad sales – Reuters (Feb 04, 2026)
- Is Snap Stock A Value Play? – Forbes (Feb 03, 2026)
- Snap shares rise on fourth-quarter earnings that beat on sales – CNBC (Feb 04, 2026)
- Snap Earnings: What To Look For From SNAP – Yahoo Finance (Feb 03, 2026)
- Snap’s Snapback Moment Is Coming (NYSE:SNAP) – Seeking Alpha (Feb 04, 2026)
For more information about Snap Inc., please visit the official website: snap.com