Home > Analyses > Consumer Cyclical > Smurfit Westrock Plc
Smurfit Westrock Plc transforms everyday commerce by supplying the essential packaging that protects and presents products worldwide. As a dominant force in the packaging and containers industry, it leads with innovative paper-based solutions, from corrugated containers to consumer packaging boards. Renowned for quality and sustainability, Smurfit Westrock shapes supply chains across food, retail, and e-commerce sectors. The key question: Does its robust market position and innovation pipeline justify its current valuation and growth prospects?

Table of contents
Business Model & Company Overview
Smurfit Westrock Plc, founded in 1934 and headquartered in Dublin, Ireland, stands as a leading force in the packaging and containers industry. It operates a cohesive ecosystem, manufacturing and distributing containerboard, corrugated containers, and diverse paper-based packaging products globally. Its portfolio spans from consumer packaging board to graphic paper and packaging machinery, serving sectors like food and beverage, e-commerce, and retail with integrated solutions.
The company’s revenue engine balances sales of containerboard and converted paper products with recycled packaging, creating value across hardware and consumable goods. Smurfit Westrock commands a strategic presence in the Americas, Europe, and Asia, leveraging global scale and expertise. Its economic moat is anchored in its broad product range and established market footprint, positioning it as a key architect of packaging innovation worldwide.
Financial Performance & Fundamental Metrics
I will analyze Smurfit Westrock Plc’s income statement, key financial ratios, and dividend payout policy to reveal its operational efficiency and shareholder value approach.
Income Statement
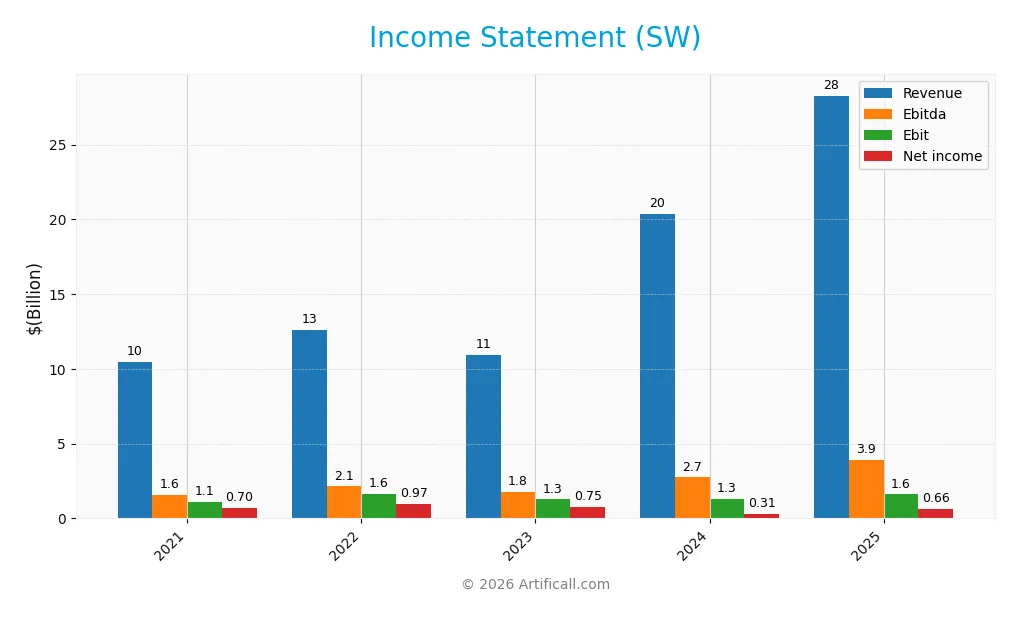
This table summarizes Smurfit Westrock Plc’s annual income statement figures for the fiscal years 2021 through 2025, reflecting reported currency in USD for the last two years and EUR previously.
| 2021 | 2022 | 2023 | 2024 | 2025 | |
|---|---|---|---|---|---|
| Revenue | 10.5B | 12.6B | 11.0B | 20.4B | 28.3B |
| Cost of Revenue | 8.1B | 9.6B | 8.2B | 16.3B | 22.8B |
| Operating Expenses | 1.2B | 1.6B | 1.5B | 3.1B | 3.9B |
| Gross Profit | 2.4B | 3.1B | 2.8B | 4.0B | 5.5B |
| EBITDA | 1.6B | 2.1B | 1.8B | 2.7B | 3.9B |
| EBIT | 1.1B | 1.6B | 1.3B | 1.3B | 1.6B |
| Interest Expense | 126M | 146M | 154M | 507M | 705M |
| Net Income | 705M | 966M | 747M | 308M | 660M |
| EPS | 3.12 | 3.85 | 3.25 | 0.8 | 1.25 |
| Filing Date | 2021-12-31 | 2022-12-31 | 2023-12-31 | 2025-03-07 | 2026-02-27 |
Income Statement Evolution
Smurfit Westrock Plc’s revenue surged 38.75% from 2024 to 2025, driven by a 35.55% gross profit increase. Despite this growth, net income declined overall by 6.38% over 2021-2025, reflecting margin pressures. Gross margin remained stable near 19.4%, while EBIT margin held steady around 5.7%, indicating consistent operational efficiency.
Is the Income Statement Favorable?
In 2025, fundamentals improved notably. Revenue and operating expenses both grew 38.75%, maintaining margin balance. Interest expense as a share of revenue dropped to 2.49%, a favorable shift lowering financial burden. Net margin increased 54.41%, and EPS rose 55.7%, signaling stronger profitability despite historical margin erosion. Overall, the income statement shows favorable momentum in 2025.
Financial Ratios
The table below presents key financial ratios for Smurfit Westrock Plc over the last five fiscal years, illustrating profitability, valuation, liquidity, leverage, efficiency, and dividend metrics:
| Ratios | 2021 | 2022 | 2023 | 2024 | 2025 |
|---|---|---|---|---|---|
| Net Margin | 6.7% | 7.7% | 6.8% | 1.5% | 2.3% |
| ROE | 16.1% | 19.4% | 12.1% | 1.8% | 4.2% |
| ROIC | 9.1% | 11.0% | 8.0% | 1.5% | 3.1% |
| P/E | 14.2 | 8.8 | 13.0 | 67.5 | 25.5 |
| P/B | 2.29 | 1.70 | 1.58 | 1.20 | 1.08 |
| Current Ratio | 1.44 | 1.48 | 1.52 | 1.37 | 1.48 |
| Quick Ratio | 1.07 | 1.07 | 1.12 | 0.89 | 1.03 |
| D/E | 0.86 | 0.75 | 0.67 | 0.78 | 0.75 |
| Debt-to-Assets | 32.1% | 30.0% | 29.4% | 31.1% | 26.0% |
| Interest Coverage | 8.8 | 9.9 | 8.0 | 1.9 | 2.3 |
| Asset Turnover | 0.90 | 1.01 | 0.78 | 0.47 | 0.63 |
| Fixed Asset Turnover | 2.23 | 2.53 | 1.78 | 0.90 | 1.43 |
| Dividend Yield | 3.6% | 4.1% | 4.0% | 3.1% | 4.6% |
Evolution of Financial Ratios
Return on Equity (ROE) declined from 19.4% in 2022 to 4.23% in 2025, signaling weakening profitability. The Current Ratio remained stable around 1.4 to 1.5, indicating consistent liquidity. Debt-to-Equity fluctuated mildly, settling near 0.75 in 2025, reflecting moderate leverage without significant deterioration.
Are the Financial Ratios Favorable?
Profitability ratios including net margin (2.33%) and ROE (4.23%) are unfavorable compared to sector norms. Liquidity is neutral to favorable with a Current Ratio of 1.48 and Quick Ratio above 1. Debt metrics show a favorable debt-to-assets ratio at 25.96%, but interest coverage at 2.27 is neutral. Market valuation ratios like P/E at 25.47 are unfavorable, while dividend yield at 4.56% remains favorable. Overall, ratios are slightly favorable.
Shareholder Return Policy
Smurfit Westrock Plc maintains a dividend payout ratio above 100% in 2025, with a 4.56% yield and a dividend per share of €1.50. The dividend is covered by free cash flow and capital expenditure, though the payout ratio suggests distribution risks if cash flow weakens.
The company also engages in share buybacks, but the high payout ratio warrants caution. Historically, the policy balances shareholder returns and reinvestment, yet sustaining this distribution level depends on stable cash flows and prudent capital allocation.
Score analysis
The following radar chart displays Smurfit Westrock Plc’s key financial scores for a comprehensive overview:
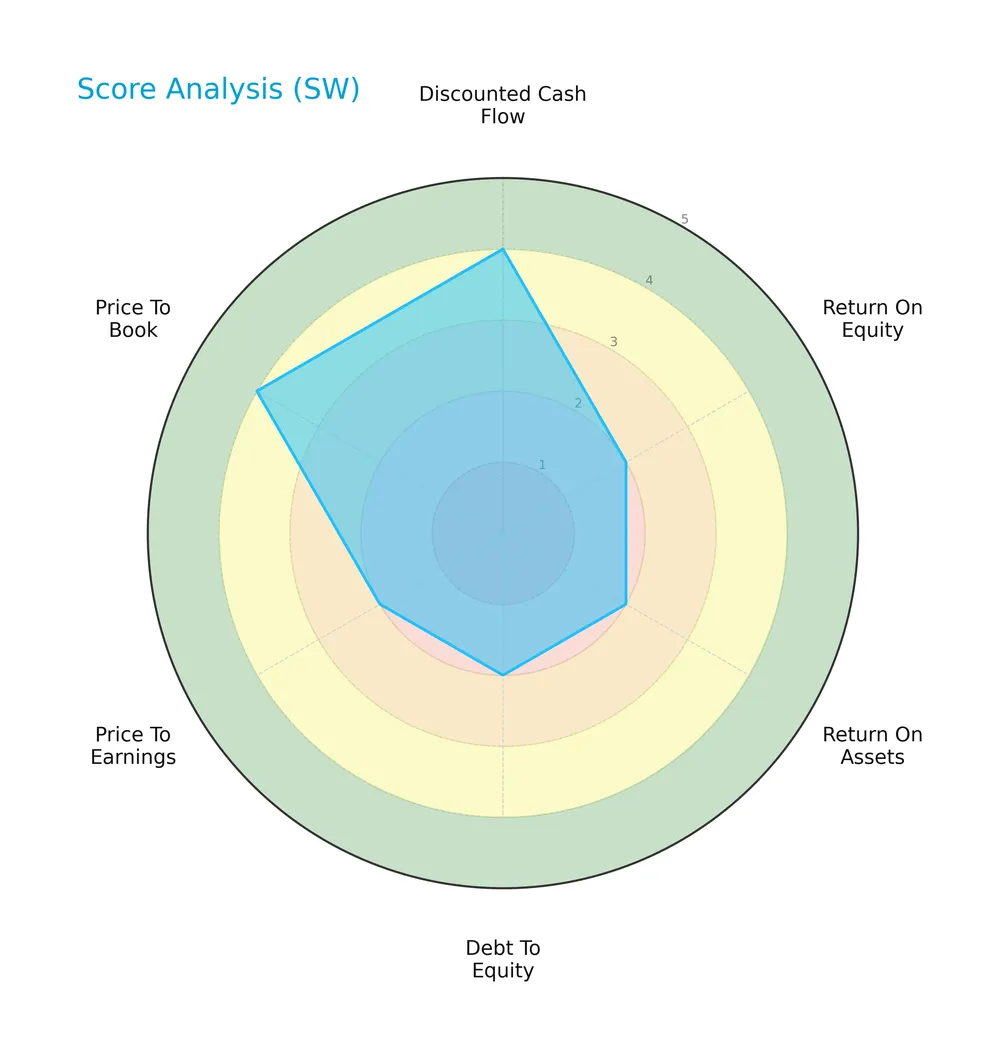
Smurfit Westrock shows a favorable discounted cash flow and price-to-book scores at 4 each. However, returns on equity and assets, debt to equity, and price-to-earnings scores remain unfavorable at 2, reflecting mixed operational efficiency and valuation metrics.
Analysis of the company’s bankruptcy risk
The Altman Z-Score places Smurfit Westrock Plc in the distress zone, indicating a significant risk of financial distress and potential bankruptcy:

Is the company in good financial health?
The Piotroski Score diagram summarizes Smurfit Westrock’s overall financial strength and stability:

With a Piotroski Score of 7, the company demonstrates strong financial health supported by solid profitability, leverage, and liquidity metrics, suggesting resilience despite some operational challenges.
Competitive Landscape & Sector Positioning
This analysis explores Smurfit Westrock Plc’s strategic positioning within the packaging and containers sector. It examines revenue by segment, key products, main competitors, and competitive advantages. I will assess whether Smurfit Westrock holds a sustainable competitive advantage over its rivals.
Strategic Positioning
Smurfit Westrock Plc focuses on a diversified product portfolio, with packaging generating €25.0B and paper €6.1B in 2025. Geographically, it balances exposure across the United States (€14.5B), Other Europe, MEA, APAC (€7.2B), and the Americas, reflecting broad international reach.
Revenue by Segment
This pie chart breaks down Smurfit Westrock Plc’s revenue by major product segments for fiscal year 2025, highlighting the relative contributions of Packaging and Paper.
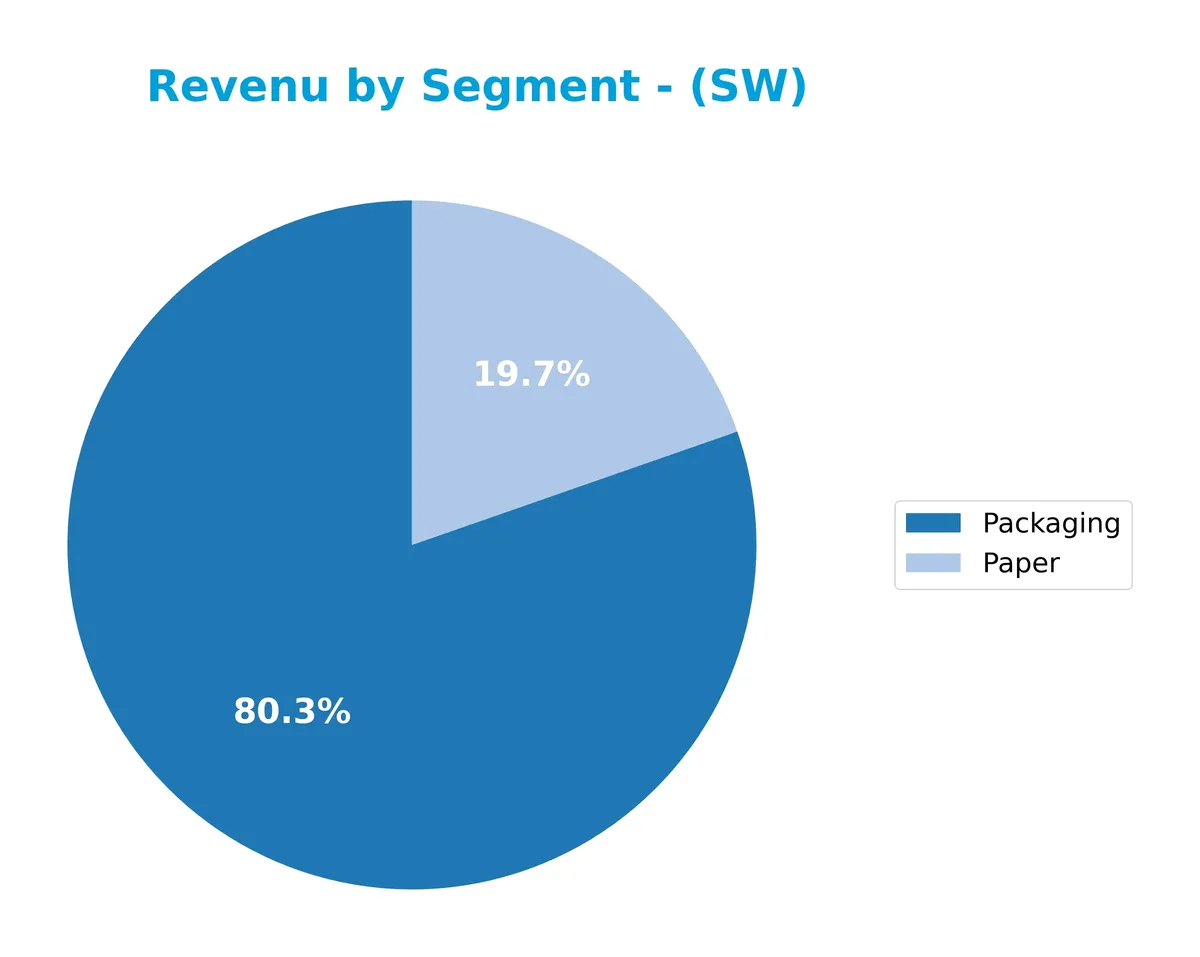
Smurfit Westrock’s revenue shows a clear dominance by the Packaging segment, which reached €25.0B in 2025, up significantly from €17.3B in 2024. Paper contributed €6.1B, also increasing from €3.9B. The growth in Packaging suggests strong market demand and operational leverage. The company’s focus remains concentrated in Packaging, presenting both a growth driver and a potential concentration risk if market conditions shift.
Key Products & Brands
Smurfit Westrock Plc offers a broad range of paper-based packaging and paper products, including containerboard and corrugated containers:
| Product | Description |
|---|---|
| Containerboard | Paperboard used to manufacture corrugated containers or sold to third parties. |
| Corrugated Containers | Packaging products made from containerboard, serving multiple industries such as food and e-commerce. |
| Consumer Packaging | Paper-based packaging solutions for consumer goods, including folding cartons and bag-in-box products. |
| Paperboard & Solid Board | Variety of paper grades including linerboard, corrugated medium, graphic board, and solid board packaging. |
| Sack Paper | Paper products designed for packaging bulk materials, often used in industrial and foodservice markets. |
| Graphic Paper | Paper used for printing and graphic applications. |
| Recycled Paper Packaging | Packaging products made from recycled paper, supporting sustainability initiatives. |
| Packaging Machinery | Equipment for producing and converting packaging products. |
Smurfit Westrock’s portfolio spans containerboard and diverse paper grades, supporting packaging needs across food, retail, and industrial sectors. Its scale and product diversity align with industry demands for sustainable and versatile packaging solutions.
Main Competitors
There are 5 competitors in total; below are the top 5 leaders by market capitalization:
| Competitor | Market Cap. |
|---|---|
| International Paper Company | 21.3B |
| Smurfit Westrock Plc | 20.7B |
| Amcor plc | 19.4B |
| Packaging Corporation of America | 19.0B |
| Ball Corporation | 14.3B |
Smurfit Westrock ranks 2nd among its competitors, with a market cap 15.5% below the leader. It stands above both the average market cap of the top 10 (19B) and the sector median (19.4B). The company holds a 13.4% gap to the nearest competitor above, underscoring its strong positioning in packaging and containers.
Comparisons with competitors
Check out how we compare the company to its competitors:
Does SW have a competitive advantage?
Smurfit Westrock Plc currently lacks a competitive advantage, as its ROIC is 3.75% below WACC and profitability is declining. This indicates value destruction rather than value creation.
The company’s future outlook includes expanding its diverse packaging product lines across global markets, especially the U.S. and Other Europe segments. Growth opportunities lie in increasing demand from food, beverage, and e-commerce sectors.
SWOT Analysis
This analysis highlights Smurfit Westrock Plc’s key strategic factors shaping its current position and future potential.
Strengths
- strong revenue growth
- diversified geographic presence
- favorable dividend yield
Weaknesses
- declining ROIC indicating value destruction
- low net margin
- Altman Z-score in distress zone
Opportunities
- expanding U.S. market penetration
- growth in e-commerce packaging demand
- potential operational efficiencies
Threats
- intense competition in packaging sector
- raw material price volatility
- macroeconomic uncertainties impacting industrial demand
Smurfit Westrock’s robust top-line growth and global footprint provide a solid base. However, declining profitability and financial distress signals demand strategic focus on operational efficiency and value creation.
Stock Price Action Analysis
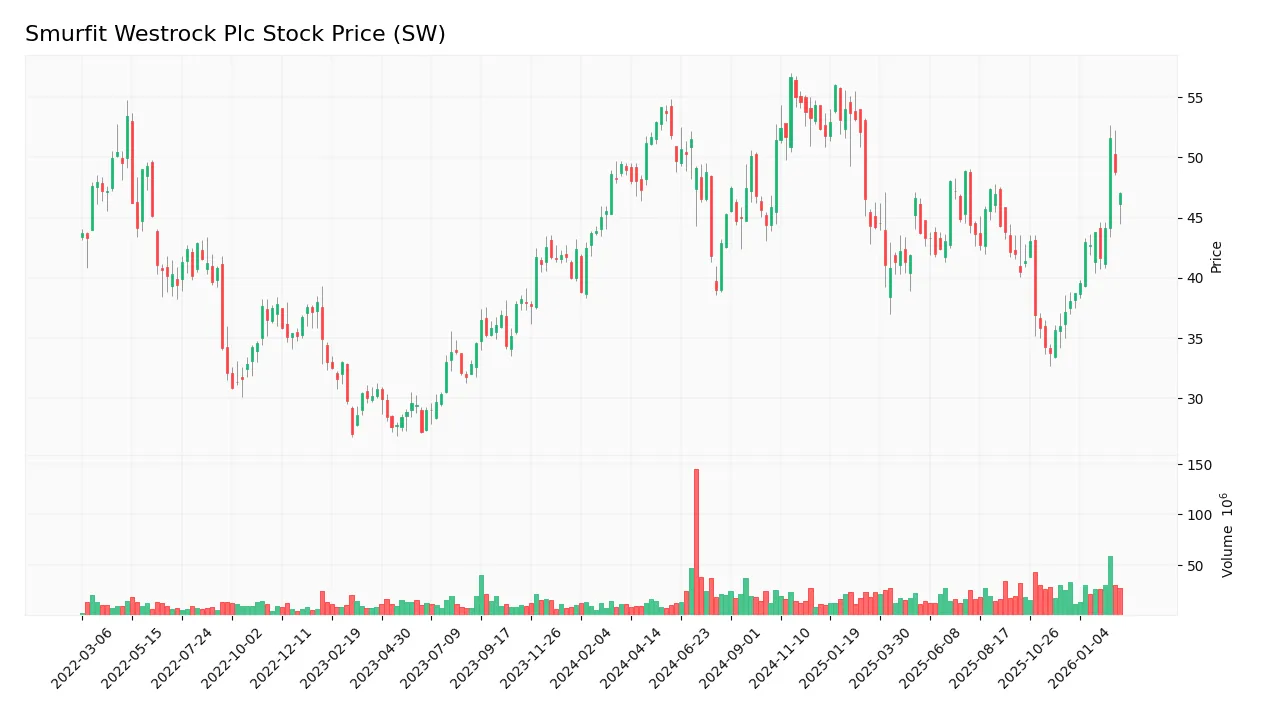
The weekly stock chart displays Smurfit Westrock Plc’s price movements over the past 12 months, highlighting key fluctuations and trend shifts:
Trend Analysis
Over the past 12 months, Smurfit Westrock Plc’s stock price declined by 3.87%, indicating a bearish trend. The price showed acceleration with a high volatility level, reflected by a 5.34 standard deviation. The highest price reached 56.64, while the lowest dropped to 33.78, underscoring significant swings.
Volume Analysis
In the last three months, trading volume has increased, with buyer activity dominating at 68.55%. The buyer-driven volume suggests growing investor interest and positive sentiment, potentially fueling recent price gains despite the broader bearish trend.
Target Prices
Analysts set a clear target consensus for Smurfit Westrock Plc, reflecting moderate upside potential.
| Target Low | Target High | Consensus |
|---|---|---|
| 45 | 61 | 55.33 |
The target range between 45 and 61 indicates cautious optimism, with the consensus price suggesting a 10-15% upside from current levels.

Don’t Let Luck Decide Your Entry Point
Optimize your entry points with our advanced ProRealTime indicators. You’ll get efficient buy signals with precise price targets for maximum performance. Start outperforming now!
Analyst & Consumer Opinions
This section examines analyst ratings and consumer feedback to assess Smurfit Westrock Plc’s market perception and reputation.
Stock Grades
The following table summarizes the latest verified analyst grades for Smurfit Westrock Plc from reputable firms:
| Grading Company | Action | New Grade | Date |
|---|---|---|---|
| Barclays | Maintain | Overweight | 2026-02-17 |
| Citigroup | Maintain | Buy | 2026-02-13 |
| RBC Capital | Maintain | Outperform | 2026-02-12 |
| Wells Fargo | Maintain | Overweight | 2026-02-12 |
| Citigroup | Maintain | Buy | 2026-01-06 |
| Truist Securities | Maintain | Buy | 2026-01-06 |
| Wells Fargo | Maintain | Overweight | 2026-01-06 |
| Argus Research | Maintain | Buy | 2025-12-09 |
| Barclays | Maintain | Overweight | 2025-11-10 |
| Truist Securities | Maintain | Buy | 2025-10-30 |
The consensus across these ten ratings is uniformly positive, with no downgrades or sell recommendations. Analysts consistently maintain “Buy” or “Overweight” stances, reflecting steady confidence in the stock’s outlook.
Consumer Opinions
Consumer sentiment around Smurfit Westrock Plc reflects a mix of appreciation and concern, illustrating the company’s complex market position.
| Positive Reviews | Negative Reviews |
|---|---|
| “Reliable delivery times and consistent product quality.” | “Customer service response times are slow.” |
| “Competitive pricing compared to industry peers.” | “Packaging options lack innovation.” |
| “Strong sustainability commitments resonate well.” | “Occasional delays in order fulfillment.” |
Overall, consumers praise Smurfit Westrock’s reliability and eco-friendly initiatives. However, repeated complaints about service speed and limited product innovation suggest areas needing urgent improvement.
Risk Analysis
The following table summarizes key risks for Smurfit Westrock Plc, highlighting their likelihood and potential impact:
| Category | Description | Probability | Impact |
|---|---|---|---|
| Financial Health | Altman Z-score in distress zone signals bankruptcy risk. | High | High |
| Profitability | Low net margin (2.33%) and ROE (4.23%) hinder growth. | Medium | Medium |
| Valuation | Elevated P/E ratio (25.47) suggests overvaluation risk. | Medium | Medium |
| Leverage | Moderate debt-to-equity ratio (0.75) may constrain agility. | Medium | Medium |
| Market Volatility | Beta near 1 implies stock moves with market swings. | High | Medium |
Smurfit Westrock’s Altman Z-score at 1.40 places it in the distress zone, a red flag for financial stability. The company’s profitability metrics remain weak, limiting internal capital generation. However, a strong Piotroski score of 7 reveals solid operational fundamentals. Investors should weigh bankruptcy risk carefully against stable cash flow signs.
Should You Buy Smurfit Westrock Plc?
Smurfit Westrock Plc appears to be in financial distress with a very unfavorable moat, reflecting declining profitability and value destruction. Despite manageable leverage and a strong Piotroski score, its overall rating of B suggests moderate operational efficiency and value creation potential.
Strength & Efficiency Pillars
Smurfit Westrock Plc shows operational resilience with a favorable interest expense ratio of 2.49%, reflecting controlled financing costs. The company benefits from robust revenue growth of 38.75% over one year and a strong gross profit increase of 35.55%. Despite these positives, profitability metrics underperform, with a net margin of 2.33%, ROE at 4.23%, and ROIC at 3.08%, all marked unfavorable. ROIC (3.08%) falls below WACC (6.83%), indicating the company is not a value creator at present.
Weaknesses and Drawbacks
Smurfit Westrock Plc is in financial distress, evidenced by an Altman Z-Score of 1.40, placing it firmly in the Distress Zone and signaling a heightened bankruptcy risk. Profitability is weak with an unfavorable net margin and ROE. The P/E ratio of 25.47 indicates a premium valuation relative to earnings, adding pressure amid uncertain fundamentals. Debt-to-equity at 0.75 is neutral but coupled with a modest current ratio of 1.48, liquidity concerns persist. Market sentiment is bearish overall, with seller volume exceeding buyers at 55.07%, creating short-term headwinds.
Our Final Verdict about Smurfit Westrock Plc
Despite operational strengths like revenue growth and controlled interest expense, Smurfit Westrock’s solvency risk with an Altman Z-Score of 1.40 makes its investment profile highly speculative. The company’s inability to generate returns above its cost of capital compounds concerns. Investors might view Smurfit Westrock as too risky for conservative capital allocation until financial health stabilizes.
Disclaimer: This content is for informational purposes only and does not constitute financial, investment, or other professional advice. Investing in financial markets involves a significant risk of loss, and past performance is not indicative of future results.
Additional Resources
- Decoding Smurfit WestRock PLC (SW): A Strategic SWOT Insight – GuruFocus (Feb 28, 2026)
- Smurfit Westrock PLC $SW Shares Sold by Raiffeisen Bank International AG – MarketBeat (Feb 22, 2026)
- S&P 500 Futures Drop in Premarket Trading; International Paper, Smurfit Westrock Lag – Barron’s (Feb 23, 2026)
- Does Smurfit Westrock (SW) Closing Quebec Capacity Reveal a Deeper Shift in Portfolio Strategy? – simplywall.st (Feb 23, 2026)
- Smurfit Westrock plc (SW) Announces Board Changes Ahead of 2026 Annual Meeting – GuruFocus (Feb 27, 2026)
For more information about Smurfit Westrock Plc, please visit the official website: smurfitwestrock.com