Home > Analyses > Consumer Defensive > Smithfield Foods, Inc.
Smithfield Foods, Inc. transforms everyday meals with its diverse range of packaged meats and fresh pork products. Its brands, including Smithfield and Nathan’s Famous, set industry standards in quality and innovation. As a dominant player in agricultural farm products, Smithfield influences both domestic and global food supply chains. The key question now is whether its robust market presence and operational scale continue to support attractive investment returns in a changing consumer landscape.
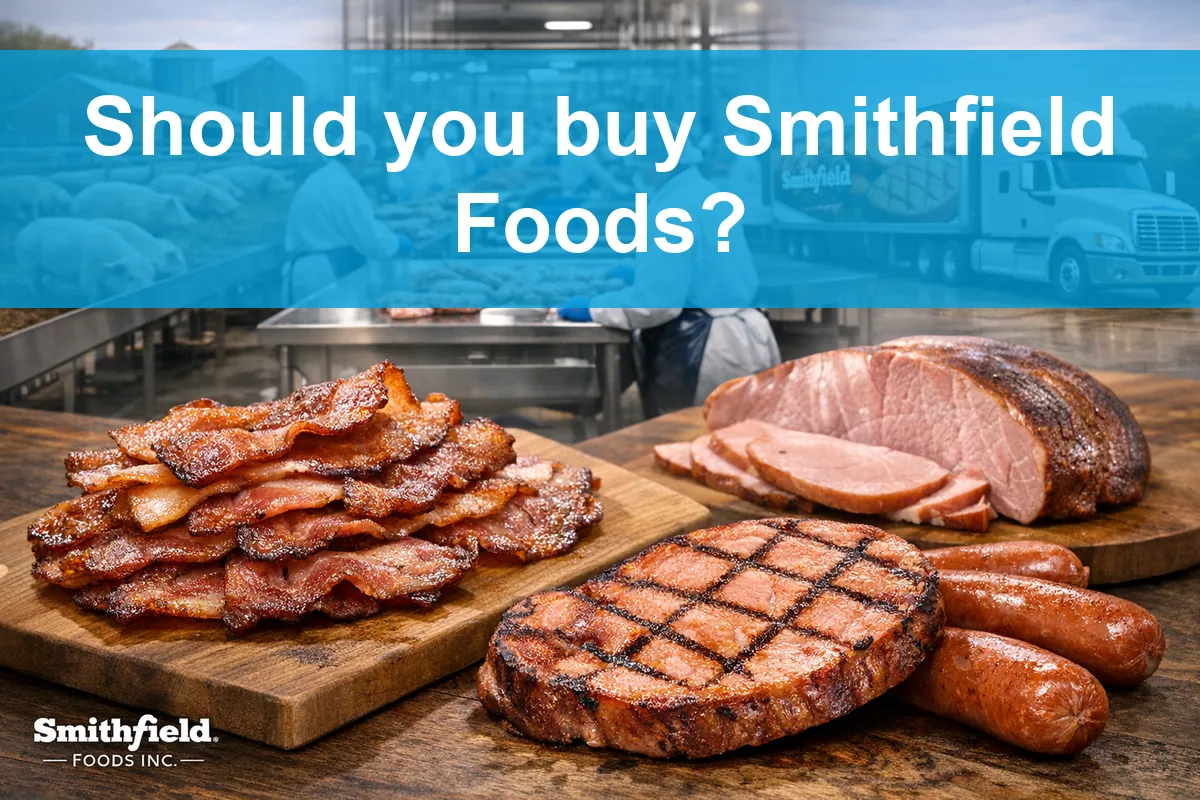
Table of contents
Business Model & Company Overview
Smithfield Foods, Inc. stands as a leading force in the Agricultural Farm Products industry. Founded in 1936 and headquartered in Smithfield, Virginia, it operates a vast ecosystem spanning packaged meats, fresh pork, and bioscience products. Its portfolio includes iconic brands like Smithfield, Nathan’s Famous, and Eckrich, delivering a cohesive range of consumer and industrial offerings. The company harnesses a robust supply chain from hog production to processed meats, integrating diverse operations under one strategic umbrella.
Smithfield’s revenue engine balances packaged meat sales with fresh pork and hog production, creating multiple value streams. It serves retail, foodservice, and industrial customers across the Americas, Europe, and Asia, including key export markets such as China and Japan. This geographic reach complements its vertical integration, securing stable input costs and high-quality output. Smithfield’s economic moat lies in its scale and integrated supply chain, positioning it to shape the future of global protein supply.
Financial Performance & Fundamental Metrics
I analyze Smithfield Foods, Inc.’s income statement, key financial ratios, and dividend payout policy to assess its profitability, efficiency, and shareholder returns.
Income Statement
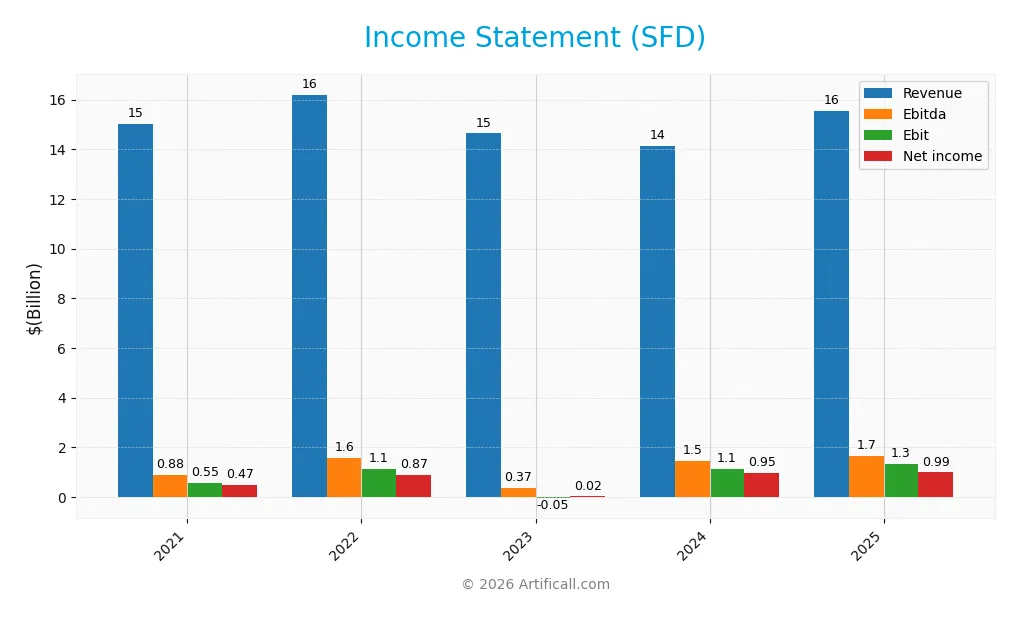
The table below summarizes Smithfield Foods, Inc.’s key income statement metrics for fiscal years 2021 through 2025, reflecting revenue, expenses, and profitability trends.
| 2021 | 2022 | 2023 | 2024 | 2025 | |
|---|---|---|---|---|---|
| Revenue | 15.0B | 16.2B | 14.6B | 14.1B | 15.5B |
| Cost of Revenue | 13.4B | 14.7B | 13.8B | 12.2B | 13.2B |
| Operating Expenses | 1.05B | 378M | 945M | 780M | 977M |
| Gross Profit | 1.57B | 1.50B | 889M | 1.90B | 2.35B |
| EBITDA | 882M | 1.57B | 374M | 1.47B | 1.66B |
| EBIT | 551M | 1.13B | -53M | 1.13B | 1.33B |
| Interest Expense | 93M | 87M | 76M | 66M | 41M |
| Net Income | 472M | 870M | 17M | 953M | 987M |
| EPS | 1.20 | 2.21 | 0.04 | 2.42 | 2.51 |
| Filing Date | 2021-12-31 | 2022-12-31 | 2023-12-31 | 2025-03-25 | 2026-03-24 |
Income Statement Evolution
From 2021 to 2025, Smithfield Foods’ revenue shows a moderate overall growth of 3.5% annually, with a stronger 9.8% increase in the last year. Net income more than doubled over the period, reflecting a 109% growth. Gross margin remained stable around 15%, while EBIT margin held steady near 8.5%, indicating consistent operational efficiency despite rising expenses.
Is the Income Statement Favorable?
In 2025, fundamentals appear generally favorable. Revenue rose 9.8%, gross profit surged 24%, and EBIT increased 17.6%, signaling solid top-line and operating performance. Net margin slightly declined by 5.7% last year but remains healthy at 6.4%. Interest expenses are low at 0.26% of revenue, supporting profitability. Overall, the income statement reflects robust growth and margin stability despite some expense pressures.
Financial Ratios
Key financial ratios for Smithfield Foods, Inc. over the last five fiscal years are presented below:
| Ratios | 2021 | 2022 | 2023 | 2024 | 2025 |
|---|---|---|---|---|---|
| Net Margin | 3.1% | 5.4% | 0.1% | 6.7% | 6.4% |
| ROE | 0% | 11.8% | 0.2% | 16.3% | 14.5% |
| ROIC | 0% | 7.7% | -0.4% | 8.9% | 10.2% |
| P/E | 17.1 | 9.8 | 474.0 | 10.0 | 9.0 |
| P/B | 0 | 1.15 | 1.11 | 1.63 | 1.30 |
| Current Ratio | 0 | 2.14 | 2.01 | 2.46 | 2.97 |
| Quick Ratio | 0 | 1.01 | 0.97 | 1.05 | 1.63 |
| D/E | 0 | 0.33 | 0.34 | 0.40 | 0.35 |
| Debt-to-Assets | 0% | 18% | 18% | 21% | 20% |
| Interest Coverage | 5.6 | 12.8 | -0.7 | 16.9 | 33.6 |
| Asset Turnover | 0 | 1.17 | 1.10 | 1.28 | 1.28 |
| Fixed Asset Turnover | 0 | 4.28 | 3.93 | 4.03 | 4.30 |
| Dividend Yield | 2.4% | 5.8% | 4.0% | 3.0% | 4.5% |
Evolution of Financial Ratios
Return on Equity (ROE) showed marked improvement from near zero in 2023 to 14.5% in 2025, indicating stronger profitability. The Current Ratio steadily increased from 2.01 in 2023 to 2.97 in 2025, reflecting improved liquidity. Debt-to-Equity Ratio remained stable around 0.35, signaling consistent leverage management over the period.
Are the Financial Ratios Fovorable?
2025 ratios reveal generally favorable conditions. ROIC at 10.2% exceeds WACC at 4.6%, confirming efficient capital use. Liquidity is strong with a Current Ratio of 2.97 and Quick Ratio of 1.63. Leverage is conservative, with Debt-to-Equity at 0.35 and Debt-to-Assets at 19.7%. Market multiples, including P/E of 8.98 and P/B of 1.3, are attractive. Dividend yield at 4.47% adds income appeal. Overall, 85.7% of ratios are favorable, supporting a very positive financial profile.
Shareholder Return Policy
Smithfield Foods maintains a dividend payout ratio around 30-40%, with a dividend yield near 4.5% in 2025. Dividends are regularly supported by free cash flow and capital expenditure coverage ratios above 1.4, indicating prudent cash allocation.
The company also engages in share buybacks, complementing its distribution strategy. This balanced approach supports sustainable long-term shareholder value by aligning cash returns with operational cash generation and capital needs.
Score analysis
The radar chart below illustrates Smithfield Foods, Inc.’s key valuation and financial performance scores:
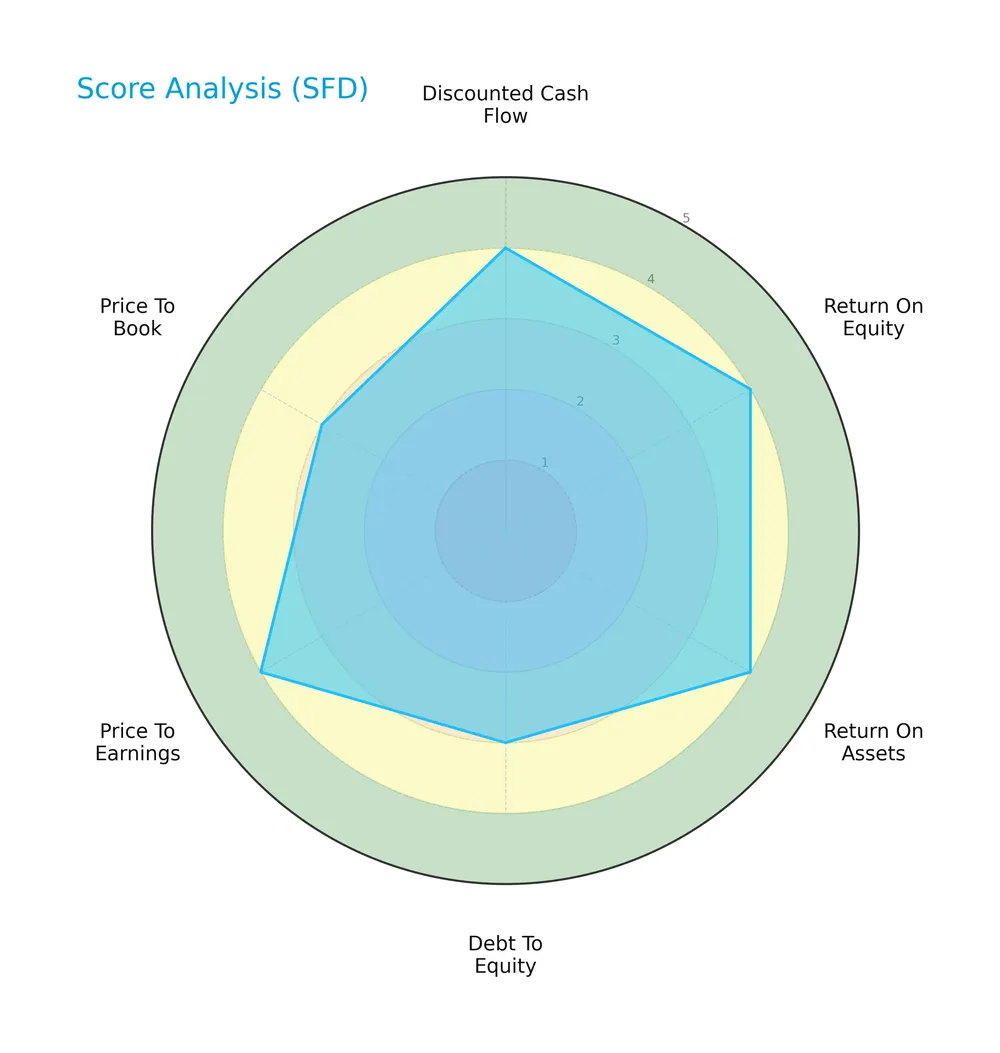
Smithfield Foods scores favorably on discounted cash flow, ROE, ROA, and P/E metrics, reflecting solid profitability and valuation. Debt-to-equity and price-to-book ratios are moderate, indicating balanced leverage and asset valuation.
Analysis of the company’s bankruptcy risk
Smithfield Foods’ Altman Z-Score places it confidently in the safe zone, signaling low bankruptcy risk and solid financial stability:

Is the company in good financial health?
The Piotroski diagram highlights Smithfield Foods’ strong financial health and operational efficiency:

With a Piotroski score of 7, the company demonstrates robust fundamentals, suggesting effective management and sound financial condition.
Competitive Landscape & Sector Positioning
This analysis examines Smithfield Foods, Inc.’s strategic positioning, revenue segments, key products, and main competitors within the agricultural farm products sector. I will evaluate whether Smithfield Foods holds a competitive advantage over its peers.
Strategic Positioning
Smithfield Foods, Inc. maintains a diversified product portfolio spanning fresh pork (8.3B), packaged meats (8.8B), and hog production (3.4B), with additional bioscience operations. Geographically, it focuses primarily on the U.S. market, supplemented by exports to Mexico and select Asian countries.
Revenue by Segment
This pie chart illustrates Smithfield Foods, Inc.’s revenue distribution by segment for the fiscal year 2025, highlighting the relative contribution of each business unit.
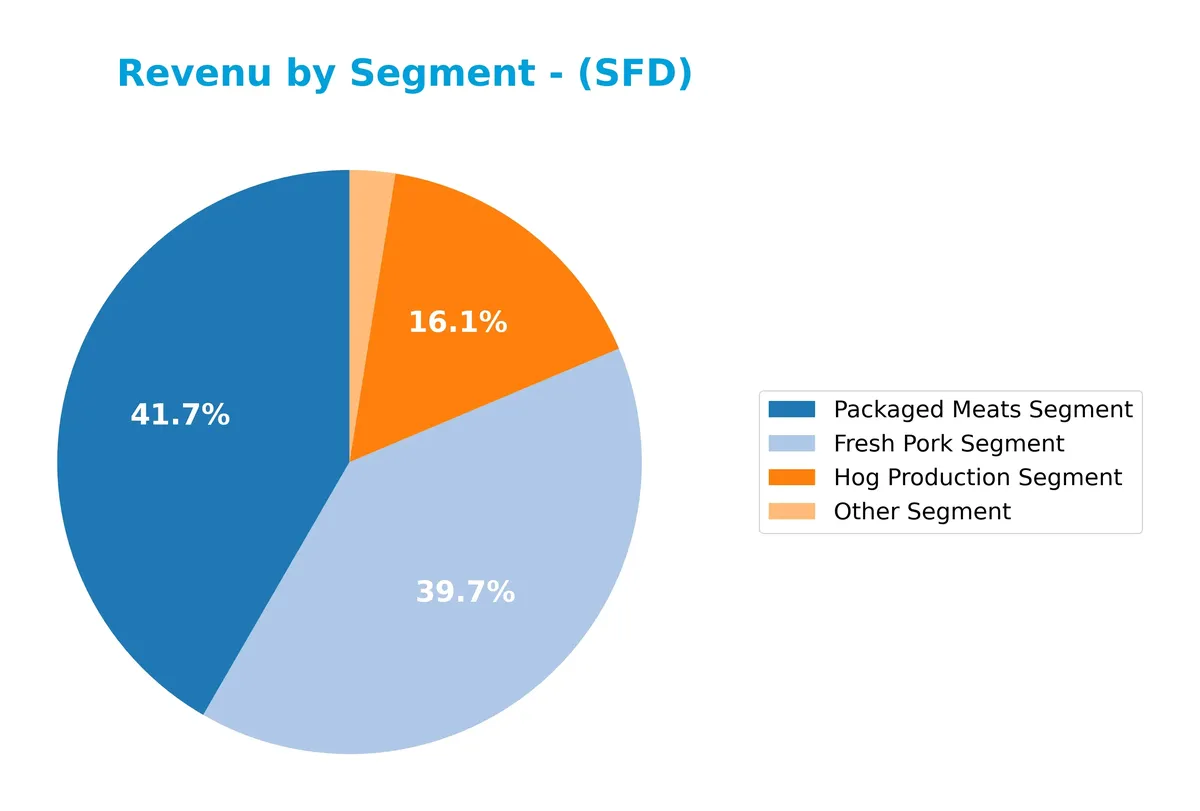
In 2025, Packaged Meats leads with $8.8B, closely followed by Fresh Pork at $8.3B. Hog Production contributes $3.4B, while Other Segment adds $528M. Compared to 2024, Fresh Pork and Packaged Meats revenues grew, indicating steady demand. Intersegment eliminations reduce total consolidated revenue, reflecting internal transactions. The concentration in Packaged Meats and Fresh Pork signals a focused portfolio with potential exposure to shifts in consumer preferences or supply chain risk.
Key Products & Brands
Smithfield Foods markets diverse meat products and fresh pork under multiple well-known brands:
| Product | Description |
|---|---|
| Packaged Meats | Processed fresh meat into bacon, sausage, hot dogs, deli meats, dry sausage, ham, ready-to-eat foods. |
| Fresh Pork | Primal and sub-primal fresh pork cuts including bellies, butts, hams, loins, picnics, and ribs. |
| Hog Production | Production and raising of hogs on company-owned and contract farms in the US and Mexico. |
| Bioscience Operations | Manufacture of heparin products, an active pharmaceutical ingredient reducing blood clot risk. |
| Brands | Smithfield, Eckrich, Nathan’s Famous, Farmland, Armour, Farmer John, Kretschmar, Krakus, John Morrell, and more. |
Smithfield Foods operates a vertically integrated model, spanning hog production to branded packaged meats. This breadth supports stable revenue streams across fresh and processed pork markets.
Main Competitors
Smithfield Foods, Inc. faces competition from 4 key players, with the table showing the top 4 leaders by market capitalization:
| Competitor | Market Cap. |
|---|---|
| Archer-Daniels-Midland Company | 28.4B |
| Tyson Foods, Inc. | 20.7B |
| Bunge Global S.A. | 17.9B |
| SMITHFIELD FOODS INC | 8.8B |
Smithfield Foods ranks 4th among its competitors, with a market cap roughly 37% of the leader Archer-Daniels-Midland. It sits below both the average market cap of the top 10 competitors (19B) and the sector median (19.3B). The company trails Tyson Foods by over 70%, indicating a significant gap with its closest rival.
Comparisons with competitors
Check out how we compare the company to its competitors:
Does SFD have a competitive advantage?
Smithfield Foods, Inc. presents a competitive advantage, evidenced by a ROIC exceeding WACC by 5.6%, indicating consistent value creation and stable profitability over 2021-2025. Its favorable net margin of 6.36% and revenue growth near 10% last year support operational efficiency in the agricultural sector.
Looking ahead, Smithfield leverages diverse product brands and international markets, including the U.S., Mexico, and Asia. Expansion opportunities exist in fresh pork exports and bioscience operations, potentially enhancing its market reach and sustaining its competitive moat.
SWOT Analysis
This analysis identifies Smithfield Foods’ internal strengths and weaknesses alongside external opportunities and threats shaping its strategic outlook.
Strengths
- strong brand portfolio
- favorable ROIC vs. WACC
- robust liquidity ratios
Weaknesses
- moderate net margin volatility
- rising operating expenses
- limited international revenue growth
Opportunities
- expanding foodservice channels
- growth in Asian export markets
- innovation in prepared foods
Threats
- commodity price fluctuations
- regulatory pressures on meat production
- changing consumer dietary trends
Smithfield’s solid financial foundation and brand strength support growth, but cost control and geographic diversification remain critical. Strategic focus on innovation and export expansion can mitigate external risks.
Stock Price Action Analysis
The weekly chart below illustrates Smithfield Foods, Inc.’s stock price movements during the recent 12-week period:
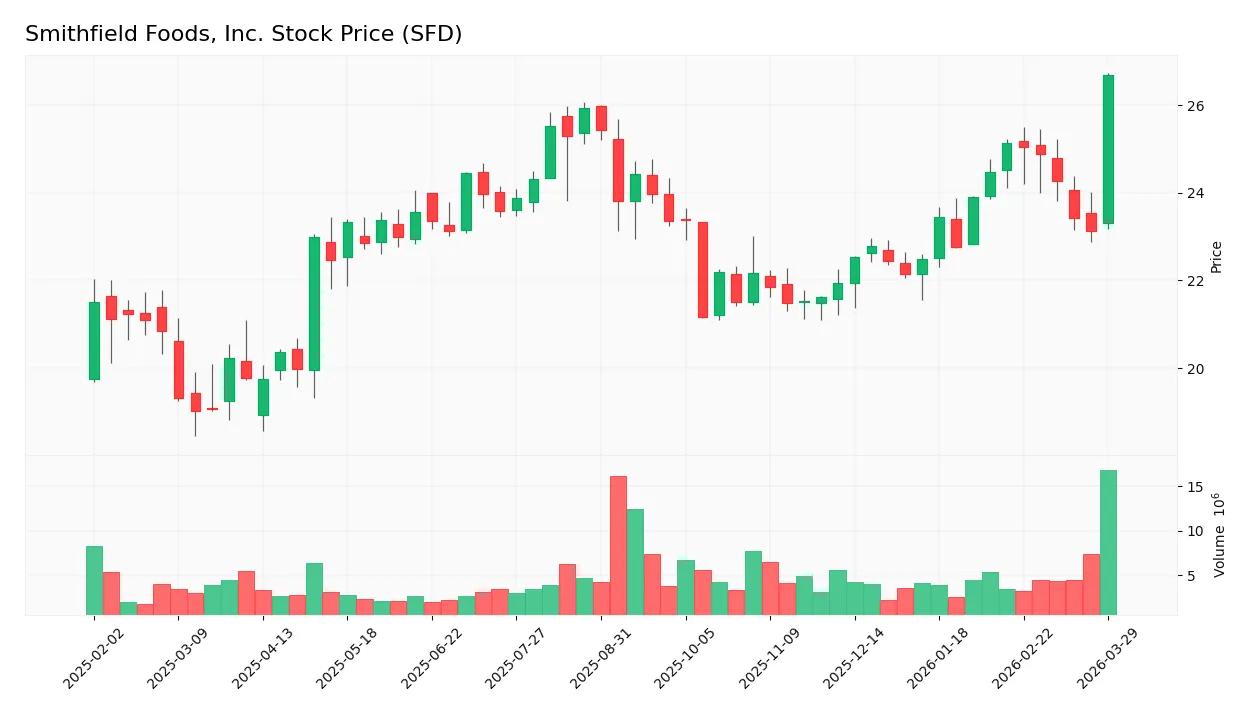
Trend Analysis
Over the past 12 weeks, Smithfield Foods’ stock price rose 24.14%, marking a clear bullish trend with accelerating momentum. The price fluctuated between a low of 19.02 and a high of 26.69. Volatility remains moderate, with a standard deviation of 1.76, supporting steady upward movement.
Volume Analysis
Trading volume has increased overall, with a slight buyer dominance of 59.19% in the last three months. Buyer volume outpaced sellers at 38M versus 26M shares, suggesting growing investor interest and positive market participation during this period.
Target Prices
Analysts present a unified target price consensus for Smithfield Foods, Inc. (SFD).
| Target Low | Target High | Consensus |
|---|---|---|
| 29 | 29 | 29 |
The consistent target price at $29 signals clear analyst conviction and a stable outlook for SFD in the near term.

Don’t Let Luck Decide Your Entry Point
Optimize your entry points with our advanced ProRealTime indicators. You’ll get efficient buy signals with precise price targets for maximum performance. Start outperforming now!
Analyst & Consumer Opinions
This section examines Smithfield Foods, Inc. (SFD), focusing on analyst ratings and consumer feedback trends.
Stock Grades
Here is the latest consensus and individual analyst grades for Smithfield Foods, Inc., reflecting current market sentiment:
| Grading Company | Action | New Grade | Date |
|---|---|---|---|
| Morgan Stanley | Maintain | Overweight | 2026-03-25 |
| B of A Securities | Maintain | Buy | 2025-10-08 |
| Barclays | Maintain | Overweight | 2025-08-13 |
| UBS | Maintain | Buy | 2025-08-13 |
| Morgan Stanley | Maintain | Overweight | 2025-08-13 |
The grades consistently show a positive stance with no downgrades or negative actions. The consensus remains a clear Buy, reflecting confidence across leading financial institutions.
Consumer Opinions
Smithfield Foods, Inc. inspires strong feelings among its customers, with praise and criticism shaping its market reputation.
| Positive Reviews | Negative Reviews |
|---|---|
| Quality meats with consistent flavor | Occasional delays in delivery |
| Wide product variety catering to many tastes | Packaging sometimes arrives damaged |
| Competitive pricing compared to peers | Customer service response times can lag |
Overall, consumers appreciate Smithfield’s product quality and pricing. However, delivery reliability and customer service responsiveness emerge as areas needing improvement. These factors could influence repeat purchasing behavior.
Risk Analysis
The following table highlights key risks facing Smithfield Foods, Inc., focusing on likelihood and potential impact:
| Category | Description | Probability | Impact |
|---|---|---|---|
| Market Competition | Intense competition in packaged meats could pressure margins and market share. | Medium | High |
| Supply Chain | Disruptions in hog production or grain supply may increase costs or limit output. | Medium | Medium |
| Regulatory | Food safety and environmental regulations could raise compliance costs. | Medium | Medium |
| Export Exposure | Dependence on export markets like China and Mexico exposes SFD to geopolitical risks. | Low | High |
| Commodity Prices | Volatility in feed grain prices affects hog production costs. | High | Medium |
The most likely risks stem from commodity price volatility and supply chain disruptions, both capable of squeezing margins. Export dependencies add geopolitical uncertainty but with lower probability. Smithfield’s strong balance sheet and favorable debt metrics provide some buffer against these risks.
Should You Buy Smithfield Foods, Inc.?
Smithfield Foods, Inc. appears to be a robust value creator with a favorable competitive moat supported by stable profitability and moderate leverage. While its debt profile suggests cautious monitoring, the company’s overall A rating indicates a very favorable financial health profile.
Strength & Efficiency Pillars
Smithfield Foods, Inc. posts a solid return on invested capital (ROIC) of 10.2%, comfortably above its weighted average cost of capital (WACC) at 4.6%, confirming it as a clear value creator. The firm maintains a respectable net margin of 6.36% and a return on equity (ROE) of 14.51%, reflecting consistent profitability and operational efficiency. Its low debt-to-equity ratio of 0.35 and robust interest coverage of 32.32 further underscore prudent capital allocation and financial stability.
Weaknesses and Drawbacks
Smithfield’s price-to-earnings ratio stands at 8.98, which is favorable and suggests a reasonable valuation, while the price-to-book ratio at 1.3 also indicates fair market pricing. Leverage metrics, including a current ratio of 2.97 and a quick ratio of 1.63, reveal sound liquidity. Seller dominance is low recently, with buyers controlling 59.19% volume, reducing short-term market pressure. Overall, no critical weaknesses emerge from valuation or leverage, supporting a stable risk profile.
Our Final Verdict about Smithfield Foods, Inc.
Smithfield Foods presents a fundamentally strong profile backed by a safe Altman Z-Score of 3.57 and a strong Piotroski score of 7, signaling solid financial health. The company’s bullish long-term trend, supported by increasing volume and buyer dominance, suggests that it may appear attractive for long-term exposure. Despite minor neutral margins, the overall financial and operational strength bodes well for patient investors.
Disclaimer: This content is for informational purposes only and does not constitute financial, investment, or other professional advice. Investing in financial markets involves a significant risk of loss, and past performance is not indicative of future results.
Additional Resources
- Smithfield Foods, Inc. (SFD) tops Q4 earnings and revenue estimates – MSN (Mar 27, 2026)
- [10-K] SMITHFIELD FOODS INC Files A… – Stock Titan (Mar 24, 2026)
- Tudor Investment Corp ET AL Buys New Shares in Smithfield Foods, Inc. $SFD – MarketBeat (Mar 26, 2026)
- Smithfield Foods, Inc. (SFD) Reports Q4 Earnings – AlphaStreet (Mar 24, 2026)
- Smithfield Foods Inc (SFD) Stock Price Up 5.15% on Mar 24 – GuruFocus (Mar 24, 2026)
For more information about Smithfield Foods, Inc., please visit the official website: smithfieldfoods.com