Home > Analyses > Energy > SLB N.V.
SLB N.V. transforms the energy landscape by delivering cutting-edge technology that fuels global oil and gas production. As a dominant force in oilfield services, SLB excels in digital integration, reservoir performance, and well construction, driving efficiency and innovation across the energy sector. Renowned for its comprehensive solutions and commitment to sustainability, SLB is reshaping how energy is sourced and managed. Yet, as the energy transition accelerates, investors must ask: does SLB’s current valuation reflect its growth potential and evolving industry role?
Table of contents
Business Model & Company Overview
SLB N.V., founded in 1926 and headquartered in Houston, Texas, stands as a global leader in the Oil & Gas Equipment & Services sector. The company delivers a comprehensive ecosystem spanning Digital & Integration, Reservoir Performance, Well Construction, and Production Systems, uniting technologies and services that drive efficient hydrocarbon production and energy transition efforts worldwide. This cohesive approach positions SLB as a cornerstone in energy industry innovation.
SLB’s revenue engine balances advanced technology solutions with recurring services, including drilling fluids, reservoir evaluation, and integrated subsea production systems. Its strategic footprint spans the Americas, Europe, and Asia, enabling tailored support to a diverse client base. The company’s robust portfolio and global reach underpin a durable competitive advantage, securing its influence in shaping the future of energy exploration and production.
Financial Performance & Fundamental Metrics
This section examines SLB N.V.’s income statement, key financial ratios, and dividend payout policy to provide a clear view of its fundamental strength.
Income Statement
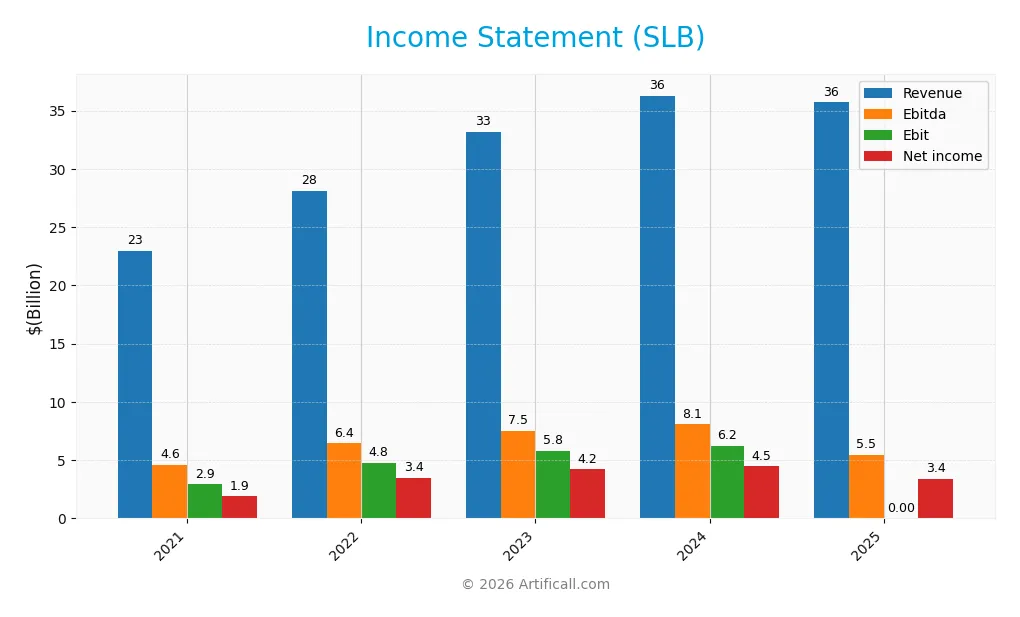
This table summarizes SLB N.V.’s key income statement figures for the fiscal years 2021 through 2025, reported in USD.
| 2021 | 2022 | 2023 | 2024 | 2025 | |
|---|---|---|---|---|---|
| Revenue | 22.9B | 28.1B | 33.1B | 36.3B | 35.7B |
| Cost of Revenue | 19.3B | 22.9B | 26.6B | 28.8B | 29.2B |
| Operating Expenses | 893M | 1.01B | 1.08B | 1.13B | 1.05B |
| Gross Profit | 3.7B | 5.2B | 6.6B | 7.5B | 6.5B |
| EBITDA | 4.6B | 6.4B | 7.5B | 8.1B | 5.5B |
| EBIT | 2.9B | 4.8B | 5.8B | 6.2B | 0 |
| Interest Expense | 539M | 490M | 503M | 512M | 0 |
| Net Income | 1.9B | 3.4B | 4.2B | 4.5B | 3.4B |
| EPS | 1.34 | 2.43 | 2.95 | 3.14 | 2.38 |
| Filing Date | 2022-01-26 | 2023-01-25 | 2024-01-24 | 2025-01-22 | 2026-01-23 |
Income Statement Evolution
From 2021 to 2025, SLB N.V. experienced overall revenue growth of 55.7%, accompanied by a 79.4% rise in net income, indicating significant expansion. However, revenue and gross profit declined by 1.6% and 12.8% respectively in the most recent year, with net margin falling 23.1%, reflecting margin pressures. The gross margin remained neutral at 18.2%, while net margin showed favorable improvement over the full period.
Is the Income Statement Favorable?
In 2025, SLB reported revenue of $35.7B and net income of $3.37B, yielding a net margin of 9.45%, considered favorable. Despite this, the EBIT margin dropped to zero, noted as unfavorable, and key profitability metrics declined compared to 2024. Interest expense was effectively zero, a positive factor, but the overall one-year declines in earnings per share and net margin mark caution. The global evaluation rates the income statement as generally favorable.
Financial Ratios
The table below presents key financial ratios for SLB N.V. over the fiscal years 2021 to 2025, summarizing profitability, valuation, liquidity, leverage, efficiency, and dividend metrics:
| Ratios | 2021 | 2022 | 2023 | 2024 | 2025 |
|---|---|---|---|---|---|
| Net Margin | 8.2% | 12.2% | 12.7% | 12.3% | 9.4% |
| ROE | 12.5% | 19.5% | 20.8% | 21.1% | 9.2% |
| ROIC | 7.0% | 10.4% | 12.5% | 13.7% | 8.8% |
| P/E | 22.3 | 22.0 | 17.6 | 12.2 | 16.2 |
| P/B | 2.8 | 4.3 | 3.7 | 2.6 | 1.5 |
| Current Ratio | 1.2 | 1.2 | 1.3 | 1.4 | 6.4 |
| Quick Ratio | 0.9 | 0.9 | 1.0 | 1.1 | 4.6 |
| D/E | 0.95 | 0.69 | 0.59 | 0.57 | 0.32 |
| Debt-to-Assets | 34.2% | 28.3% | 24.9% | 24.7% | 23.6% |
| Interest Coverage | 5.1 | 8.5 | 10.9 | 12.4 | 0 |
| Asset Turnover | 0.55 | 0.65 | 0.69 | 0.74 | 0.72 |
| Fixed Asset Turnover | 3.2 | 3.9 | 4.1 | 4.4 | 4.5 |
| Dividend Yield | 1.7% | 1.1% | 1.8% | 2.8% | 2.9% |
Evolution of Financial Ratios
From 2021 to 2025, SLB N.V.’s Return on Equity (ROE) demonstrated volatility, peaking near 21% in 2024 before dropping to 9.15% in 2025, indicating reduced profitability. The Current Ratio surged dramatically to 6.43 in 2025 from around 1.22-1.45 in previous years, signaling increased liquidity but potential inefficiency. The Debt-to-Equity Ratio steadily declined from 0.95 in 2021 to 0.32 in 2025, reflecting reduced leverage and improved financial stability.
Are the Financial Ratios Fovorable?
In 2025, SLB’s profitability ratios are mixed: net margin and ROE are neutral to unfavorable, while return on invested capital is neutral. Liquidity shows contrast with a high, unfavorable Current Ratio but a favorable Quick Ratio. Leverage metrics, including debt-to-equity (0.32) and debt-to-assets (23.56%), are favorable, reflecting manageable debt levels. Market valuation ratios like price-to-book (1.48) are favorable, but interest coverage at zero remains a concern. Overall, the ratios present a slightly favorable financial position.
Shareholder Return Policy
SLB N.V. maintains a consistent dividend policy, with a payout ratio near 47.5% in 2025 and a dividend yield of approximately 2.94%. The company’s dividend per share has steadily increased, supported by free cash flow coverage of about 74%, indicating balanced distributions without overextension.
Share buybacks are part of SLB’s approach, complementing dividend payments to return value to shareholders. This combined strategy, backed by solid free cash flow and manageable payout levels, appears structured to support sustainable long-term shareholder value creation.
Score analysis
The following radar chart presents a comprehensive view of SLB N.V.’s key financial scores for investor consideration:

SLB N.V. shows very favorable scores in discounted cash flow (5) and return on assets (5), with favorable return on equity (4). However, debt to equity (2), price to earnings (2), and price to book (3) scores indicate moderate valuation and leverage metrics.
Analysis of the company’s bankruptcy risk
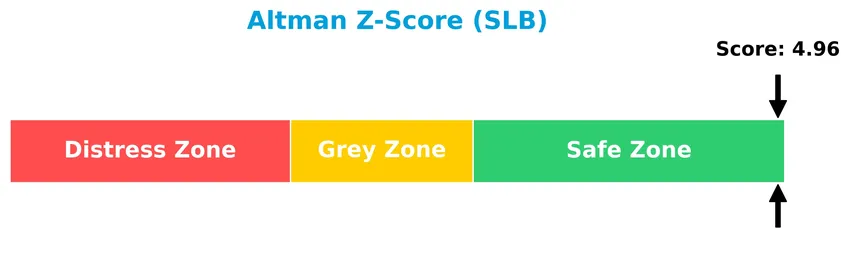
The Altman Z-Score places SLB N.V. comfortably in the safe zone, suggesting a low risk of bankruptcy:
Is the company in good financial health?
This Piotroski diagram illustrates SLB N.V.’s financial strength based on multiple accounting criteria:

With a Piotroski Score of 6 categorized as average, SLB N.V. demonstrates moderate financial health, indicating some strengths but also areas that may require attention.
Competitive Landscape & Sector Positioning
This sector analysis will examine SLB N.V.’s strategic positioning, revenue breakdown, key products, main competitors, and competitive advantages. I will also conduct a SWOT analysis to understand the company’s overall standing. The goal is to determine whether SLB N.V. holds a competitive advantage over its peers in the Oil & Gas Equipment & Services industry.
Strategic Positioning
SLB N.V. exhibits a diversified product portfolio spanning Digital & Integration, Production Systems, Reservoir Characterization, and Well Construction, with revenues in 2025 ranging from $2.66B to $13.3B per segment. Geographically, its exposure is balanced across the Middle East ($12.2B), Europe C I S Africa ($9.6B), North America ($7.5B), and Latin America ($6.2B), reflecting a global operational footprint in energy technology services.
Revenue by Segment
This pie chart illustrates SLB N.V.’s revenue distribution across its main business segments for the fiscal year 2025.
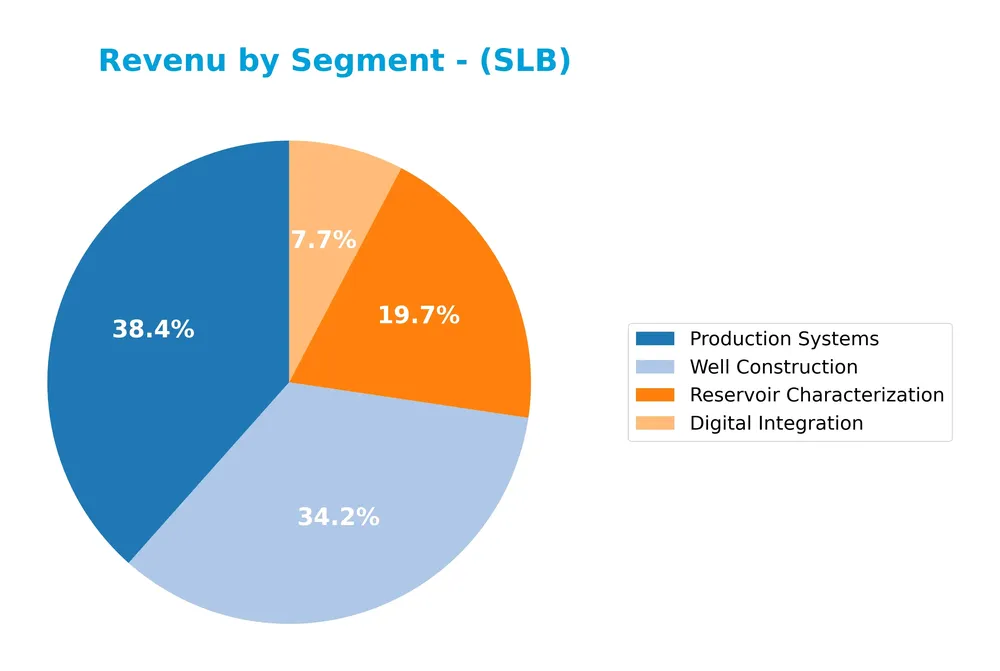
In 2025, Production Systems led with $13.3B, followed by Well Construction at $11.9B and Reservoir Characterization with $6.8B. Digital Integration contributed $2.7B, showing a notable decline from previous years. The trend indicates a concentration in traditional oilfield services, with digital solutions facing a slowdown, signaling potential risks if diversification is not addressed.
Key Products & Brands
The following table summarizes SLB N.V.’s key product divisions and their main functions:
| Product | Description |
|---|---|
| Digital & Integration | Technology services including reservoir interpretation, data processing, carbon management, and integration of energy systems. |
| Production Systems | Products and services for artificial lift, packers, safety valves, sand control, intelligent systems, valves, chokes, actuators, surface trees, and midstream production systems. |
| Reservoir Characterization | Subsurface geology and fluids evaluation, stimulation services (hydraulic fracturing, matrix stimulation, water treatment), intervention services, and reservoir performance enhancement. |
| Well Construction | Well planning, drilling equipment and services, drilling rig management, mud logging, directional drilling, measurement-while-drilling, logging-while-drilling, and borehole technologies. |
| OneSubsea | Integrated subsea solutions including wellheads, subsea trees, manifolds, flowline connectors, control systems, and related services. |
SLB’s portfolio encompasses comprehensive technology and equipment offerings across the full oil and gas extraction value chain, focusing on digital integration, reservoir analysis, well construction, production enhancement, and subsea systems.
Main Competitors
There are 4 competitors in the Oil & Gas Equipment & Services industry, with the table listing the top 4 leaders by market capitalization:
| Competitor | Market Cap. |
|---|---|
| SLB N.V. | 60.1B |
| Baker Hughes Company | 46.5B |
| Halliburton Company | 25.5B |
| TechnipFMC plc | 18.6B |
SLB N.V. ranks 1st among its 4 competitors, with a market cap 22% above the next largest player, Baker Hughes. The company is positioned above both the average market cap of the top 10 in the sector (37.7B) and the sector median (36B). The gap to its closest competitor below is significant at -57.85%.
Comparisons with competitors
Check out how we compare the company to its competitors:
Does SLB have a competitive advantage?
SLB N.V. presents a durable competitive advantage, as evidenced by a ROIC exceeding its WACC by 2.19% and a strong upward trend in ROIC of 26.34% over 2021-2025, signaling efficient capital use and value creation. This performance supports the assessment of a very favorable moat, indicating sustained profitability in the oil and gas equipment and services industry.
Looking ahead, SLB’s future outlook includes opportunities in expanding its technology offerings across four divisions: Digital & Integration, Reservoir Performance, Well Construction, and Production Systems. The company’s focus on carbon management, subsurface evaluation, and integrated subsea solutions positions it to capitalize on evolving energy sector demands and adjacent market integration.
SWOT Analysis
This SWOT analysis highlights SLB N.V.’s key internal and external factors to guide informed investment decisions.
Strengths
- Strong market position with 73B market cap
- Diverse technology offerings across energy sectors
- Durable competitive advantage with growing ROIC
Weaknesses
- Recent 1-year decline in revenue and profits
- EBIT margin at zero, indicating operational challenges
- Moderate debt-to-equity ratio with some liquidity concerns
Opportunities
- Expansion in Middle East and emerging markets
- Growing demand for carbon management solutions
- Increasing digital integration in energy services
Threats
- Volatile oil & gas prices impacting demand
- Technological disruption and energy transition risks
- Intense global competition and geopolitical instability
SLB demonstrates a solid foundation and competitive moat but faces short-term profitability pressures and sector volatility. Strategic focus on innovation and regional growth will be critical to mitigate risks and capitalize on emerging energy trends.
Stock Price Action Analysis
The following weekly stock chart illustrates SLB N.V.’s price movements and volatility over the past 12 months:
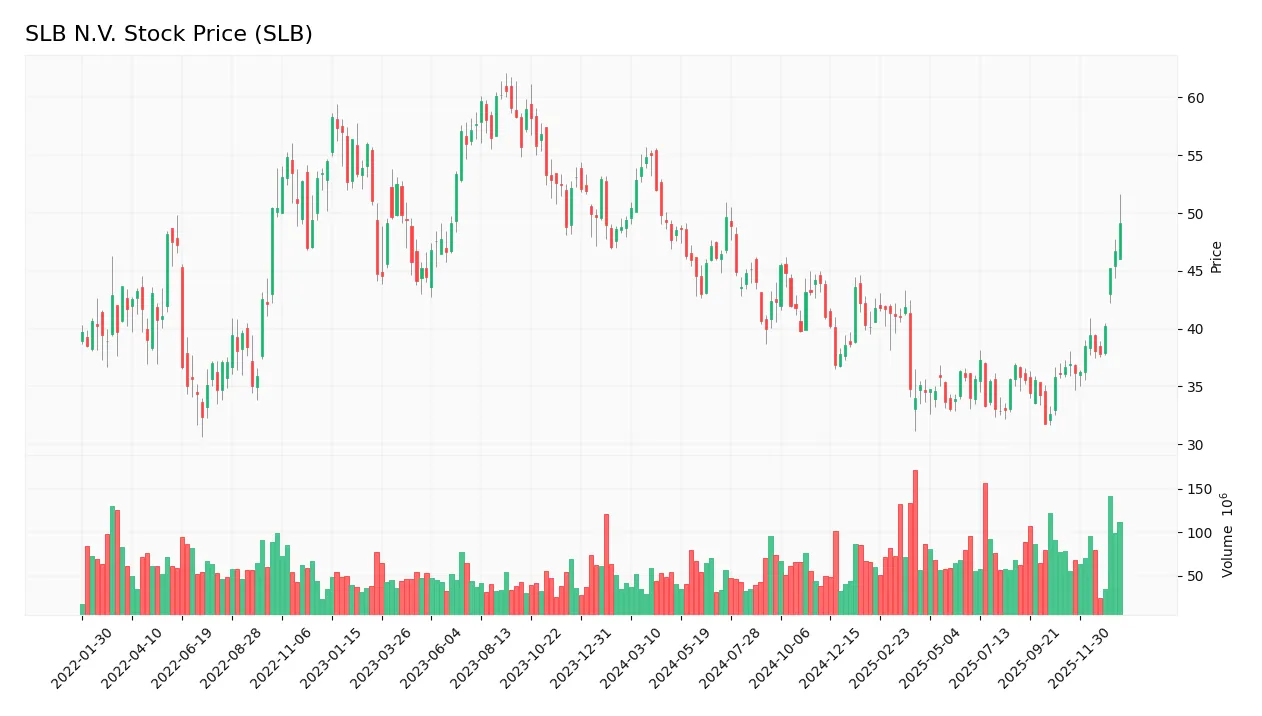
Trend Analysis
Over the past 12 months, SLB’s stock price declined by 0.41%, indicating a bearish trend according to the defined threshold. The trend shows acceleration despite the slight overall decrease, with price volatility measured by a 5.75 standard deviation and notable price extremes at 55.03 (high) and 31.72 (low).
Volume Analysis
In the last three months, trading volume has been increasing, with buyer volume strongly dominating at 81.32%. This buyer-driven activity suggests heightened investor interest and market participation, contrasting with the overall period where seller volume was higher at 56.29%.
Target Prices
The consensus target prices for SLB N.V. reflect moderate optimism among analysts.
| Target High | Target Low | Consensus |
|---|---|---|
| 57 | 45 | 50.53 |
Analysts expect SLB’s stock price to range between 45 and 57, with a consensus target around 50.5, indicating a cautiously positive outlook.

Don’t Let Luck Decide Your Entry Point
Optimize your entry points with our advanced ProRealTime indicators. You’ll get efficient buy signals with precise price targets for maximum performance. Start outperforming now!
Analyst & Consumer Opinions
This section reviews recent analyst ratings and consumer feedback regarding SLB N.V., highlighting diverse perspectives.
Stock Grades
Here is the latest summary of SLB N.V.’s stock grades from recognized financial institutions, reflecting their current outlooks:
| Grading Company | Action | New Grade | Date |
|---|---|---|---|
| Stifel | Maintain | Buy | 2026-01-21 |
| Susquehanna | Maintain | Positive | 2026-01-07 |
| Freedom Capital Markets | Downgrade | Hold | 2026-01-06 |
| Evercore ISI Group | Upgrade | Outperform | 2026-01-06 |
| Piper Sandler | Maintain | Overweight | 2025-12-18 |
| Barclays | Maintain | Overweight | 2025-12-17 |
| UBS | Maintain | Buy | 2025-12-12 |
| Bernstein | Maintain | Outperform | 2025-12-11 |
| Citigroup | Maintain | Buy | 2025-12-11 |
| TD Cowen | Maintain | Buy | 2025-12-11 |
The overall trend shows a predominantly positive stance with most firms maintaining buy or overweight ratings, balanced by a single hold downgrade and an upgrade to outperform, indicating some varied but generally favorable analyst sentiment.
Consumer Opinions
Consumers have voiced a variety of opinions about SLB N.V., reflecting both satisfaction and areas for improvement.
| Positive Reviews | Negative Reviews |
|---|---|
| “SLB offers reliable and innovative energy solutions.” | “Customer service response times can be slow.” |
| “Their technology significantly improves operational efficiency.” | “Pricing is sometimes higher than competitors.” |
| “Strong commitment to sustainability is evident.” | “Some projects face delays impacting delivery.” |
Overall, consumer feedback highlights SLB’s technological innovation and sustainability efforts as key strengths, while concerns focus on customer service responsiveness and occasional project delays.
Risk Analysis
Below is a table summarizing key risks associated with investing in SLB N.V., including their likelihood and potential impact:
| Category | Description | Probability | Impact |
|---|---|---|---|
| Market Volatility | Exposure to fluctuating oil prices and energy demand impacting revenue stability. | Medium | High |
| Operational Risks | Complex technology and services delivery could face disruptions or cost overruns. | Medium | Medium |
| Financial Ratios | Unfavorable ROE and interest coverage ratios may indicate challenges in profitability and debt servicing. | Medium | Medium |
| Regulatory Risks | Environmental regulations and carbon management policies could increase compliance costs. | Medium | High |
| Geopolitical Risks | Global operations may be affected by political instability in key oil-producing regions. | Low | High |
| Dividend Sustainability | Dividend yield is favorable but depends on stable cash flow and earnings amid market pressures. | Medium | Medium |
The most significant risks for SLB currently come from market volatility and regulatory changes, given their direct impact on profitability and operational costs. Despite a strong Altman Z-score indicating financial safety, the company’s moderate Piotroski score and some unfavorable financial metrics suggest caution. As always, I recommend close monitoring of commodity prices and regulatory developments.
Should You Buy SLB N.V.?
SLB N.V. appears to be generating robust value creation supported by a durable competitive moat with growing profitability. Despite a moderate leverage profile, its financial health could be seen as very favorable, reflected in an overall A- rating and a safe zone Altman Z-Score.
Strength & Efficiency Pillars
SLB N.V. exhibits solid value creation, with a return on invested capital (ROIC) of 8.85% comfortably exceeding its weighted average cost of capital (WACC) at 6.66%, confirming its status as a value creator. The company’s Altman Z-Score of 4.96 places it safely in the safe zone, signaling robust financial health, while a Piotroski score of 6 indicates average but stable financial strength. Favorable debt-to-equity at 0.32 and a quick ratio of 4.63 further reinforce balance sheet resilience. Dividend yield of 2.94% adds to investor appeal through income generation.
Weaknesses and Drawbacks
Despite strengths, SLB shows notable vulnerabilities. Return on equity (ROE) stands at a modest 9.15%, flagged as unfavorable, reflecting limited profitability relative to shareholder equity. The current ratio is elevated at 6.43, which may suggest inefficient use of working capital. Moderate price-to-earnings (P/E) of 16.16 and price-to-book (P/B) of 1.48 indicate neither strong undervaluation nor excessive premium, but they temper valuation enthusiasm. Additionally, the stock’s overall price trend remains bearish (-0.41%), presenting near-term market pressure despite recent buyer dominance.
Our Verdict about SLB N.V.
SLB’s long-term fundamental profile appears favorable, supported by its strong capital efficiency and financial stability. The recent period shows strong buyer dominance (81.32%) and positive price momentum (+34.07%), which could signal emerging upside potential. However, the broader bearish trend advises caution. Therefore, despite enduring value creation and improving investor interest, the profile might suggest a wait-and-see approach to capture a more advantageous entry point.
Disclaimer: This content is for informational purposes only and does not constitute financial, investment, or other professional advice. Investing in financial markets involves a significant risk of loss, and past performance is not indicative of future results.
Additional Resources
- SLB N.V. (NYSE:SLB) Q4 2025 Earnings Call Transcript – Insider Monkey (Jan 24, 2026)
- Analysts Turn More Positive on SLB N.V. (SLB) – Yahoo Finance (Jan 19, 2026)
- Earnings call transcript: SLB Q4 2025 beats forecasts, stock rises – Investing.com (Jan 23, 2026)
- Jim Cramer says “I think that it’s very hard for SLB to deliver special numbers” – MSN (Jan 22, 2026)
- SLB ready to quickly ramp up Venezuela activity, CEO says (SLB:NYSE) – Seeking Alpha (Jan 23, 2026)
For more information about SLB N.V., please visit the official website: slb.com