Home > Analyses > Technology > SkyWater Technology, Inc.
SkyWater Technology powers critical innovations behind the scenes, enabling advanced semiconductor solutions that shape modern electronics. It excels in custom chip manufacturing for industries like aerospace, automotive, and bio-health, blending engineering expertise with cutting-edge process development. Known for its nimble approach and market niche in silicon-based analog and rad-hard circuits, SkyWater challenges larger players. The key question: does its fundamental strength support sustained growth amid semiconductor sector volatility?
Table of contents
Business Model & Company Overview
SkyWater Technology, Inc. is a US-based semiconductor firm founded in 2017 and headquartered in Bloomington, Minnesota. It commands a competitive advantage by offering an integrated ecosystem of semiconductor development and manufacturing services. Its portfolio spans silicon-based analog, mixed-signal, power discrete, MEMS, and rad-hard integrated circuits, serving diverse sectors from aerospace to bio-health.
The company drives value through a balanced revenue engine combining engineering support and process development with manufacturing services. SkyWater’s footprint extends globally, addressing markets across the Americas, Europe, and Asia. Its economic moat lies in co-creating advanced technologies with customers, shaping the future of semiconductor innovation.
Financial Performance & Fundamental Metrics
I analyze SkyWater Technology, Inc.’s income statement, key financial ratios, and dividend payout policy to assess its core financial health and shareholder value.
Income Statement
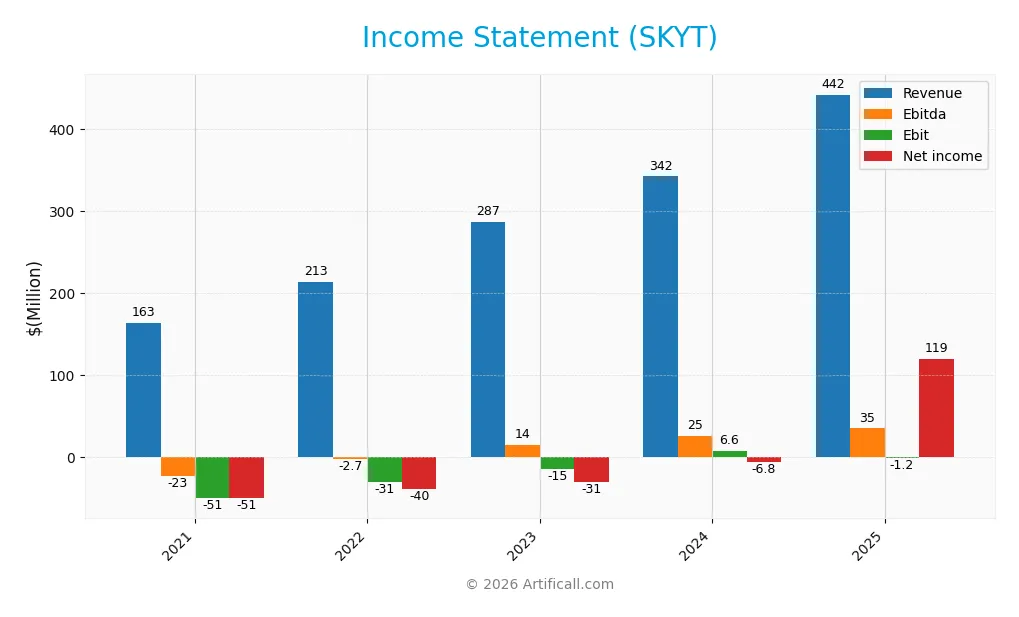
The table below summarizes SkyWater Technology, Inc.’s key income statement figures for fiscal years 2021 through 2025, reflecting revenue trends and profitability metrics.
| 2021 | 2022 | 2023 | 2024 | 2025 | |
|---|---|---|---|---|---|
| Revenue | 163M | 213M | 287M | 342M | 442M |
| Cost of Revenue | 170M | 187M | 227M | 273M | 354M |
| Operating Expenses | 50M | 56M | 74M | 63M | 90M |
| Gross Profit | -7M | 26M | 59M | 70M | 88M |
| EBITDA | -23M | -3M | 14M | 25M | 35M |
| EBIT | -51M | -31M | -15M | 7M | -1M |
| Interest Expense | 3.5M | 5.2M | 10.8M | 8.8M | 13.7M |
| Net Income | -51M | -40M | -31M | -7M | 119M |
| EPS | -1.19 | -0.90 | -0.68 | -0.14 | 2.47 |
| Filing Date | 2022-03-10 | 2023-09-26 | 2024-03-15 | 2025-03-14 | 2026-03-11 |
Income Statement Evolution
SkyWater Technology’s revenue grew 171.5% from 2021 to 2025, with a 29.2% jump in 2025 alone. Gross profit increased alongside revenue, maintaining a neutral gross margin near 20%. However, EBIT margin turned unfavorable, slipping to -0.26% in 2025 despite rising revenues, signaling margin pressure.
Is the Income Statement Favorable?
In 2025, SkyWater posted a strong net margin of 26.9%, up sharply from previous losses, driven by a remarkable 1455% net margin growth. EBITDA improved but EBIT remained slightly negative at -0.26%. Interest expense ratio at 3.1% was favorable, supporting net income growth. Overall, fundamentals appear favorable, with notable revenue and earnings recovery.
Financial Ratios
The table below presents key financial ratios for SkyWater Technology, Inc. over the past five fiscal years:
| Ratios | 2021 | 2022 | 2023 | 2024 | 2025 |
|---|---|---|---|---|---|
| Net Margin | -31% | -19% | -11% | -2% | 27% |
| ROE | -83% | -74% | -57% | -12% | 63% |
| ROIC | -23% | -13% | -7% | 3% | -0.2% |
| P/E | -12.7x | -7.3x | -14.2x | -100.3x | 7.5x |
| P/B | 10.6x | 5.4x | 8.1x | 11.8x | 4.7x |
| Current Ratio | 1.56 | 0.88 | 1.02 | 0.86 | 0.60 |
| Quick Ratio | 1.19 | 0.78 | 0.91 | 0.76 | 0.52 |
| D/E | 1.01 | 1.92 | 1.36 | 1.33 | 1.33 |
| Debt-to-Assets | 23% | 34% | 23% | 24% | 34% |
| Interest Coverage | -16.1x | -5.7x | -1.4x | 0.7x | -0.1x |
| Asset Turnover | 0.62 | 0.70 | 0.91 | 1.09 | 0.60 |
| Fixed Asset Turnover | 0.90 | 1.18 | 1.80 | 2.07 | 0.86 |
| Dividend Yield | 0.45% | 0.00% | 0.00% | 0.00% | 0.00% |
Evolution of Financial Ratios
SkyWater Technology’s Return on Equity (ROE) surged from negative territory in 2024 to a strong 63.3% in 2025, signaling an impressive rebound in shareholder returns. The Current Ratio declined steadily, reaching 0.6 in 2025, indicating weakening short-term liquidity. Debt-to-Equity remained elevated around 1.33, reflecting consistent leverage with limited deleveraging.
Are the Financial Ratios Favorable?
The profitability metrics, including a 26.9% net margin and 63.3% ROE, appear favorable and outperform typical sector benchmarks. However, liquidity ratios such as Current Ratio (0.6) and Quick Ratio (0.52) are unfavorable, signaling potential short-term financial strain. Leverage remains high with Debt-to-Equity at 1.33 and negative Interest Coverage, posing risks. Overall, the ratio profile leans unfavorable due to liquidity and leverage concerns.
Shareholder Return Policy
SkyWater Technology, Inc. does not pay dividends, reflecting its strategy to prioritize reinvestment and growth. The company has no dividend yield or payout ratio, consistent with its negative free cash flow and operating cash flow per share in recent years.
The firm does not engage in share buybacks either, suggesting a focus on capital allocation toward operations and development. This approach aligns with long-term value creation in a high-growth or capital-intensive phase, though it may delay direct shareholder returns.
Score analysis
Here is a radar chart illustrating SkyWater Technology, Inc.’s key financial scores across multiple valuation and performance metrics:
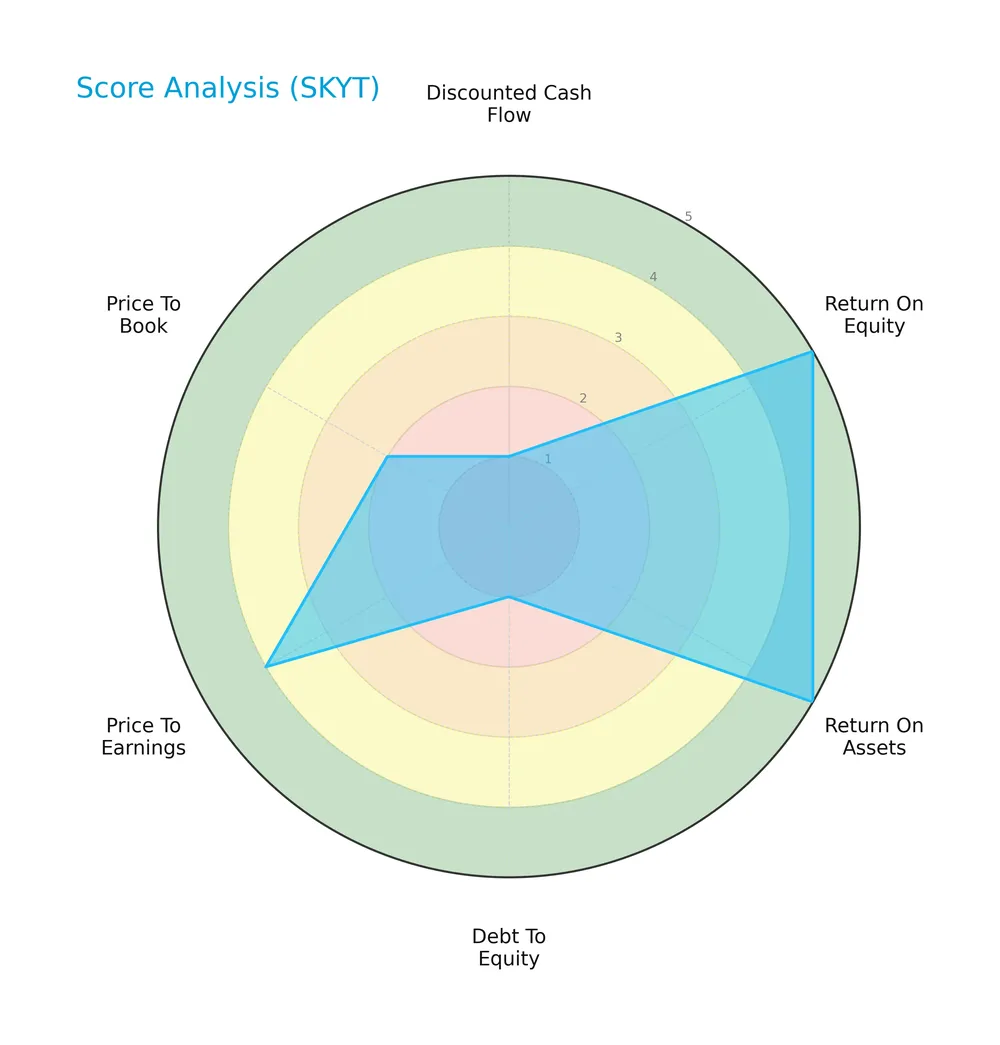
The company scores very favorably on return on equity and assets, signaling efficient capital use. However, it shows very unfavorable marks on discounted cash flow and debt-to-equity, indicating valuation and leverage concerns. Price multiples reveal mixed sentiment with favorable PE but unfavorable PB ratios.
Analysis of the company’s bankruptcy risk
SkyWater Technology’s Altman Z-Score places it in the grey zone, indicating moderate bankruptcy risk and financial uncertainty:

Is the company in good financial health?
The Piotroski Score diagram provides insight into the company’s financial strength and operational efficiency:
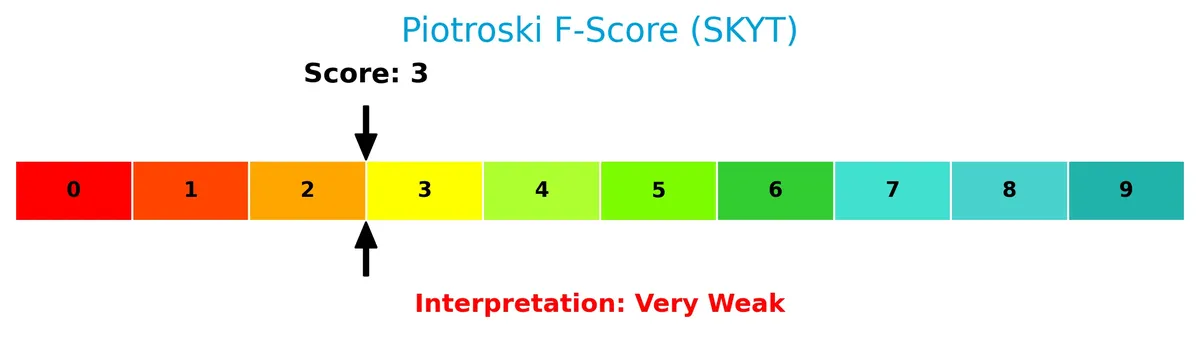
A score of 3 suggests very weak financial health, reflecting potential issues in profitability, liquidity, or leverage that investors should monitor closely.
Competitive Landscape & Sector Positioning
This analysis examines SkyWater Technology, Inc.’s strategic positioning within the semiconductor sector. It covers revenue breakdown, key products, competitors, and competitive advantages. I will assess whether SkyWater holds a distinct competitive edge over its peers.
Strategic Positioning
SkyWater Technology focuses on semiconductor manufacturing with a concentrated product portfolio in wafer and advanced technology services. Its revenue is heavily reliant on the U.S. market, accounting for over 85% of sales in 2025, reflecting limited geographic diversification.
Revenue by Segment
This pie chart illustrates SkyWater Technology’s revenue distribution by segment for the fiscal year 2025, highlighting the composition of its advanced technology and wafer service lines.
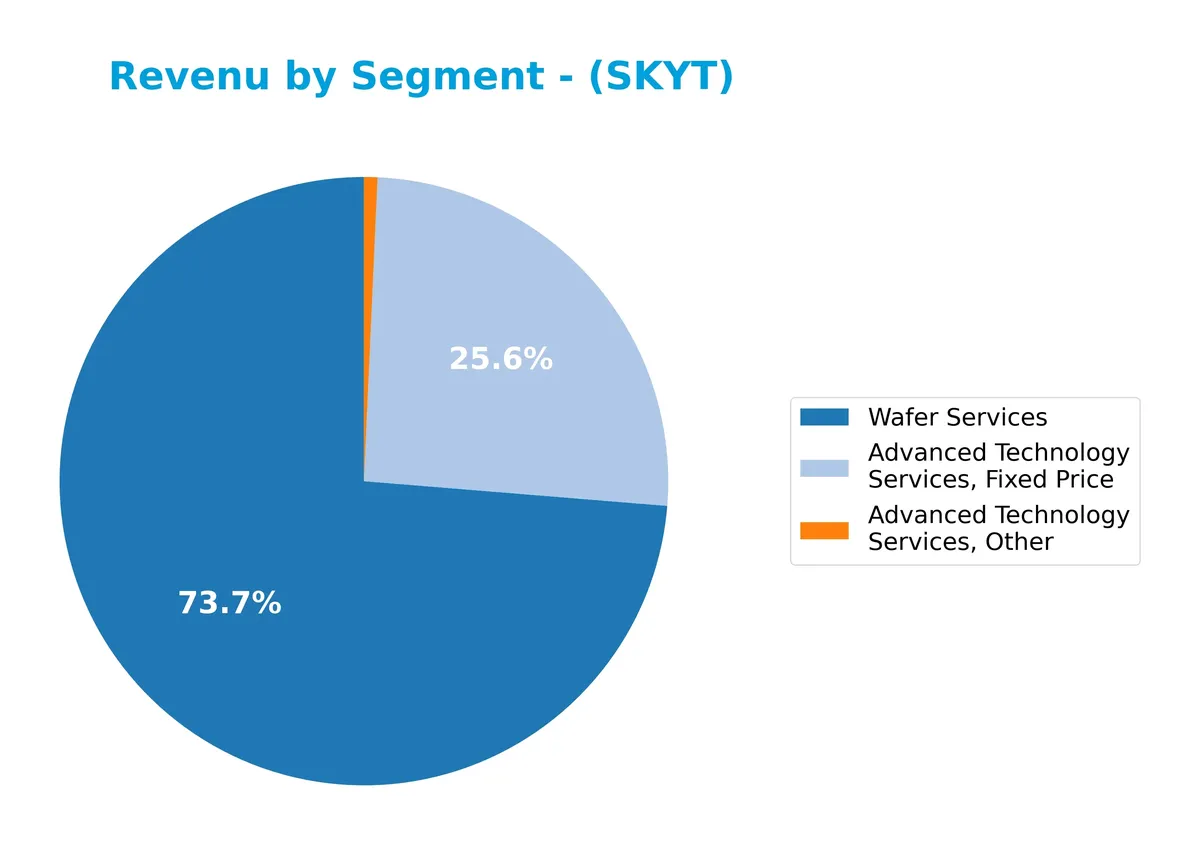
In 2025, Wafer Services dominates with $201M, marking it as the primary revenue driver despite declining from prior years. Advanced Technology Services, Fixed Price contributes $70M, showing a notable slowdown compared to 2024’s $93M. Other advanced services have diminished to negligible levels. The revenue concentration in Wafer Services signals a shift in SkyWater’s business focus, but the decline warrants cautious monitoring for future stability.
Key Products & Brands
SkyWater Technology’s revenue streams break down into specialized semiconductor services and wafer manufacturing as follows:
| Product | Description |
|---|---|
| Advanced Technology Services | Engineering and process development support, including fixed price, time and materials, and other contracts. |
| Advanced Technology Services, Fixed Price | Contracted semiconductor development services billed at a fixed rate. |
| Advanced Technology Services, Time And Materials | Semiconductor development billed based on hours and materials used. |
| Advanced Technology Services, Other | Miscellaneous revenue from advanced technology service offerings. |
| Wafer Services | Semiconductor wafer manufacturing for silicon-based analog, mixed-signal, power discrete, MEMS, and rad-hard ICs. |
SkyWater’s product mix emphasizes advanced technology services with diverse contract structures alongside wafer manufacturing. This combination supports clients across aerospace, automotive, bio-health, and industrial sectors.
Main Competitors
SkyWater Technology, Inc. faces competition from 38 companies in its sector, with the table listing the top 10 leaders by market capitalization:
| Competitor | Market Cap. |
|---|---|
| NVIDIA Corporation | 4.6T |
| Broadcom Inc. | 1.6T |
| Taiwan Semiconductor Manufacturing Company Limited | 1.6T |
| ASML Holding N.V. | 415B |
| Advanced Micro Devices, Inc. | 363B |
| Micron Technology, Inc. | 353B |
| Lam Research Corporation | 232B |
| Applied Materials, Inc. | 214B |
| QUALCOMM Incorporated | 185B |
| Intel Corporation | 173B |
SkyWater Technology ranks 35th among 38 competitors, with a market cap just 0.03% of the leader, NVIDIA. The company sits well below the average market cap of the top 10 leaders (975B) and below the sector median (31B). It maintains a 16% market cap gap above its closest rival, highlighting a substantial scale difference.
Comparisons with competitors
Check out how we compare the company to its competitors:
Does SKYT have a competitive advantage?
SkyWater Technology, Inc. currently shows a slightly unfavorable competitive advantage, as its ROIC is significantly below WACC, indicating value destruction despite improving profitability. The company operates in the semiconductor sector with a niche focus on silicon-based analog, mixed-signal, and rad-hard integrated circuits.
Looking ahead, SkyWater’s expanding revenue, notably in the U.S. market, and its engineering collaboration model support growth opportunities. Its engagement across aerospace, defense, automotive, and bio-health sectors positions it to capture emerging semiconductor demand in specialized industries.
SWOT Analysis
This analysis identifies SkyWater Technology’s key internal and external factors shaping its strategic outlook.
Strengths
- Strong revenue growth of 29% in 2025
- Robust net margin at 27%
- High ROE of 63% indicating efficient equity use
Weaknesses
- Negative EBIT margin signals operational challenges
- Low current and quick ratios (0.6 and 0.52) raise liquidity concerns
- ROIC below WACC indicates value destruction
Opportunities
- Expanding semiconductor demand in aerospace and defense
- Growing US market presence with 420M revenue
- Potential to improve operational efficiency and profitability
Threats
- High beta (3.52) implies volatile stock price
- Intense competition in semiconductor manufacturing
- Rising operating expenses outpacing revenue growth
SkyWater shows strong top-line momentum and excellent equity returns but struggles with profitability and liquidity. Strategic focus must sharpen on operational efficiency and balance sheet stability to capitalize on growth sectors while mitigating financial risks.
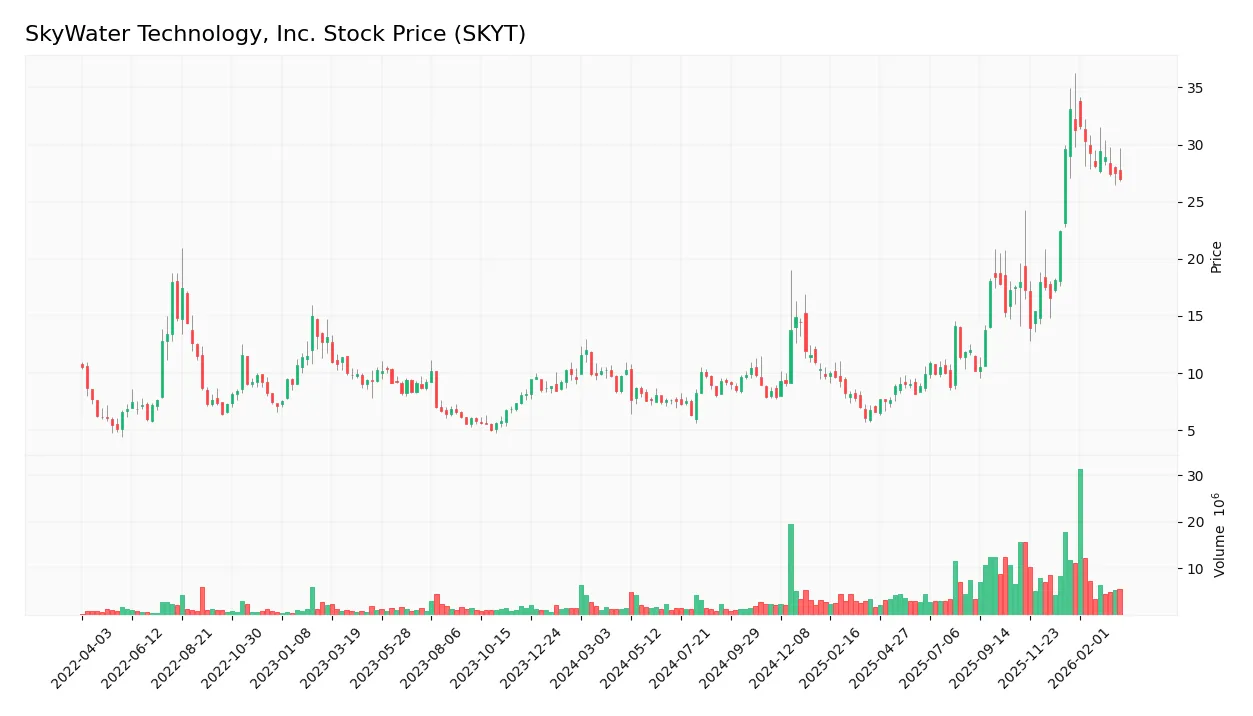
Stock Price Action Analysis
The following weekly chart illustrates SkyWater Technology, Inc. (SKYT) stock price movements over the past 12 months, highlighting key levels and volatility:
Trend Analysis
Over the past 12 months, SKYT price increased by 163.93%, indicating a strong bullish trend. The stock reached a high of 33.1 and a low of 6.1, with price acceleration slowing down recently. The 7.0 standard deviation signals heightened volatility during this period.
Volume Analysis
In the last three months, SKYT shows slightly buyer-dominant activity with 59.78% buyer volume. Trading volume is increasing, suggesting growing investor participation and cautious optimism despite recent price declines.
Target Prices
Analysts unanimously set a clear target price consensus for SkyWater Technology, Inc. (SKYT).
| Target Low | Target High | Consensus |
|---|---|---|
| 35 | 35 | 35 |
The consistent target price of $35 reflects strong analyst conviction, indicating stable expectations for the stock’s near-term value.

Don’t Let Luck Decide Your Entry Point
Optimize your entry points with our advanced ProRealTime indicators. You’ll get efficient buy signals with precise price targets for maximum performance. Start outperforming now!
Analyst & Consumer Opinions
This section reviews analyst ratings and consumer feedback to provide a balanced perspective on SkyWater Technology, Inc.
Stock Grades
Here are the latest verified analyst grades for SkyWater Technology, Inc., reflecting recent changes in sentiment:
| Grading Company | Action | New Grade | Date |
|---|---|---|---|
| Needham | Downgrade | Hold | 2026-01-27 |
| TD Cowen | Downgrade | Hold | 2026-01-27 |
| Piper Sandler | Downgrade | Neutral | 2026-01-27 |
| TD Cowen | Maintain | Buy | 2025-11-06 |
| Needham | Maintain | Buy | 2025-11-06 |
| Piper Sandler | Maintain | Overweight | 2025-11-06 |
The consensus has shifted to a Hold rating after multiple downgrades in early 2026, indicating more cautious analyst outlooks compared to the prior Buy and Overweight stances. This suggests a tempering of enthusiasm in the near term.
Consumer Opinions
SkyWater Technology, Inc. evokes mixed feelings among its users, reflecting both admiration for innovation and concerns about service consistency.
| Positive Reviews | Negative Reviews |
|---|---|
| “Impressive product quality and cutting-edge tech.” | “Customer support response times are slow.” |
| “Reliable performance in high-demand applications.” | “Pricing feels steep for small businesses.” |
| “Strong commitment to sustainable practices.” | “Occasional delays in order fulfillment.” |
Overall, consumers praise SkyWater’s advanced technology and reliability. However, they frequently note challenges with customer service speed and pricing, which could impact long-term loyalty.
Risk Analysis
Below is a summary table of key risks facing SkyWater Technology, Inc. as of 2026:
| Category | Description | Probability | Impact |
|---|---|---|---|
| Financial Health | Low current and quick ratios (0.6, 0.52) indicate liquidity risk. | High | High |
| Profitability | Negative ROIC (-0.19%) vs high WACC (18.24%) signals value destruction. | High | High |
| Leverage | Elevated debt-to-equity ratio (1.33) and negative interest coverage (-0.09) pose solvency concerns. | Medium | High |
| Market Volatility | High beta (3.52) suggests significant stock price swings versus market. | High | Medium |
| Valuation | Unfavorable price-to-book (4.73) may reflect overvaluation risk. | Medium | Medium |
| Credit Risk | Altman Z-Score in grey zone (2.32) implies moderate bankruptcy risk. | Medium | High |
| Operational | Weak Piotroski score (3) signals poor financial strength and operational inefficiencies. | Medium | Medium |
The most pressing risks are liquidity shortfalls and capital inefficiency. SkyWater’s current ratio well below 1 signals potential difficulties meeting short-term obligations. Negative ROIC against a steep WACC confirms the company struggles to generate returns above its cost of capital. Combined with high leverage and negative interest coverage, solvency is a genuine threat. The stock’s high beta amplifies downside risk in volatile markets. These factors warrant a cautious stance despite a strong net margin and ROE.
Should You Buy SkyWater Technology, Inc.?
SkyWater Technology, Inc. appears to be in a grey zone with moderate profitability and a slightly unfavorable moat, reflecting value destruction despite improving returns. Supported by a substantial leverage profile, its overall B+ rating suggests cautious analytical interpretation.
Strength & Efficiency Pillars
SkyWater Technology, Inc. posts a strong net margin of 26.9% and a robust return on equity at 63.31%, signaling solid profitability. However, its return on invested capital (ROIC) stands at -0.19%, trailing the weighted average cost of capital (WACC) at 18.24%. This indicates the company is currently destroying value despite improving profitability. The gross margin near 20% further reflects operational resilience amid mixed capital efficiency signals.
Weaknesses and Drawbacks
The company resides in the Altman Z-Score grey zone at 2.32, indicating moderate bankruptcy risk and financial caution. Leverage metrics are concerning: a debt-to-equity ratio of 1.33 and a low current ratio of 0.6 suggest tight liquidity and elevated financial risk. The price-to-book ratio at 4.73 signals overvaluation against book value, while unfavorable interest coverage (-0.09) highlights challenges servicing debt. These factors collectively pressure the company’s risk profile.
Our Final Verdict about SkyWater Technology, Inc.
SkyWater Technology, Inc. presents a mixed fundamental profile. Despite strong profitability and a bullish long-term stock trend, moderate solvency risk and elevated leverage caution investors. The company’s recent slight buyer dominance supports potential upside, yet liquidity constraints and value destruction advise prudence. This profile might appear intriguing for risk-tolerant investors but suggests a wait-and-see approach for conservative capital.
Disclaimer: This content is for informational purposes only and does not constitute financial, investment, or other professional advice. Investing in financial markets involves a significant risk of loss, and past performance is not indicative of future results.
Additional Resources
- Investors heavily search SkyWater Technology, Inc. (SKYT): Here is what you need to know – MSN (Mar 27, 2026)
- SkyWater Technology, Inc. (SKYT) Stock Slides as Market Rises: Facts to Know Before You Trade – Yahoo Finance (Mar 25, 2026)
- Investors Are Actively Looking Into SkyWater Technology, Inc. (SKYT): What You Should Be Aware Of – Bitget (Mar 27, 2026)
- SkyWater Technology Shows Strong Revenue Gains, But Profitability Remains Weak – Seeking Alpha (Mar 24, 2026)
- SkyWater (NASDAQ: SKYT) approves cash retention plan tied to IonQ deal – Stock Titan (Mar 26, 2026)
For more information about SkyWater Technology, Inc., please visit the official website: skywatertechnology.com