Home > Analyses > Real Estate > Simon Property Group, Inc.
Simon Property Group transforms everyday retail experiences by owning premier shopping, dining, and entertainment destinations. As a dominant REIT in retail real estate, it sets the standard for innovation and quality across North America, Europe, and Asia. Millions gather daily at its properties, driving billions in annual sales. The key question: does Simon’s robust market presence and strong fundamentals still justify its premium valuation and future growth prospects?

Table of contents
Business Model & Company Overview
Simon Property Group, Inc. is a premier real estate investment trust headquartered in Indianapolis, founded in 1993. It dominates the retail REIT sector through a cohesive ecosystem of shopping, dining, entertainment, and mixed-use destinations. As an S&P 100 company, it operates 2,600 employees and serves millions daily across its properties. This strong market position underpins its status as a cornerstone in retail real estate.
The company’s revenue engine balances leasing income from retail tenants with strategic global reach in North America, Europe, and Asia. Its properties generate billions in annual sales by attracting diverse consumer foot traffic. Simon’s economic moat lies in its unmatched scale and premium locations, shaping the future of community gathering and retail experience worldwide.
Financial Performance & Fundamental Metrics
I analyze Simon Property Group, Inc.’s income statement, key financial ratios, and dividend payout policy to assess its core financial health and shareholder value.
Income Statement
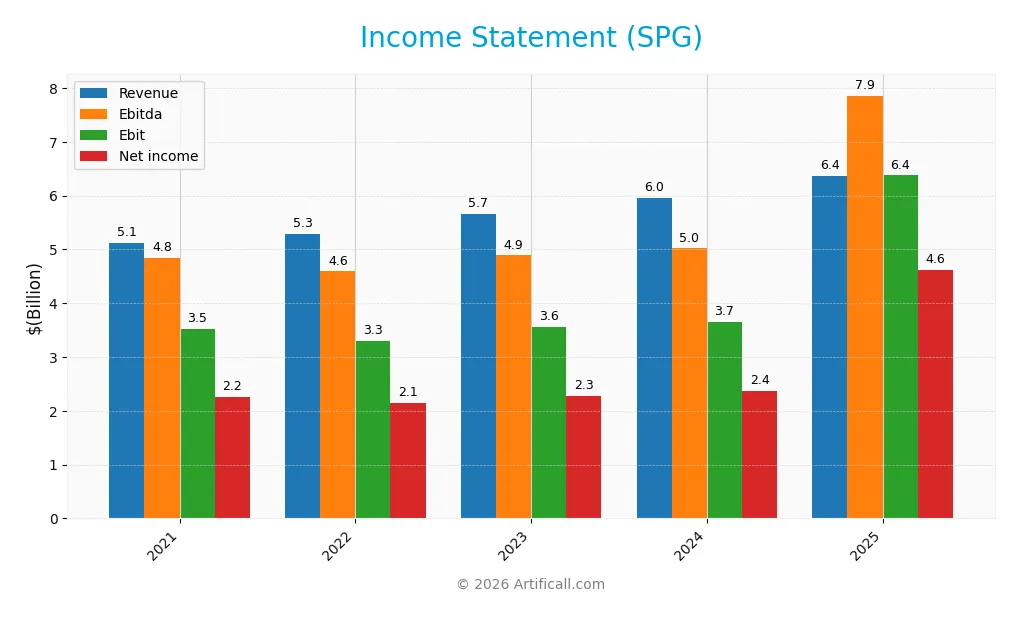
The table below presents Simon Property Group, Inc.’s key income statement figures for fiscal years 2021 through 2025, reflecting revenue, expenses, and profitability trends.
| 2021 | 2022 | 2023 | 2024 | 2025 | |
|---|---|---|---|---|---|
| Revenue | 5.12B | 5.29B | 5.66B | 5.96B | 6.36B |
| Cost of Revenue | 971M | 1.00B | 1.03B | 1.04B | 909M |
| Operating Expenses | 1.73B | 1.71B | 1.82B | 1.83B | 2.28B |
| Gross Profit | 4.15B | 4.29B | 4.63B | 4.92B | 5.46B |
| EBITDA | 4.85B | 4.59B | 4.89B | 5.02B | 7.86B |
| EBIT | 3.52B | 3.30B | 3.55B | 3.66B | 6.37B |
| Interest Expense | 796M | 761M | 855M | 906M | 975M |
| Net Income | 2.25B | 2.14B | 2.28B | 2.37B | 4.61B |
| EPS | 6.84 | 6.52 | 6.97 | 7.26 | 14.14 |
| Filing Date | 2022-02-24 | 2023-02-23 | 2024-02-22 | 2025-02-21 | 2026-02-25 |
Income Statement Evolution
From 2021 to 2025, Simon Property Group’s revenue rose 24.4% overall, with a 6.7% increase in the last year, reflecting steady top-line growth. Net income more than doubled, up 105%, driven by expanding net margins, which improved 65% over the period. Gross margin remained strong and favorable, while operating expenses grew at the same pace as revenue, a slight headwind.
Is the Income Statement Favorable?
In 2025, fundamentals appear favorable. Gross margin stood at an impressive 85.7%, and EBIT margin exceeded 100%, signaling operational efficiency. Net margin rose to 72.5%, supported by a 74% surge in EBIT and a near doubling of EPS to $14.14. However, interest expense at 15.3% of revenue is a notable weakness, tempering the otherwise strong income profile.
Financial Ratios
The table below presents key financial ratios for Simon Property Group, Inc. (SPG) over the fiscal years 2021 to 2025:
| Ratios | 2021 | 2022 | 2023 | 2024 | 2025 |
|---|---|---|---|---|---|
| Net Margin | 44% | 40% | 40% | 40% | 73% |
| ROE | 67% | 68% | 76% | 81% | 89% |
| ROIC | 7% | 8% | 9% | 11% | -115841% |
| P/E | 23.3 | 18.0 | 20.4 | 23.7 | 13.1 |
| P/B | 15.6 | 12.3 | 15.4 | 19.1 | 11.6 |
| Current Ratio | 0.67 | 0.66 | 1.04 | 0.83 | 0 |
| Quick Ratio | 0.67 | 0.66 | 1.04 | 0.83 | 0 |
| D/E | 7.68 | 8.11 | 8.77 | 8.42 | 5.75 |
| Debt-to-Assets | 76% | 77% | 77% | 76% | 74% |
| Interest Coverage | 3.03 | 3.39 | 3.28 | 3.41 | 3.26 |
| Asset Turnover | 0.15 | 0.16 | 0.17 | 0.18 | 0.16 |
| Fixed Asset Turnover | 10.1 | 10.6 | 11.7 | 11.5 | 8.4 |
| Dividend Yield | 4.48% | 5.88% | 5.23% | 4.71% | 4.62% |
Evolution of Financial Ratios
Simon Property Group’s Return on Equity (ROE) improved significantly to 88.6% in 2025, showing strong profitability growth. The Current Ratio, however, fell to zero, indicating liquidity concerns. Debt-to-Equity Ratio remained high at 5.75, reflecting sustained leverage. Overall, profitability metrics advanced while liquidity and leverage trends raised caution.
Are the Financial Ratios Favorable?
Profitability measures such as net margin (72.5%) and ROE (88.6%) are favorable, signaling strong earnings efficiency. Liquidity ratios, including current and quick ratios at zero, are unfavorable, exposing cash flow risks. Leverage is elevated with a debt-to-equity ratio of 5.75 and debt-to-assets at 73.7%. Market valuation ratios show mixed signals, resulting in a neutral overall assessment.
Shareholder Return Policy
Simon Property Group, Inc. maintains a dividend payout ratio around 60%, with dividends per share rising steadily to $8.55 in 2025. The company supports dividends with strong free cash flow coverage and a 4.6% yield, complemented by share buybacks.
This balanced approach aligns with sustainable shareholder value creation, though the high payout ratio requires monitoring for potential risks. The combination of dividends and buybacks reflects prudent capital allocation amid market cycles.
Score analysis
The following radar chart illustrates key financial scores that characterize the company’s valuation and profitability metrics:
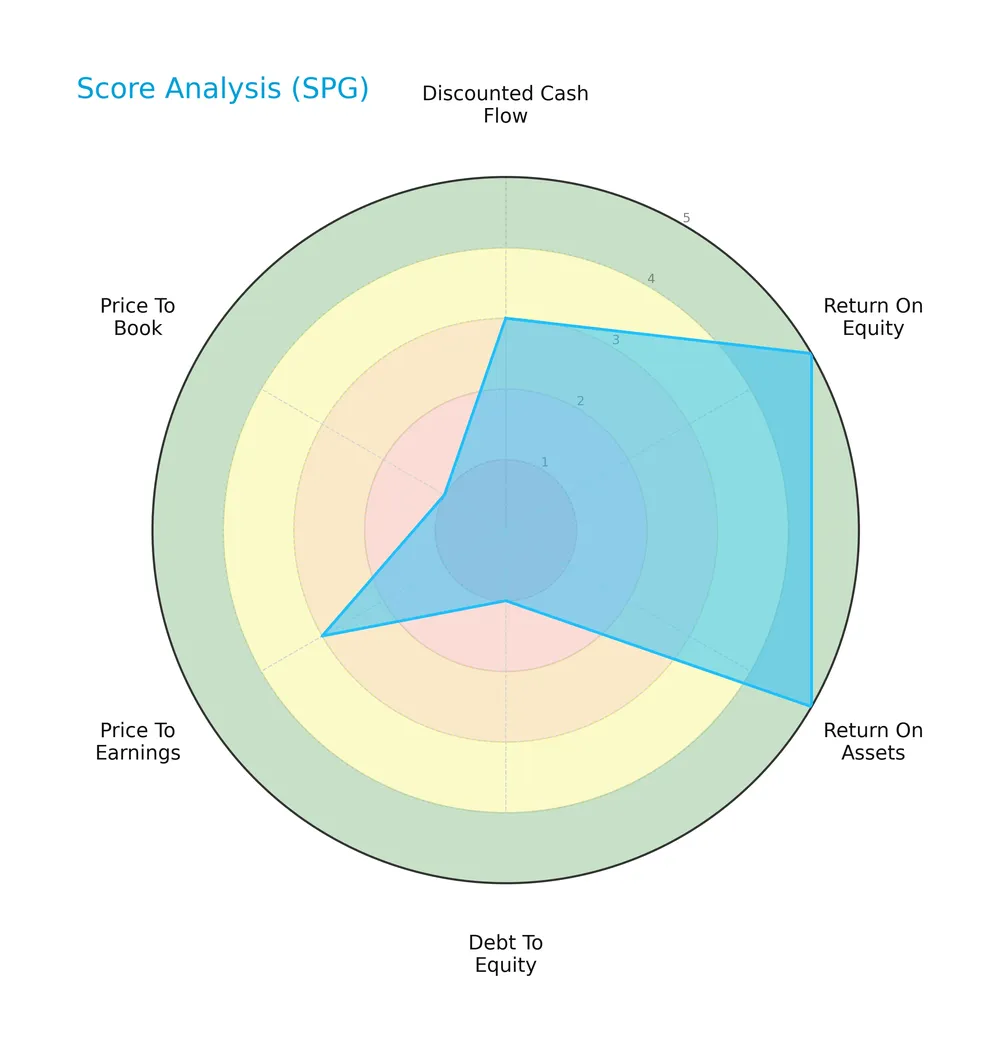
Simon Property Group shows strong returns on equity and assets, scoring very favorably at 5 in both. However, its debt-to-equity ratio and price-to-book valuations are very unfavorable, marked at 1. Other metrics like discounted cash flow and price-to-earnings remain moderate at 3.
Analysis of the company’s bankruptcy risk
The Altman Z-Score indicates Simon Property Group is currently in the distress zone, suggesting elevated bankruptcy risk:

Is the company in good financial health?
The Piotroski Score diagram below reflects the company’s financial strength based on nine fundamental criteria:

With a Piotroski Score of 6, Simon Property Group stands at an average level of financial health, implying moderate operational efficiency and profitability but room for improvement in financial robustness.
Competitive Landscape & Sector Positioning
This section examines Simon Property Group’s strategic positioning, revenue segments, and key products in the retail REIT sector. I will evaluate whether Simon Property Group holds a competitive advantage versus its main competitors.
Strategic Positioning
Simon Property Group concentrates its revenue in the real estate retail segment, generating $6B in 2025, and maintains a stable geographic presence with consistent European revenues around $1.2B-$1.6B annually, reflecting focused product and regional exposure.
Revenue by Segment
The pie chart illustrates Simon Property Group’s revenue distribution by segment for fiscal years 2024 and 2025, highlighting the dominant contribution of its real estate business.
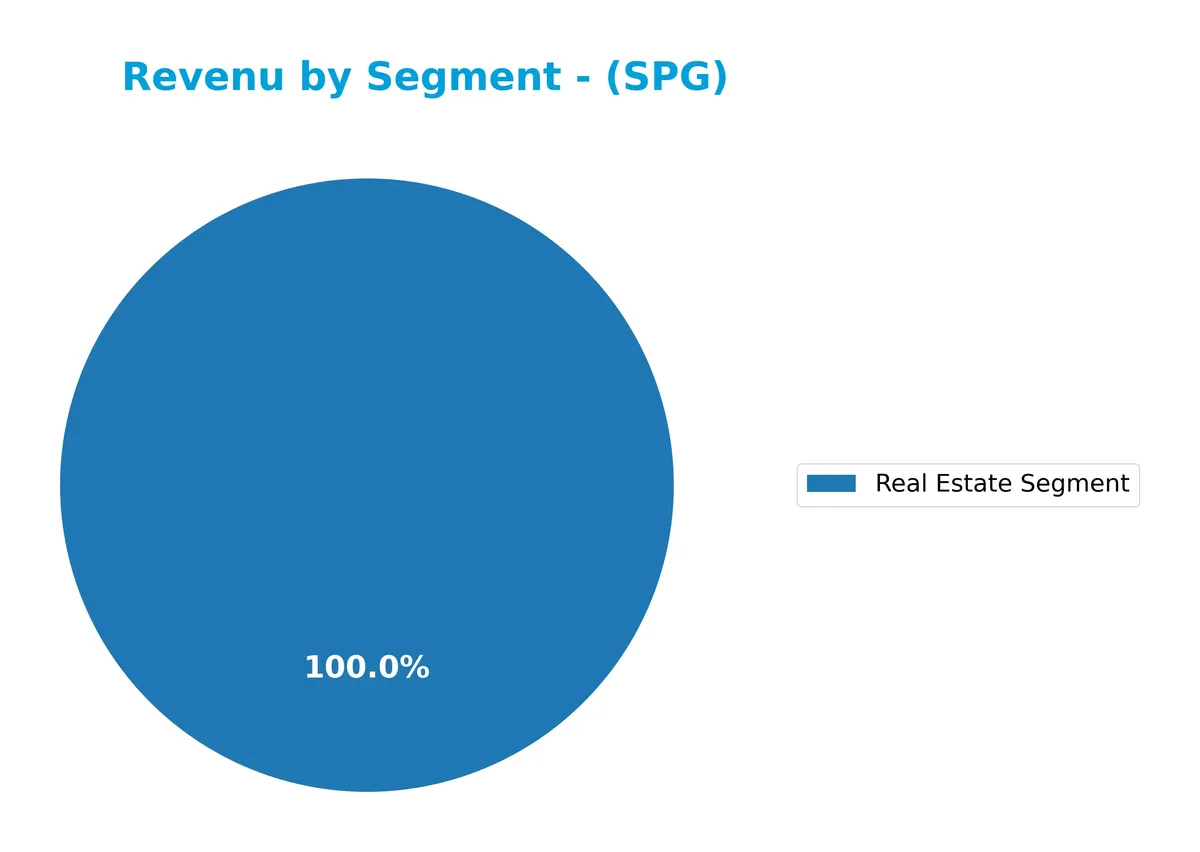
Simon Property Group’s revenue is overwhelmingly driven by its Real Estate Segment, which grew from 5.54B in 2024 to 6.02B in 2025. This steady increase underscores the company’s strong operational focus and resilience in property management. No other segments appear, signaling a concentrated business model reliant on real estate performance, which investors should monitor for sector-specific risks.
Key Products & Brands
Simon Property Group generates revenue mainly through ownership of premier retail real estate properties, including shopping, dining, and entertainment destinations:
| Product | Description |
|---|---|
| Real Estate Segment | Ownership and operation of shopping malls, dining venues, entertainment complexes, and mixed-use destinations across North America, Europe, and Asia. |
Simon Property Group’s core business revolves around retail real estate assets that serve as community hubs. This segment consistently drives multibillion-dollar revenues, reflecting the company’s focus on experiential retail environments.
Main Competitors
The sector includes 5 competitors, with the table below listing the top 5 leaders by market capitalization:
| Competitor | Market Cap. |
|---|---|
| Simon Property Group, Inc. | 60B |
| Realty Income Corporation | 53B |
| Kimco Realty Corporation | 13.6B |
| Regency Centers Corporation | 12.3B |
| Federal Realty Investment Trust | 8.5B |
Simon Property Group ranks 1st among its competitors with a market cap 9.25% above the next largest player. It stands well above both the average market cap of the top 10 competitors (29.4B) and the sector median (13.6B). The company maintains a substantial 24.5% lead over its closest rival, underscoring its dominant position in the REIT – Retail industry.
Comparisons with competitors
Check out how we compare the company to its competitors:
Does SPG have a competitive advantage?
Simon Property Group, Inc. currently lacks a competitive advantage, as its ROIC falls significantly below its WACC, indicating value destruction and declining profitability. This unfavorable trend signals inefficient capital use and weakening economic moat over the 2021-2025 period.
Looking ahead, SPG’s extensive portfolio across North America, Europe, and Asia provides opportunities to leverage premier retail and mixed-use properties. Expansion into new markets or innovative property developments could influence future competitive positioning despite current challenges.
SWOT Analysis
This SWOT analysis highlights Simon Property Group’s internal capabilities and external market conditions to guide strategic decisions.
Strengths
- Strong net margin at 72.5%
- Leading market position as an S&P 100 REIT
- Robust dividend yield of 4.62%
Weaknesses
- High debt-to-equity ratio at 5.75
- Negative ROIC indicating value destruction
- Low liquidity ratios signaling financial stress
Opportunities
- Expansion in international markets, especially Europe
- Growth in mixed-use development trends
- Rising demand for experiential retail spaces
Threats
- Rising interest expenses at 15.3% of revenue
- Retail sector disruption from e-commerce
- Economic downturns impacting retail foot traffic
Simon Property Group boasts solid profitability and market dominance but faces significant leverage and liquidity risks. The company must address financial vulnerabilities while capitalizing on global retail evolution to sustain growth.
Stock Price Action Analysis
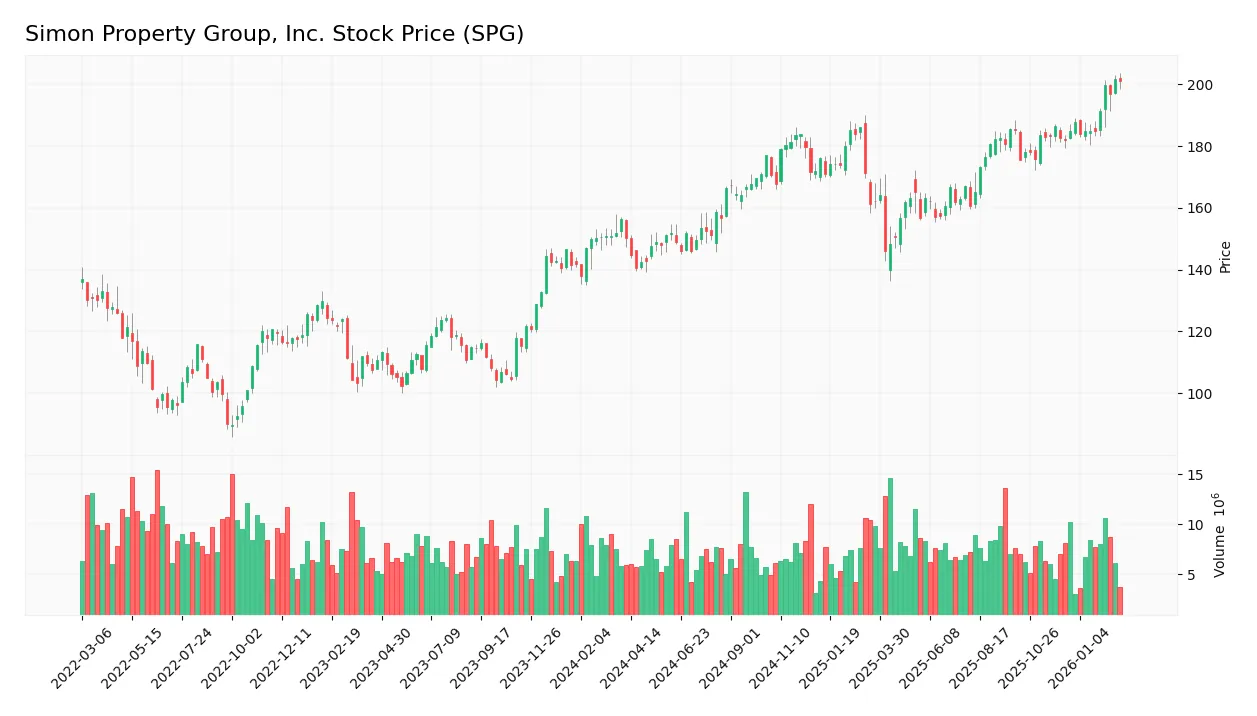
The weekly stock chart of Simon Property Group, Inc. (SPG) illustrates the price trajectory and key fluctuations over the past 12 months:
Trend Analysis
Over the past 12 months, SPG’s stock price rose by 33.86%, signaling a bullish trend with clear acceleration. The price moved between a low of 140.44 and a high of 201.7, with significant volatility marked by a 14.65 standard deviation. Recent three-month growth of 10.42% remains positive but shows a decelerated slope of 1.82.
Volume Analysis
Trading volume over the last three months is increasing, led by buyers who account for 62.62% of activity. Buyer-dominant volumes of 53M against sellers’ 32M suggest strong market participation and positive investor sentiment supporting the price uptrend.
Target Prices
Analysts set a clear target consensus for Simon Property Group, Inc., reflecting cautious optimism.
| Target Low | Target High | Consensus |
|---|---|---|
| 173 | 230 | 194.6 |
The target range spans from $173 to $230, with a consensus near $195, indicating moderate upside potential amid sector uncertainties.

Don’t Let Luck Decide Your Entry Point
Optimize your entry points with our advanced ProRealTime indicators. You’ll get efficient buy signals with precise price targets for maximum performance. Start outperforming now!
Analyst & Consumer Opinions
This section examines Simon Property Group, Inc.’s analyst ratings alongside consumer feedback to gauge market sentiment.
Stock Grades
Here is the latest summary of Simon Property Group, Inc. stock grades from established financial institutions:
| Grading Company | Action | New Grade | Date |
|---|---|---|---|
| JP Morgan | Maintain | Neutral | 2026-02-06 |
| Citigroup | Maintain | Neutral | 2026-02-05 |
| Evercore ISI Group | Maintain | In Line | 2026-02-03 |
| Stifel | Maintain | Hold | 2026-02-03 |
| Piper Sandler | Maintain | Overweight | 2026-02-03 |
| Scotiabank | Maintain | Sector Perform | 2026-01-14 |
| UBS | Maintain | Neutral | 2026-01-08 |
| Truist Securities | Maintain | Hold | 2025-12-17 |
| Citigroup | Maintain | Neutral | 2025-11-26 |
| Barclays | Maintain | Equal Weight | 2025-11-18 |
The consensus leans toward a Hold rating with a balanced mix of Neutral and Hold grades, reflecting a cautious stance. Piper Sandler’s Overweight rating stands out as a relatively optimistic view amid prevailing market caution.
Consumer Opinions
Consumer sentiment about Simon Property Group, Inc. reflects a mix of appreciation for its property portfolio and concerns over customer service.
| Positive Reviews | Negative Reviews |
|---|---|
| “Well-maintained malls with a great variety of stores.” | “Parking availability is often frustrating during weekends.” |
| “Strong community events that enhance the shopping experience.” | “Some locations struggle with cleanliness and upkeep.” |
| “Convenient locations and good security presence.” | “High rents make smaller retailers less common.” |
Overall, consumers praise Simon Property Group’s strong locations and event programming. However, recurring issues include parking challenges and inconsistent facility maintenance.
Risk Analysis
Below is a summary of key risks Simon Property Group faces, categorized by likelihood and potential impact:
| Category | Description | Probability | Impact |
|---|---|---|---|
| Leverage Risk | Extremely high debt-to-equity ratio at 5.75 and 74% debt-to-assets | High | High |
| Liquidity Risk | Current and quick ratios at zero indicate poor short-term liquidity | High | High |
| Profitability Risk | Negative ROIC (-115,841%) despite strong net margin and ROE | Moderate | Moderate |
| Market Volatility | Beta of 1.396 shows above-market price sensitivity | Moderate | Moderate |
| Bankruptcy Risk | Altman Z-Score at 1.66 places company in distress zone | Moderate | High |
| Valuation Risk | High price-to-book ratio (11.59) signals potential overvaluation | Moderate | Moderate |
The most pressing risks are Simon’s excessive leverage and liquidity issues, which historically increase vulnerability during economic downturns. The distress zone Altman Z-Score reinforces bankruptcy concerns. While profitability metrics remain strong, the negative ROIC signals inefficient capital use. Investors must weigh these risks carefully against the stock’s 4.62% dividend yield and favorable ROE.
Should You Buy Simon Property Group, Inc.?
Simon Property Group appears to be navigating a challenging financial landscape with declining operational efficiency and a deteriorating competitive moat. Despite substantial leverage and distress-zone bankruptcy risk, the company shows robust profitability and earns a B+ rating, suggesting moderate investment appeal.
Strength & Efficiency Pillars
Simon Property Group, Inc. boasts impressive operational margins with a gross margin of 85.72% and net margin of 72.51%. Its return on equity reaches a robust 88.61%, underscoring effective shareholder value generation. The weighted average cost of capital stands at a reasonable 7.96%, but ROIC is deeply negative at -115,841%, signaling value destruction. Despite strong margins, this massive ROIC shortfall means the company is not a value creator.
Weaknesses and Drawbacks
The company is in financial distress, reflected by an Altman Z-Score of 1.66, below the 1.8 distress threshold, indicating a high bankruptcy risk. Leverage is excessive with a debt-to-equity ratio of 5.75 and a debt-to-assets ratio of 73.74%, raising solvency concerns. Liquidity is critically weak, as both current and quick ratios measure zero, signaling potential cash flow issues. Additionally, the price-to-book ratio at 11.59 is very unfavorable, suggesting the stock trades at a significant premium to book value.
Our Final Verdict about Simon Property Group, Inc.
Despite strong profitability metrics, Simon Property Group’s distressed solvency profile makes it highly speculative. The Altman Z-Score signals elevated bankruptcy risk that overshadows operational strengths. Investors seeking capital preservation may find this profile too risky. Caution is warranted until financial stability improves, regardless of recent bullish price trends and buyer dominance.
Disclaimer: This content is for informational purposes only and does not constitute financial, investment, or other professional advice. Investing in financial markets involves a significant risk of loss, and past performance is not indicative of future results.
Additional Resources
- Decoding Simon Property Group Inc (SPG): A Strategic SWOT Insigh – GuruFocus (Feb 26, 2026)
- Payden & Rygel Boosts Stock Position in Simon Property Group, Inc. $SPG – MarketBeat (Feb 23, 2026)
- How Investors May Respond To Simon Property Group (SPG) CEO’s Klépierre Exit And Boston Luxury Redevelopment – simplywall.st (Feb 23, 2026)
- Real Estate Stocks Rise: Realty Income (O) & Simon Property (SPG) Lead Last Week’s Winners – 24/7 Wall St. (Feb 23, 2026)
- Simon Property Group, Inc. (SPG) Achieves Record Real Estate Funds from Operations and Approves Quarterly Dividend – Yahoo Finance (Feb 09, 2026)
For more information about Simon Property Group, Inc., please visit the official website: simon.com