Home > Analyses > Technology > Silicon Laboratories Inc.
Silicon Laboratories Inc. powers the invisible connections behind the Internet of Things, embedding intelligence into everyday devices. Its analog-intensive mixed-signal chips drive innovation in smart homes, industrial automation, and medical technology. Known for cutting-edge wireless microcontrollers and sensors, Silicon Labs shapes critical sectors with precision and reliability. As the semiconductor landscape evolves rapidly, I question whether Silicon Labs’ strong market position and innovation pipeline still justify its current valuation and future growth prospects.
Table of contents
Business Model & Company Overview
Silicon Laboratories Inc., founded in 1996 and based in Austin, Texas, dominates the semiconductors sector with a focus on analog-intensive mixed-signal solutions. Its ecosystem centers on wireless microcontrollers and sensors that power IoT applications, from smart homes to industrial automation. This cohesive portfolio drives innovation across connected devices, embedding the company deeply in next-generation electronics.
The company’s revenue engine blends hardware with embedded software, delivering value through diverse IoT markets in the Americas, Europe, and Asia. It leverages a direct sales force and distributor network to scale globally. Silicon Labs’ competitive advantage lies in its specialized technology and broad application reach, forming a durable economic moat that shapes the semiconductor industry’s future.
Financial Performance & Fundamental Metrics
I analyze Silicon Laboratories Inc.’s income statement, key financial ratios, and dividend payout policy to assess its core financial health and shareholder returns.
Income Statement
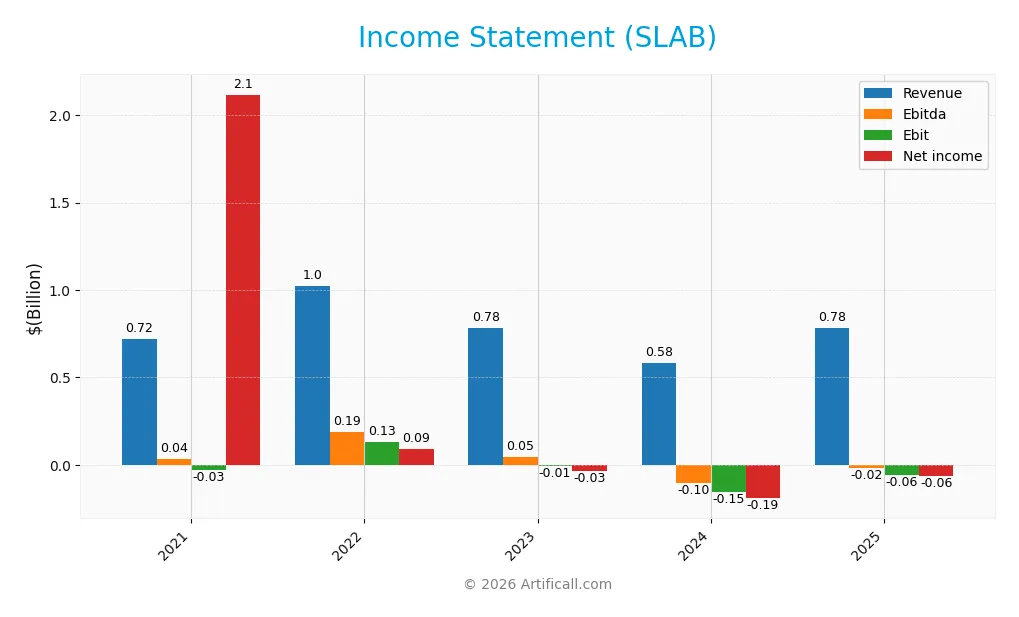
The table below presents Silicon Laboratories Inc.’s key income statement figures for fiscal years 2021 through 2025, showing revenue, costs, profits, and earnings per share.
| 2021 | 2022 | 2023 | 2024 | 2025 | |
|---|---|---|---|---|---|
| Revenue | 721M | 1.02B | 782M | 584M | 785M |
| Cost of Revenue | 295M | 382M | 322M | 272M | 328M |
| Operating Expenses | 458M | 523M | 485M | 478M | 528M |
| Gross Profit | 425M | 643M | 461M | 312M | 457M |
| EBITDA | 35M | 190M | 46M | -105M | -19M |
| EBIT | -27M | 133M | -5M | -154M | -57M |
| Interest Expense | 31M | 7M | 6M | 1M | 1M |
| Net Income | 2.12B | 91M | -35M | -191M | -65M |
| EPS | 49.44 | 2.61 | -1.09 | -5.93 | -1.98 |
| Filing Date | 2022-02-02 | 2023-02-01 | 2024-02-20 | 2025-02-04 | 2026-02-10 |
Income Statement Evolution
Silicon Laboratories’ revenue showed favorable growth, rising 34% in the latest year to $785M after a dip in 2024. Gross profit also improved sharply by 46%, lifting the gross margin to a solid 58.2%. However, net income remained negative at -$65M despite a 75% margin recovery, reflecting ongoing challenges controlling costs beyond gross profit.
Is the Income Statement Favorable?
In 2025, SLAB’s fundamentals show improvement but remain mixed. Operating expenses scaled with revenue, supporting a 63% EBIT growth though EBIT margin stayed negative at -7.3%. Interest expense is minimal at 0.12%, which helps. The net margin is still negative at -8.3%, but the overall income statement is deemed favorable, given strong top-line and gross profit momentum.
Financial Ratios
The following table summarizes key financial ratios for Silicon Laboratories Inc. (SLAB) over the last four fiscal years:
| Ratios | 2022 | 2023 | 2024 | 2025 |
|---|---|---|---|---|
| Net Margin | 9% | -4% | -33% | -8% |
| ROE | 7% | -3% | -18% | -6% |
| ROIC | 4% | -2% | -15% | -6% |
| P/E | 52 | -122 | -22 | -67 |
| P/B | 3.39 | 3.48 | 3.81 | 3.94 |
| Current Ratio | 7.87 | 4.51 | 6.15 | 4.69 |
| Quick Ratio | 7.33 | 3.32 | 5.07 | 4.02 |
| D/E | 0.39 | 0.05 | 0.01 | 0.00 |
| Debt-to-Assets | 25% | 4% | 1% | 0% |
| Interest Coverage | 18 | -4 | -126 | -72 |
| Asset Turnover | 0.47 | 0.54 | 0.48 | 0.62 |
| Fixed Asset Turnover | 6.74 | 5.36 | 4.42 | 6.10 |
| Dividend Yield | 0% | 0% | 0% | 0% |
Evolution of Financial Ratios
From 2021 to 2025, Silicon Laboratories’ Return on Equity (ROE) declined sharply, turning negative by 2023 and remaining unfavorable at -5.93% in 2025. The Current Ratio showed volatility, peaking above 7 in 2022, then dropping to 4.69 in 2025, indicating reduced but still strong liquidity. Debt-to-Equity remained at zero in 2025, reflecting minimal leverage and stability in capital structure.
Are the Financial Ratios Fovorable?
In 2025, profitability ratios like net margin (-8.27%) and ROE (-5.93%) are unfavorable, signaling ongoing earnings challenges. Liquidity metrics show mixed signals: a high current ratio (4.69) is unfavorable due to excess assets, but the quick ratio (4.02) is favorable, indicating liquid assets coverage. Leverage ratios are favorable with zero debt. Efficiency is neutral (asset turnover 0.62), and market valuation metrics such as price-to-book (3.94) are unfavorable. Overall, 57% of ratios are unfavorable, indicating financial stress.
Shareholder Return Policy
Silicon Laboratories Inc. does not pay dividends, reflecting its negative net income and focus on reinvestment. The company maintains strong liquidity and engages in share buybacks, supporting capital return despite withholding dividends.
This strategy aligns with a growth phase prioritizing R&D and acquisitions. While buybacks provide shareholder value, the absence of dividends and ongoing losses suggest cautious monitoring for sustainable long-term value creation.
Score analysis
Here is a radar chart illustrating Silicon Laboratories Inc.’s key financial scores across multiple valuation and performance metrics:
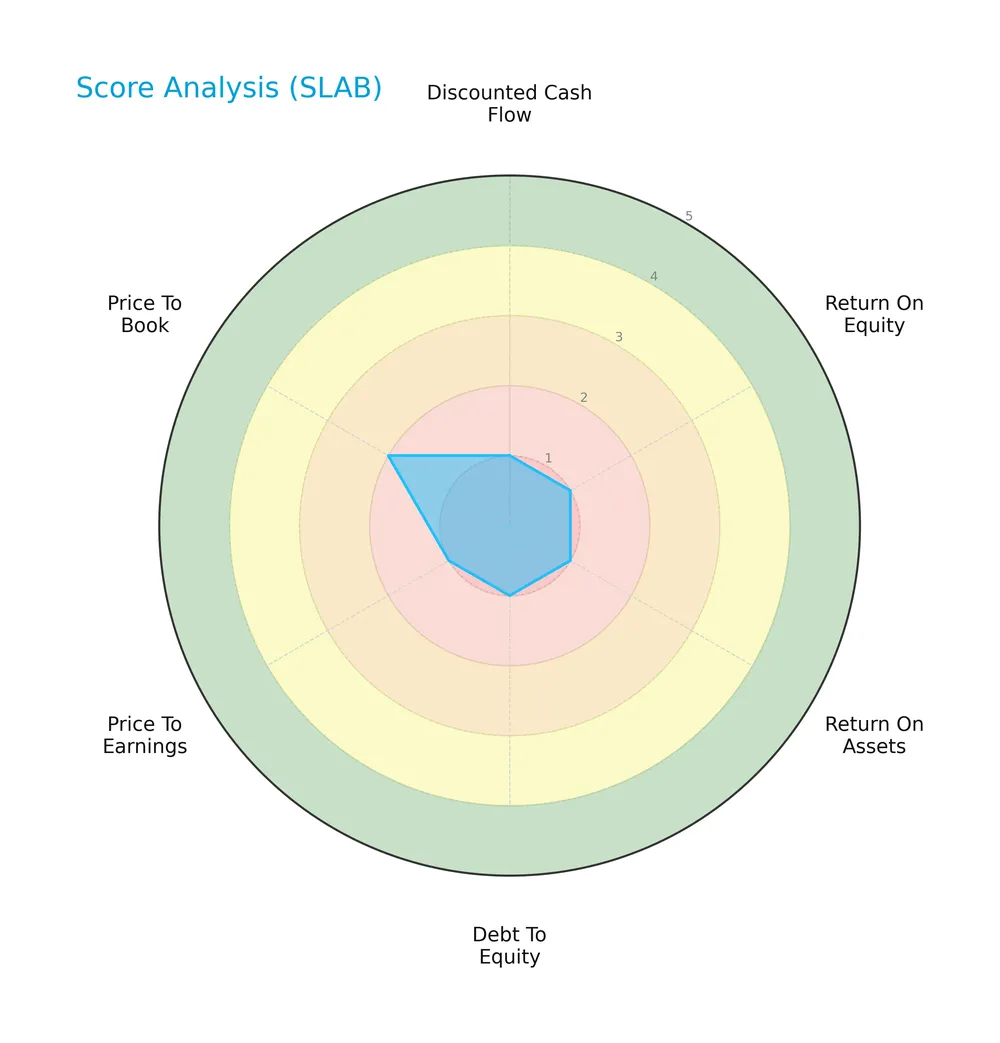
The company scores very low in discounted cash flow, ROE, ROA, debt to equity, and price to earnings, all rated as very unfavorable. Price to book is slightly better but still unfavorable, indicating broadly weak valuation and profitability metrics.
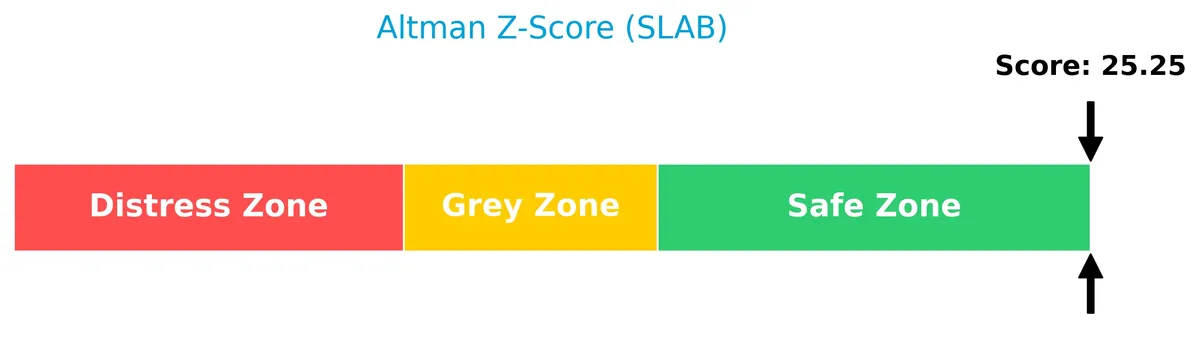
Analysis of the company’s bankruptcy risk
Silicon Laboratories Inc. displays an Altman Z-Score well within the safe zone, indicating a very low risk of bankruptcy at this time:
Is the company in good financial health?
The Piotroski Score diagram shows an average financial health rating, reflecting a moderate but not strong financial condition:
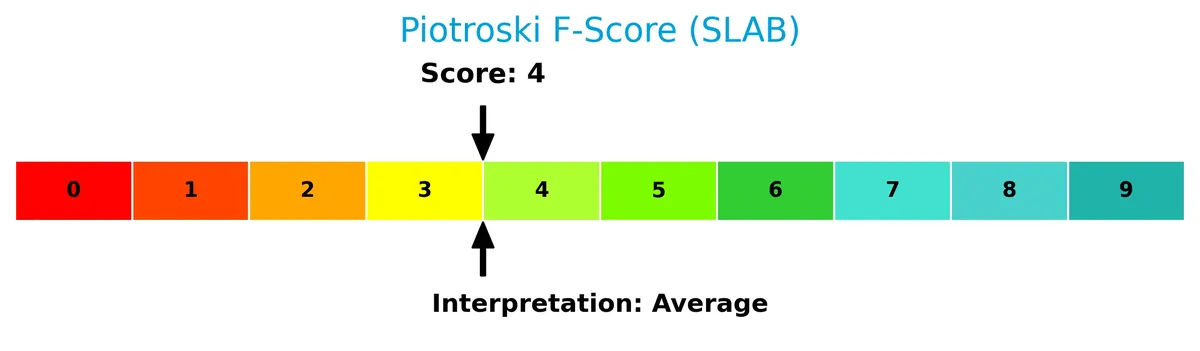
With a Piotroski Score of 4, the company neither stands out for strong financial robustness nor signals severe weakness, suggesting a middling position in terms of financial strength.
Competitive Landscape & Sector Positioning
This sector analysis examines Silicon Laboratories Inc.’s strategic positioning, revenue segments, key products, and main competitors. I will assess whether Silicon Laboratories holds a competitive advantage within the semiconductors industry.
Strategic Positioning
Silicon Laboratories Inc. concentrates its portfolio on analog-intensive mixed-signal semiconductors, focusing on Industrial & Commercial applications. Its geographic exposure spans the US, China, Taiwan, and the rest of the world, reflecting a balanced but technology-driven global footprint.
Revenue by Segment
This pie chart illustrates Silicon Laboratories Inc.’s revenue breakdown by product segment for the fiscal year 2024, highlighting the distribution of sales across its business units.
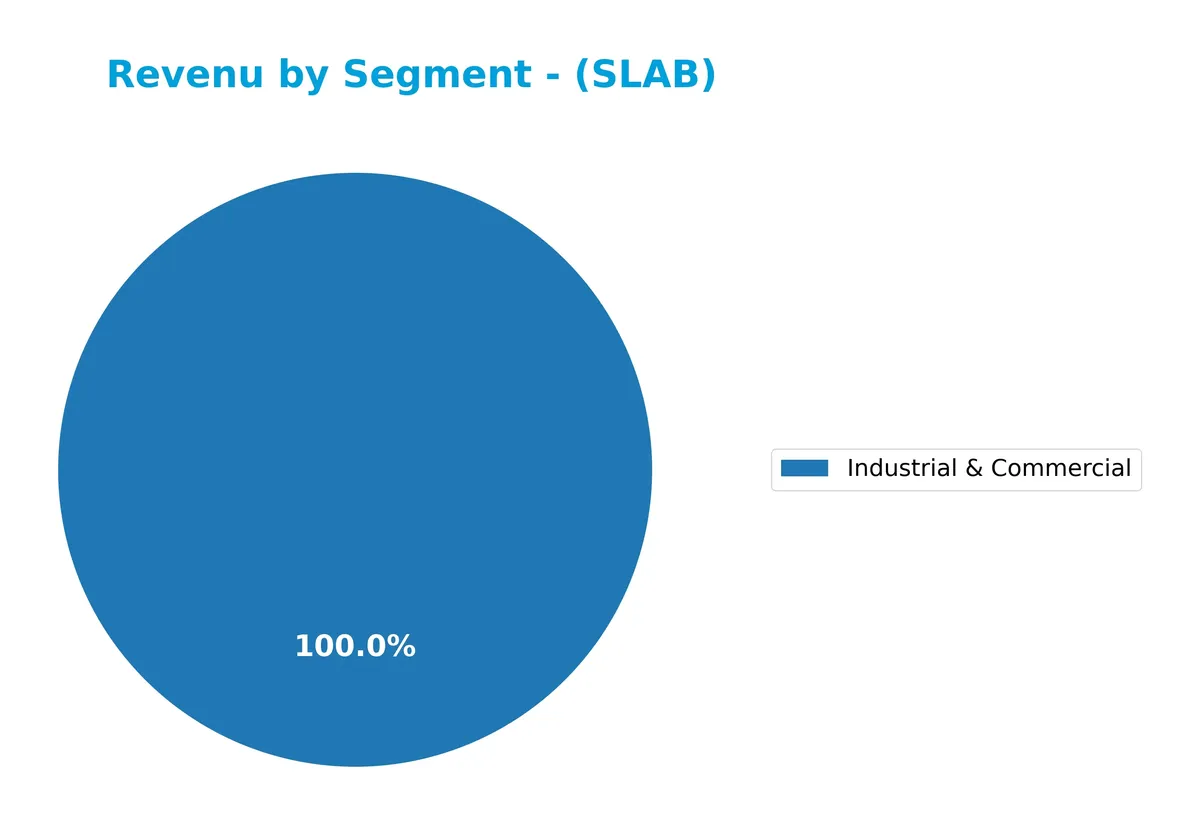
In 2024, the “Industrial & Commercial” segment generated $339M, representing the company’s sole reported segment revenue. Historically, Silicon Labs’ revenue was more diversified, including IoT, Infrastructure, and Broadcast segments. The recent concentration in Industrial & Commercial signals a strategic shift or potential risk from reliance on a single segment. The decline from $574M in 2022 to $339M in 2024 reflects a notable slowdown, warranting close monitoring of segment revival or diversification efforts.
Key Products & Brands
The table below outlines Silicon Laboratories Inc.’s primary products and brands, detailing their applications and market focus:
| Product | Description |
|---|---|
| Wireless Microcontrollers | Analog-intensive mixed-signal solutions powering IoT applications like connected homes and security. |
| Sensor Products | Sensors integrated into industrial automation, smart metering, lighting, and medical instrumentation. |
| Industrial & Commercial | Semiconductor solutions serving industrial automation, commercial building automation, and control. |
Silicon Laboratories focuses on mixed-signal semiconductors, emphasizing wireless microcontrollers and sensors. Its Industrial & Commercial segment targets automation and control sectors, reflecting broad IoT market applications.
Main Competitors
Silicon Laboratories Inc. faces competition from 38 companies in its sector; the table below lists the top 10 leaders by market capitalization:
| Competitor | Market Cap. |
|---|---|
| NVIDIA Corporation | 4.6T |
| Broadcom Inc. | 1.6T |
| Taiwan Semiconductor Manufacturing Company Limited | 1.6T |
| ASML Holding N.V. | 415B |
| Advanced Micro Devices, Inc. | 363B |
| Micron Technology, Inc. | 353B |
| Lam Research Corporation | 232B |
| Applied Materials, Inc. | 214B |
| QUALCOMM Incorporated | 185B |
| Intel Corporation | 173B |
Silicon Laboratories Inc. ranks 31st among 38 competitors, with a market cap just 0.15% of the sector leader NVIDIA. It sits well below both the top 10 average of 975B and the sector median of 31B. The company trails its nearest competitor by approximately 11%, indicating a notable gap in scale and market presence.
Comparisons with competitors
Check out how we compare the company to its competitors:
Does SLAB have a competitive advantage?
Silicon Laboratories Inc. currently lacks a competitive advantage, as its ROIC falls significantly below WACC, indicating value destruction and declining profitability over 2021-2025. Despite a favorable gross margin of 58.2%, the company posts negative EBIT and net margins, reflecting ongoing operational challenges.
Looking ahead, SLAB’s revenue growth of 34.3% in 2025 and expanding product applications in IoT, industrial automation, and medical instrumentation present opportunities. However, negative profitability trends and value erosion remain key risks for future market positioning.
SWOT Analysis
This analysis highlights Silicon Laboratories Inc.’s key internal and external factors affecting its strategic positioning.
Strengths
- strong revenue growth of 34% in 2025
- robust gross margin at 58.2%
- zero debt enhances financial flexibility
Weaknesses
- negative net margin at -8.3%
- declining ROIC well below WACC (-17.3%)
- unfavorable overall profitability metrics
Opportunities
- expanding IoT market demand
- growth potential in industrial automation
- geographic diversification in Asia and rest of world
Threats
- intense semiconductor industry competition
- exposure to China market fluctuations
- tech innovation pace risks
Silicon Laboratories shows strong top-line growth and operational efficiency but struggles with profitability and value creation. The company must leverage IoT trends while improving capital allocation and cost control to sustain competitiveness.
Stock Price Action Analysis
The following weekly stock chart highlights Silicon Laboratories Inc.’s price movement and momentum during the recent trading periods:
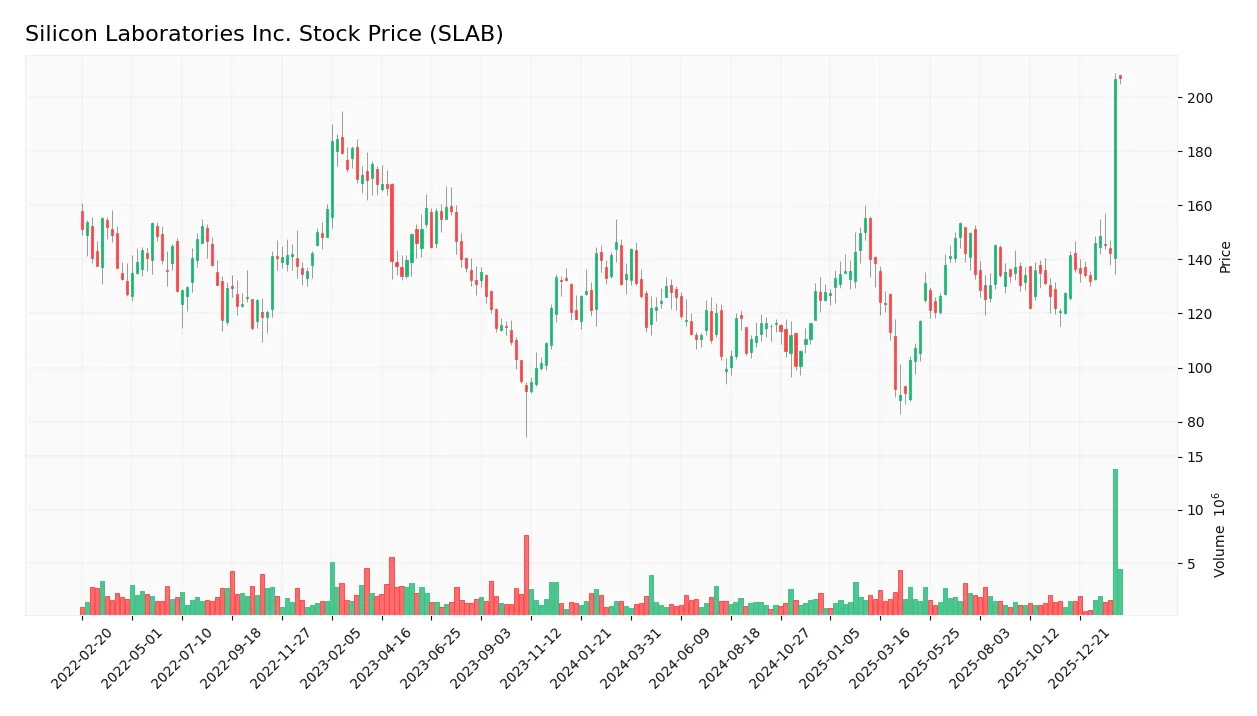
Trend Analysis
Over the past 12 months, SLAB’s stock price surged 53.69%, confirming a bullish trend with clear acceleration. The price ranged between 89.82 and 207.1, with volatility measured by an 18.09 standard deviation. Recent weeks show even stronger momentum, with a 62.33% rise and increased volatility at 25.98.
Volume Analysis
Trading volume has increased, driven by buyers who represent 56.7% of total activity. In the last three months, buyer dominance strengthened to 76.5%, indicating robust demand and heightened investor participation. Seller volume remains comparatively subdued, reinforcing a buyer-driven market sentiment.
Target Prices
Analysts set a confident target consensus for Silicon Laboratories Inc., reflecting positive market expectations.
| Target Low | Target High | Consensus |
|---|---|---|
| 160 | 231 | 211.6 |
The target range from 160 to 231 demonstrates strong upside potential. The consensus at 211.6 signals broad analyst confidence in SLAB’s growth prospects.

Don’t Let Luck Decide Your Entry Point
Optimize your entry points with our advanced ProRealTime indicators. You’ll get efficient buy signals with precise price targets for maximum performance. Start outperforming now!
Analyst & Consumer Opinions
This section reviews the latest analyst ratings and consumer feedback to assess Silicon Laboratories Inc.’s market perception.
Stock Grades
Here are the latest verified analyst ratings for Silicon Laboratories Inc. reflecting recent changes in outlook:
| Grading Company | Action | New Grade | Date |
|---|---|---|---|
| Citigroup | Maintain | Neutral | 2026-02-06 |
| RBC Capital | Maintain | Sector Perform | 2026-02-05 |
| Benchmark | Downgrade | Hold | 2026-02-04 |
| Needham | Downgrade | Hold | 2026-02-04 |
| Keybanc | Downgrade | Sector Weight | 2026-02-04 |
| Morgan Stanley | Maintain | Equal Weight | 2025-08-06 |
| Susquehanna | Maintain | Neutral | 2025-08-06 |
| Barclays | Maintain | Equal Weight | 2025-08-05 |
| Susquehanna | Maintain | Neutral | 2025-07-22 |
| Stifel | Maintain | Buy | 2025-07-18 |
The trend shows a recent cautious shift with multiple downgrades to hold and sector weight in early 2026. Consensus remains generally positive, but the reduction from buy to hold signals growing analyst prudence.
Consumer Opinions
Silicon Laboratories Inc. (SLAB) enjoys a generally favorable reputation among users, reflecting its strong market position in semiconductor solutions.
| Positive Reviews | Negative Reviews |
|---|---|
| Product quality is consistently reliable. | Customer support response times can lag. |
| Innovative technology drives excellent performance. | Pricing is higher compared to some competitors. |
| Easy integration with existing systems. | Limited availability of certain components. |
Overall, consumers praise SLAB for product reliability and innovation. However, concerns about customer service and pricing recur, suggesting areas for improvement.
Risk Analysis
Below is a summary table outlining the key risk categories for Silicon Laboratories Inc., including their likelihood and potential impact:
| Category | Description | Probability | Impact |
|---|---|---|---|
| Profitability | Negative net margin and ROIC indicate ongoing operational losses. | High | High |
| Financial Health | Strong Altman Z-score contrasts with poor Piotroski score, signaling mixed financial stability. | Medium | Medium |
| Market Volatility | Beta of 1.54 suggests above-average stock price fluctuations. | High | Medium |
| Liquidity | High current and quick ratios imply good short-term liquidity, but interest coverage is negative. | Medium | High |
| Valuation | Elevated PB ratio (3.94) signals potential overvaluation risk. | Medium | Medium |
| Industry Risk | Semiconductor cyclical downturns could pressure revenues and margins. | High | High |
Profitability risks are the most pressing. SLAB reported a -8.3% net margin and -6.3% ROIC versus an 11% WACC, signaling value destruction. The semiconductor sector’s cyclical nature compounds headwinds. Despite a strong Altman Z-score (25.2, safe zone), the average Piotroski score (4) warns of operational challenges. Elevated beta (1.54) and valuation multiples increase volatility risk. Investors should weigh these factors carefully.
Should You Buy Silicon Laboratories Inc.?
Silicon Laboratories Inc. appears to be facing deteriorating profitability and a very unfavorable moat, reflecting value destruction and declining operational efficiency. Despite a manageable debt profile and a safe Altman Z-Score, its overall rating is weak (D+), suggesting cautious analytical interpretation.
Strength & Efficiency Pillars
Silicon Laboratories Inc. operates with a gross margin of 58.23%, reflecting solid operational efficiency. The firm benefits from a strong current ratio of 4.69, suggesting ample liquidity. Despite this, the company’s return on equity (-5.93%) and return on invested capital (-6.27%) are negative, trailing its weighted average cost of capital of 11%. This signals that Silicon Labs is currently destroying value and struggling to generate returns above its capital cost.
Weaknesses and Drawbacks
Silicon Labs is in the safe zone with an Altman Z-Score of 25.25, indicating low bankruptcy risk. However, its financial profile shows significant weaknesses. The negative net margin (-8.27%) and EBIT margin (-7.26%) raise concerns about profitability. The price-to-book ratio stands at 3.94, above typical benchmarks, suggesting overvaluation risk. Interest coverage is -58.4, revealing poor ability to service debt despite low debt levels. These factors collectively pressure valuation and operational sustainability.
Our Final Verdict about Silicon Laboratories Inc.
Despite a strong solvency position, Silicon Labs suffers from declining profitability and value destruction as shown by negative ROIC and ROE. The bullish price trend and strong buyer dominance (76.5%) may appear encouraging. Still, the weak margins and unfavorable capital returns suggest a cautious stance. The stock might appeal to investors comfortable with risk but may not suit conservative capital seeking consistent value creation.
Disclaimer: This content is for informational purposes only and does not constitute financial, investment, or other professional advice. Investing in financial markets involves a significant risk of loss, and past performance is not indicative of future results.
Additional Resources
- 7,046 Shares in Silicon Laboratories, Inc. $SLAB Acquired by Azzad Asset Management Inc. ADV – MarketBeat (Feb 10, 2026)
- Decoding Silicon Laboratories Inc (SLAB): A Strategic SWOT Insig – GuruFocus (Feb 11, 2026)
- Silicon Labs Acquisition Is A Quiet Win For Texas Instruments (NASDAQ:SLAB) – Seeking Alpha (Feb 05, 2026)
- Texas Instruments Bid Recasts Silicon Labs IoT Future With Cash Exit – Sahm (Feb 08, 2026)
- Silicon Labs Reports Fourth Quarter and Full Year 2025 Results – PR Newswire (Feb 04, 2026)
For more information about Silicon Laboratories Inc., please visit the official website: silabs.com