Home > Analyses > Technology > ServiceTitan, Inc.
ServiceTitan, Inc. revolutionizes how field service businesses manage their operations, directly impacting millions of homeowners and commercial clients who rely on efficient maintenance and repair services. As a frontrunner in application software for the service industry, ServiceTitan combines cutting-edge technology with a deep understanding of its market, earning a reputation for innovation and operational excellence. As we analyze its current market position and growth prospects, the key question remains: does ServiceTitan’s strong foundation justify its valuation and future potential in a competitive landscape?
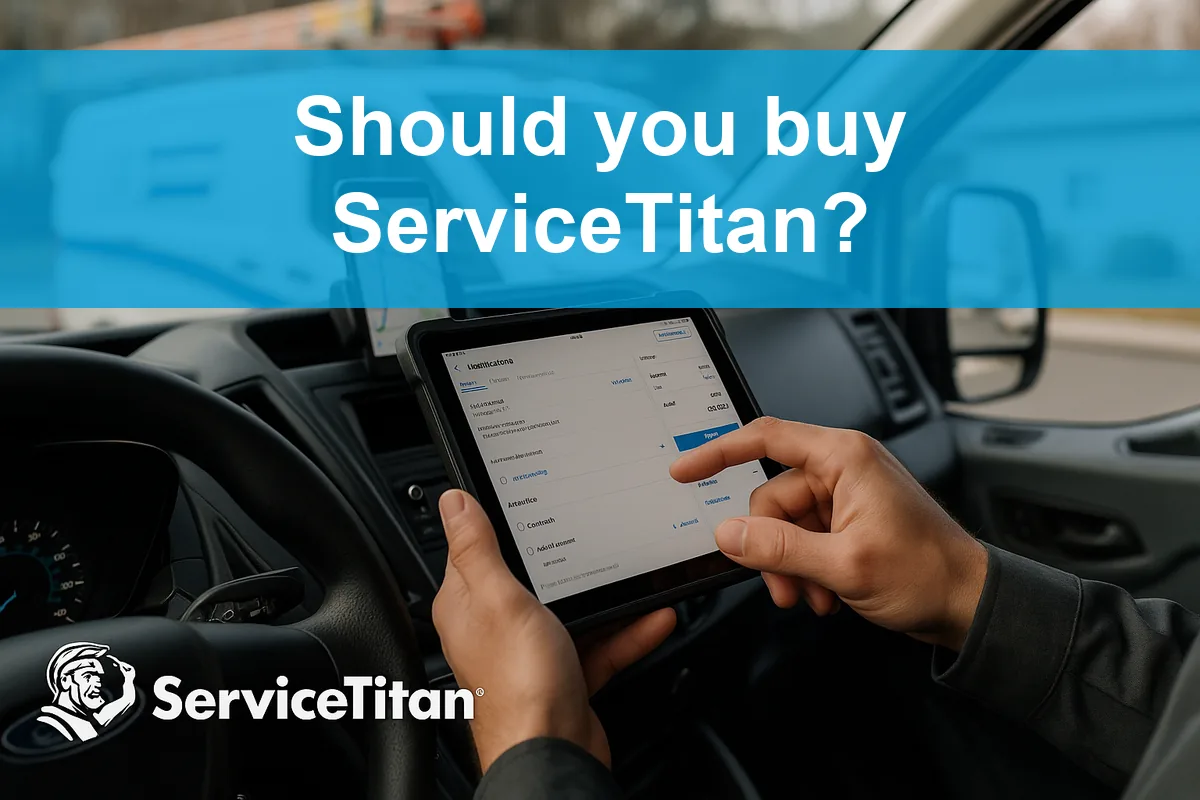
Table of contents
Business Model & Company Overview
ServiceTitan, Inc., founded in 2008 and headquartered in Glendale, CA, stands as a dominant player in the software application industry. It delivers an integrated platform designed to streamline field service operations for residential and commercial infrastructure, forming a cohesive ecosystem that enhances installation, maintenance, and service workflows. This core mission drives its reputation as an essential technology partner for trades businesses.
The company’s revenue engine blends software solutions with recurring subscription services, fueling steady growth and customer retention. With a workforce of over 3,000 employees, ServiceTitan maintains strategic market exposure across the Americas, Europe, and Asia, leveraging its global footprint. Its competitive advantage lies in the robust integration of its platform, creating high switching costs that secure its role in shaping the future of field service management.
Financial Performance & Fundamental Metrics
This section provides a fundamental analysis of ServiceTitan, Inc., focusing on its income statement, key financial ratios, and dividend payout policy.
Income Statement
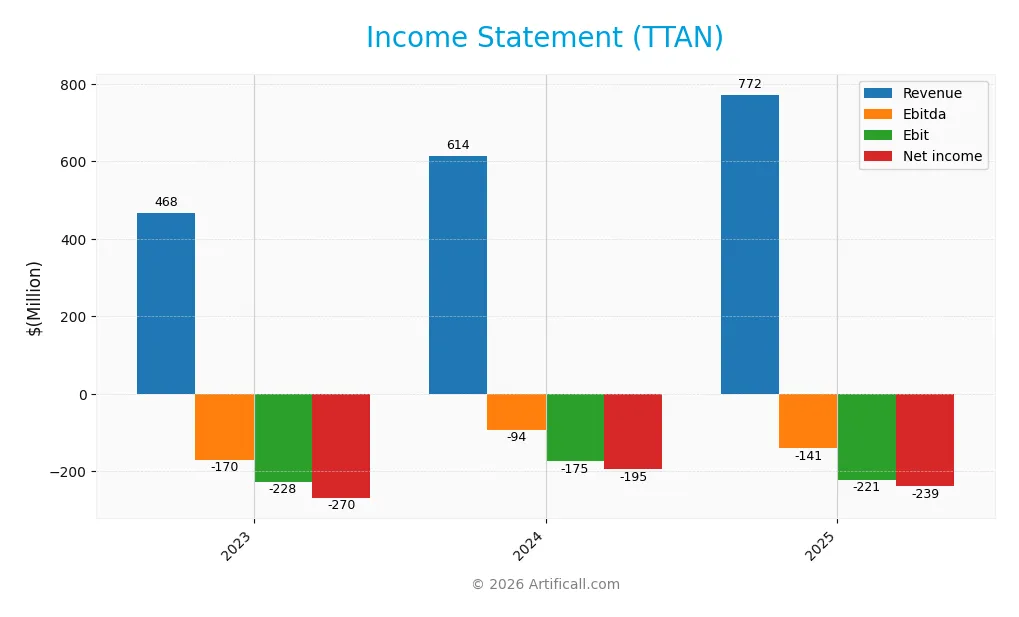
The following table presents ServiceTitan, Inc.’s Income Statement data for fiscal years 2023 through 2025, highlighting key financial metrics with values in USD.
| 2023 | 2024 | 2025 | |
|---|---|---|---|
| Revenue | 468M | 614M | 772M |
| Cost of Revenue | 202M | 238M | 271M |
| Operating Expenses | 488M | 559M | 731M |
| Gross Profit | 266M | 377M | 501M |
| EBITDA | -170M | -93.6M | -141M |
| EBIT | -228M | -175M | -221M |
| Interest Expense | 54.5M | 16.4M | 15.5M |
| Net Income | -270M | -195M | -239M |
| EPS | -3.44 | -2.93 | -8.53 |
| Filing Date | 2023-01-31 | 2024-01-31 | 2025-04-02 |
Income Statement Evolution
ServiceTitan, Inc. reported a 65.02% revenue growth from 2023 to 2025, with a 25.64% increase from 2024 to 2025 alone, reflecting strong top-line expansion. Gross profit rose 33.0% in the last year, improving gross margin to a favorable 64.9%. However, EBIT and net margins remained negative at -28.67% and -30.98%, respectively, indicating persistent profitability challenges despite revenue gains.
Is the Income Statement Favorable?
In 2025, ServiceTitan’s fundamentals present a mixed picture. While revenue and gross profit growth are favorable, operating expenses scaled proportionally, leading to a 26.74% decline in EBIT and continued net losses of -239M USD. Interest expense is relatively low at 2.01% of revenue, but negative net and EBIT margins weigh on profitability. Overall, the income statement is evaluated as favorable, reflecting solid growth offset by ongoing operational losses.
Financial Ratios
The table below presents key financial ratios for ServiceTitan, Inc. (TTAN) over the fiscal years 2023 to 2025, illustrating profitability, valuation, liquidity, leverage, and operational efficiency:
| Ratios | 2023 | 2024 | 2025 |
|---|---|---|---|
| Net Margin | -57.62% | -31.76% | -30.98% |
| ROE | -22.19% | -16.95% | -16.44% |
| ROIC | -14.36% | -13.01% | -14.11% |
| P/E | -30.86 | -42.63 | -18.12 |
| P/B | 6.85 | 7.22 | 2.98 |
| Current Ratio | 2.06 | 1.99 | 3.74 |
| Quick Ratio | 2.06 | 1.99 | 3.74 |
| D/E | 0.21 | 0.21 | 0.11 |
| Debt-to-Assets | 15.82% | 16.21% | 9.35% |
| Interest Coverage | -4.07 | -11.13 | -14.82 |
| Asset Turnover | 0.29 | 0.40 | 0.44 |
| Fixed Asset Turnover | 3.27 | 4.37 | 9.57 |
| Dividend Yield | 0 | 0 | 0 |
Evolution of Financial Ratios
From 2023 to 2025, ServiceTitan, Inc. (TTAN) saw its Return on Equity (ROE) improve slightly but remain negative, moving from -22.19% to -16.44%. The Current Ratio increased significantly from around 2.06 in 2023 to 3.74 in 2025, indicating stronger short-term liquidity. The Debt-to-Equity Ratio declined from 0.21 in 2023 to 0.11 in 2025, reflecting reduced leverage. Profitability margins remained negative, showing persistent losses despite some margin stabilization.
Are the Financial Ratios Favorable?
In 2025, TTAN’s profitability ratios such as net margin (-31.0%) and ROE (-16.4%) were unfavorable, highlighting ongoing losses. Liquidity measures showed mixed signals: a high Current Ratio (3.74) was unfavorable, while the Quick Ratio matched it and was favorable. Leverage ratios were generally favorable, with low debt-to-equity (0.11) and debt-to-assets (9.35%). Efficiency was weak with an asset turnover of 0.44 but fixed asset turnover was strong at 9.57. Overall, the financial ratios are slightly unfavorable.
Shareholder Return Policy
ServiceTitan, Inc. (TTAN) does not pay dividends, reflecting its negative net income and reinvestment focus. The company retains earnings to support growth and operational cash flow improvements, with no reported share buyback programs.
This approach aligns with a high-growth profile, prioritizing long-term value creation through investment rather than immediate shareholder payouts. The absence of dividends and buybacks suggests a strategy centered on sustainable expansion rather than short-term returns.
Score analysis
The following radar chart presents a comprehensive overview of ServiceTitan, Inc.’s key financial scores:
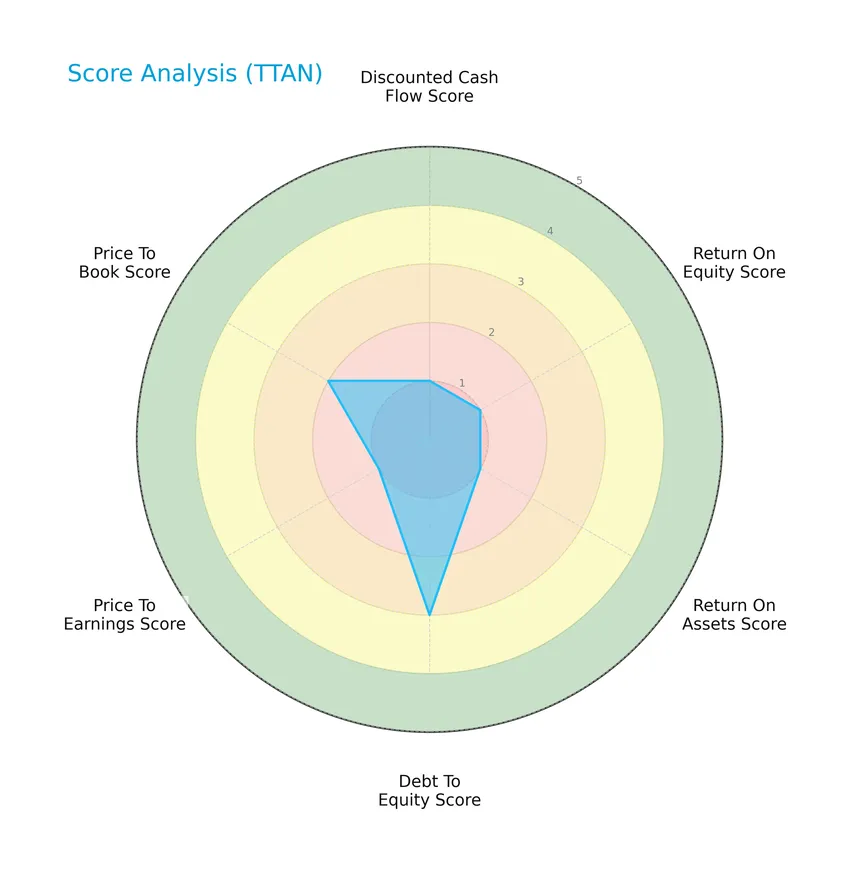
The company’s scores reveal very unfavorable ratings in discounted cash flow, return on equity, return on assets, and price to earnings, while debt to equity and price to book show moderate assessments, indicating mixed financial metrics overall.
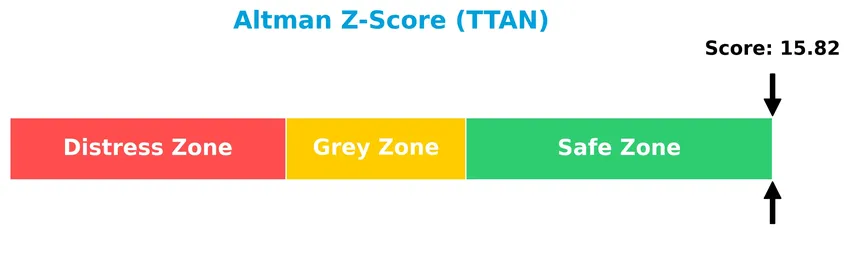
Analysis of the company’s bankruptcy risk
ServiceTitan, Inc. demonstrates a strong financial position with an Altman Z-Score firmly in the safe zone, reflecting a very low risk of bankruptcy:
Is the company in good financial health?
The Piotroski diagram below illustrates the company’s financial strength based on various accounting criteria:

With a Piotroski Score of 6, the company is positioned in the average range, suggesting moderate financial health but not outstanding strength according to this measure.
Competitive Landscape & Sector Positioning
This sector analysis will examine ServiceTitan, Inc.’s strategic positioning, revenue by segment, key products, main competitors, competitive advantages, and SWOT analysis. I will assess whether ServiceTitan holds a competitive advantage over its industry peers in the software application sector.
Strategic Positioning
ServiceTitan, Inc. operates a concentrated product portfolio primarily focused on software applications for field service management in residential and commercial infrastructure. Headquartered in the US, the company’s revenue streams are largely derived from platform and subscription services, reflecting a focused strategy within the technology sector.
Revenue by Segment
This pie chart illustrates ServiceTitan, Inc.’s revenue breakdown by segment for the fiscal year 2025, highlighting the company’s key income streams.
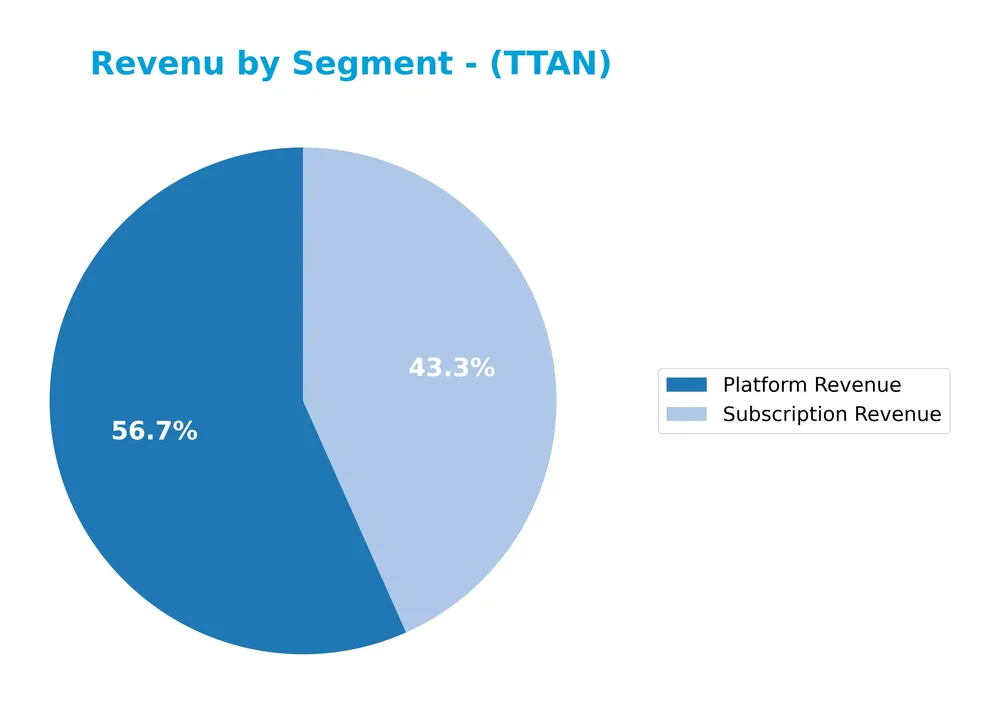
In 2025, ServiceTitan’s revenue was primarily driven by its Platform Revenue at 740M, complemented by Subscription Revenue of 566M. The platform segment remains the largest contributor, reflecting the company’s focus on integrated service solutions. Subscription Revenue also represents a significant and stable income source, indicating recurring customer engagement. The overall revenue distribution suggests a balanced approach, with no abrupt shifts but steady growth in both segments.
Key Products & Brands
The following table outlines ServiceTitan, Inc.’s main products and their descriptions:
| Product | Description |
|---|---|
| Platform Revenue | Revenue generated from ServiceTitan’s software platform supporting field service management. |
| Subscription Revenue | Income from subscription-based access to ServiceTitan’s application software and services. |
ServiceTitan’s key revenue streams are centered on its software platform and subscription services, which facilitate field service operations for residential and commercial infrastructure maintenance.
Main Competitors
ServiceTitan, Inc. operates in a competitive landscape with 33 peers, with the table below showing the top 10 leaders by market capitalization:
| Competitor | Market Cap. |
|---|---|
| Salesforce, Inc. | 242.5B |
| Shopify Inc. | 209.6B |
| AppLovin Corporation | 209.0B |
| Intuit Inc. | 175.2B |
| Uber Technologies, Inc. | 172.2B |
| ServiceNow, Inc. | 153.0B |
| Cadence Design Systems, Inc. | 84.5B |
| Snowflake Inc. | 73.4B |
| Autodesk, Inc. | 61.2B |
| Workday, Inc. | 54.9B |
ServiceTitan, Inc. ranks 24th among its 33 competitors, with a market cap roughly 3.57% that of the leader, Salesforce. It stands below both the average market cap of the top 10 competitors (143.6B) and the median sector market cap (18.8B). The company has a notable 18.1% gap to the next competitor above, indicating a measurable difference in scale.
Comparisons with competitors
Check out how we compare the company to its competitors:
Does TTAN have a competitive advantage?
ServiceTitan, Inc. currently does not present a competitive advantage as its return on invested capital (ROIC) is significantly below its weighted average cost of capital (WACC), indicating value destruction despite stable profitability. The company’s income statement shows a favorable gross margin of 64.9% and strong revenue growth of 25.64% in the past year, yet it struggles with negative EBIT and net margins.
Looking ahead, ServiceTitan has opportunities to expand its footprint in the field service software market by leveraging its solid revenue growth and improving operational efficiency. However, ongoing challenges in profitability and earnings per share growth will require careful management to convert growth into sustainable value creation.
SWOT Analysis
This SWOT analysis highlights the key internal and external factors affecting ServiceTitan, Inc. to guide strategic investment decisions.
Strengths
- strong revenue growth (25.6% YoY)
- favorable gross margin (64.9%)
- low debt and strong liquidity (debt to assets 9.35%)
Weaknesses
- negative net margin (-31%)
- poor profitability ratios (ROE -16.4%, ROIC -14.1%)
- declining EPS (-191% YoY)
Opportunities
- expanding field service software market
- potential margin improvement through operational efficiency
- technology adoption in commercial and residential sectors
Threats
- intense competition in software applications
- risk of prolonged unprofitability
- macroeconomic uncertainty affecting customer budgets
Overall, ServiceTitan shows robust top-line growth and solid market positioning but struggles with profitability and value creation. Strategic focus on operational efficiency and margin improvement is critical to convert growth into sustainable profitability and shareholder value.
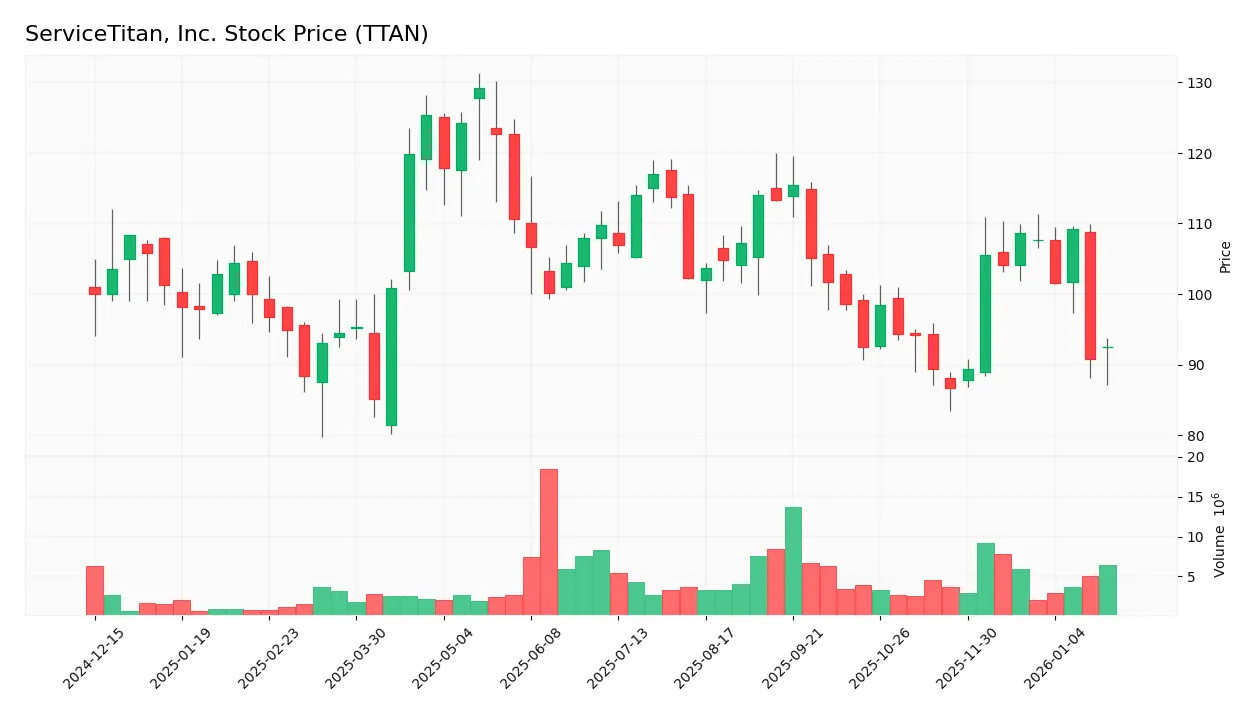
Stock Price Action Analysis
The weekly stock chart of ServiceTitan, Inc. (TTAN) illustrates price movements and volatility over the past 12 months:
Trend Analysis
Over the past 12 months, TTAN’s stock price declined by 7.51%, indicating a bearish trend with accelerating downward momentum. Price volatility is significant, with a standard deviation of 9.89. The highest price reached 129.26 and the lowest dropped to 85.07, confirming notable fluctuations and a clear negative direction.
Volume Analysis
Trading volume for TTAN has been increasing, with a nearly balanced buyer-seller split at 48.49% and 51.51%, respectively, over the full period. In the recent 3 months, volume remains neutral with buyers holding 49.48%, suggesting stable investor participation and no dominant directional pressure in trading activity.
Target Prices
The consensus target prices for ServiceTitan, Inc. reflect a generally positive outlook among analysts.
| Target High | Target Low | Consensus |
|---|---|---|
| 145 | 117 | 133.11 |
Analysts expect the stock to trade between 117 and 145, with a consensus target around 133, indicating moderate upside potential.

Don’t Let Luck Decide Your Entry Point
Optimize your entry points with our advanced ProRealTime indicators. You’ll get efficient buy signals with precise price targets for maximum performance. Start outperforming now!
Analyst & Consumer Opinions
This section examines the latest analyst ratings and consumer feedback related to ServiceTitan, Inc. (TTAN).
Stock Grades
Here is the latest overview of ServiceTitan, Inc. stock grades from reputable financial institutions as of late 2025:
| Grading Company | Action | New Grade | Date |
|---|---|---|---|
| BMO Capital | Maintain | Outperform | 2025-12-05 |
| Piper Sandler | Maintain | Overweight | 2025-12-05 |
| TD Cowen | Maintain | Buy | 2025-12-05 |
| Morgan Stanley | Maintain | Equal Weight | 2025-12-05 |
| Wells Fargo | Maintain | Overweight | 2025-09-19 |
| Stifel | Maintain | Buy | 2025-09-19 |
| Canaccord Genuity | Maintain | Buy | 2025-09-19 |
| Citigroup | Maintain | Neutral | 2025-09-09 |
The grades predominantly indicate a positive market sentiment with a consensus rating of “Buy” supported by 12 buy recommendations and only 2 holds, reflecting steady confidence without significant downgrades or upgrades in recent months.
Consumer Opinions
Consumer sentiment around ServiceTitan, Inc. (TTAN) reflects a mix of appreciation for its efficiency and concerns about pricing.
| Positive Reviews | Negative Reviews |
|---|---|
| Intuitive platform that streamlines daily operations | Pricing can be high for small businesses |
| Excellent customer support with quick response times | Occasional software glitches reported |
| Robust features that improve scheduling and dispatch | Learning curve can be steep for new users |
Overall, consumers praise ServiceTitan for its powerful features and responsive support, though some find its cost and complexity challenging, especially for smaller companies.
Risk Analysis
The table below summarizes the key risks associated with ServiceTitan, Inc., considering their likelihood and potential impact:
| Category | Description | Probability | Impact |
|---|---|---|---|
| Financial Health | Negative net margin (-31%) and negative ROE (-16%) indicating losses | High | High |
| Profitability | Unfavorable return on invested capital (-14%) and negative interest coverage | High | High |
| Liquidity | Mixed liquidity ratios: strong quick ratio but unfavorable current ratio | Medium | Medium |
| Market Volatility | Beta of -0.85 suggests unusual price movements, complicating risk pricing | Medium | Medium |
| Valuation Metrics | Negative PE ratio but neutral PB ratio reflects market uncertainty | Medium | Medium |
| Credit Risk | Low debt-to-equity (0.11) and debt-to-assets (9.35%) indicate manageable debt | Low | Low |
| Bankruptcy Risk | Altman Z-Score in safe zone (15.82) reduces immediate bankruptcy concerns | Low | Low |
The most critical risks for ServiceTitan remain its persistent unprofitability and poor returns on equity and capital, which could pressure cash flow and valuation. Despite this, the company’s strong Altman Z-Score and low leverage mitigate immediate bankruptcy risks. Investors should monitor profitability trends carefully.
Should You Buy ServiceTitan, Inc.?
ServiceTitan, Inc. appears to be facing challenges in profitability with value destruction despite a stable moat, while its leverage profile could be seen as moderate. Supported by a safe Altman Z-score but an overall C- rating, the company suggests a cautious investment profile.
Strength & Efficiency Pillars
ServiceTitan, Inc. reveals solid financial stability with an Altman Z-Score of 15.82, firmly placing it in the safe zone and indicating negligible bankruptcy risk. The Piotroski score of 6 reflects average financial strength, suggesting moderate operational health. Favorable gross margin at 64.9% and a low debt-to-equity ratio of 0.11 highlight operational efficiency and conservative leverage. However, negative returns on equity (-16.44%) and invested capital (-14.11%) alongside a ROIC below the WACC (4.97%) indicate the company is currently a value destroyer rather than a creator.
Weaknesses and Drawbacks
ServiceTitan’s profitability metrics are concerning, with a net margin of -30.98% and an EBIT margin at -28.67%, pointing to operational inefficiencies and ongoing losses. The company’s P/B ratio of 2.98 suggests a moderate valuation, but the negative P/E ratio (-18.12) reflects underlying earnings instability. The current ratio of 3.74, while indicating liquidity, may imply inefficient asset use, and a negative interest coverage ratio (-14.26) signals challenges in meeting interest obligations. The stock’s bearish trend with a -7.51% price change and nearly balanced buyer-seller volumes create short-term market pressure and uncertainty.
Our Verdict about ServiceTitan, Inc.
The long-term fundamental profile for ServiceTitan, Inc. appears unfavorable, marked by value destruction and negative profitability despite stable financial health. The bearish overall stock trend and recent neutral buyer behavior suggest market caution. Despite some operational strengths, these factors combined may advise investors to adopt a wait-and-see approach before considering exposure, as the risk-reward balance remains uncertain under current conditions.
Disclaimer: This content is for informational purposes only and does not constitute financial, investment, or other professional advice. Investing in financial markets involves a significant risk of loss, and past performance is not indicative of future results.
Additional Resources
- Is ServiceTitan (TTAN) one of the best young stocks to buy and hold for 3 years? – MSN (Jan 24, 2026)
- Massachusetts Financial Services Co. MA Decreases Stock Position in ServiceTitan Inc. $TTAN – MarketBeat (Jan 21, 2026)
- Sherry David, cfo of servicetitan, sells $88k in ttan stock – Investing.com (Jan 22, 2026)
- Getting In Cheap On ServiceTitan, Inc. (NASDAQ:TTAN) Is Unlikely – simplywall.st (Jan 16, 2026)
- ServiceTitan rises as Morgan Stanley upgrades, names it Top Pick (TTAN) – Seeking Alpha (Jan 20, 2026)
For more information about ServiceTitan, Inc., please visit the official website: servicetitan.com