Home > Analyses > Utilities > Sempra
Sempra powers millions of households and businesses across the southwestern United States, quietly shaping how energy flows into daily life. As a cornerstone in diversified utilities, it commands vast electric and natural gas networks, delivering reliable energy through its San Diego Gas & Electric and Southern California Gas segments. Known for innovation in infrastructure and operational scale, Sempra stands at the crossroads of energy transition. The pressing question: does its robust asset base still justify its current market valuation and growth outlook?

Table of contents
Business Model & Company Overview
Sempra, founded in 1998 and based in San Diego, stands as a leading force in the diversified utilities sector. It operates a comprehensive energy ecosystem through its San Diego Gas & Electric and Southern California Gas Company segments, serving millions across expansive territories. Its integrated approach links electric and natural gas services, creating a seamless energy infrastructure that supports both residential and commercial customers.
The company’s revenue engine balances regulated transmission and distribution with robust service delivery across the Americas, especially in California and Texas. Sempra manages 18,249 circuit miles of transmission lines and serves over 30 million people, blending hardware assets with stable, recurring utility revenues. This extensive network and scale form a powerful economic moat, positioning Sempra as a key architect in the future of North American energy utilities.
Financial Performance & Fundamental Metrics
I analyze Sempra’s income statement, key financial ratios, and dividend payout policy to assess its profitability, efficiency, and shareholder returns.
Income Statement
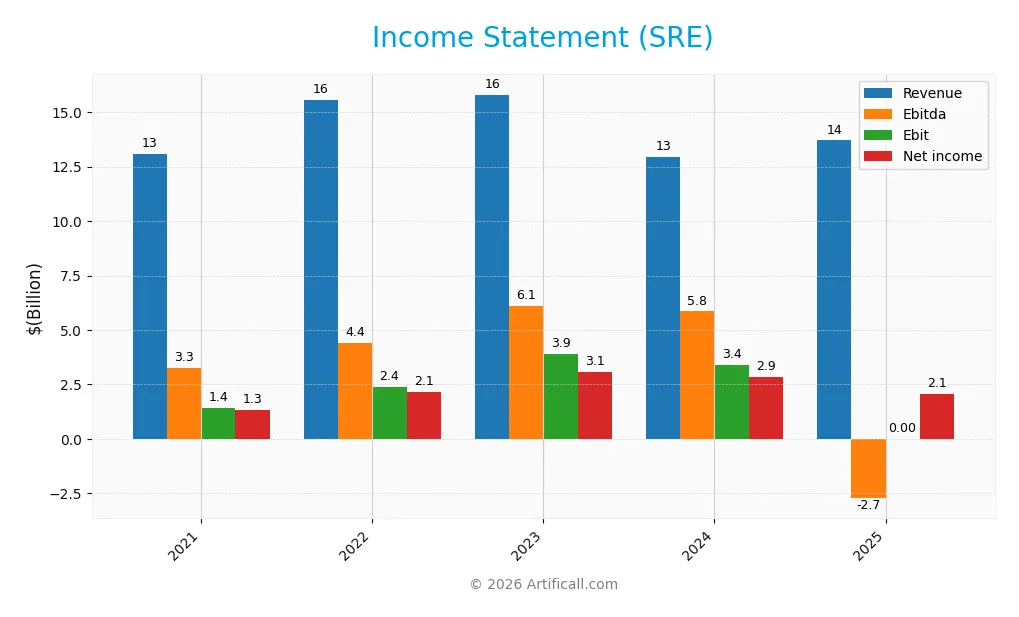
The table below summarizes Sempra’s key income statement metrics from 2021 to 2025, reflecting revenue, profitability, and earnings per share trends.
| 2021 | 2022 | 2023 | 2024 | 2025 | |
|---|---|---|---|---|---|
| Revenue | 13.1B | 15.6B | 15.8B | 13.0B | 13.7B |
| Cost of Revenue | 9.4B | 11.4B | 12.1B | 9.4B | 6.6B |
| Operating Expenses | 596M | 635M | 677M | 693M | 0 |
| Gross Profit | 3.6B | 4.2B | 3.7B | 3.5B | 7.1B |
| EBITDA | 3.3B | 4.4B | 6.1B | 5.9B | -2.7B |
| EBIT | 1.4B | 2.4B | 3.9B | 3.4B | 0 |
| Interest Expense | 1.2B | 1.1B | 1.3B | 1.3B | -1.5B |
| Net Income | 1.3B | 2.1B | 3.1B | 2.9B | 2.1B |
| EPS | 2.01 | 3.32 | 4.81 | 4.44 | 3.17 |
| Filing Date | 2022-02-25 | 2023-02-28 | 2024-02-27 | 2025-02-25 | 2026-02-26 |
Income Statement Evolution
Sempra’s revenue showed moderate growth, increasing around 5% annually, with a neutral overall trend from 2021 to 2025. Net income expanded by 57%, reflecting improving profitability despite a recent 31.5% decline in net margin. Gross margin rose favorably to 52.1%, but the EBIT margin dropped sharply to zero, indicating margin pressure on operating profits.
Is the Income Statement Favorable?
In 2025, Sempra reported $13.7B revenue and $2.07B net income, yielding a 15.1% net margin, which remains favorable. However, the zero EBIT margin signals operational challenges. Interest expense relative to revenue improved, supporting net results. Overall, fundamentals appear generally favorable but show signs of strain in operating efficiency and earnings quality.
Financial Ratios
The following table presents key financial ratios for Sempra over recent fiscal years, providing insight into profitability, leverage, liquidity, and valuation metrics:
| Ratios | 2021 | 2022 | 2023 | 2024 | 2025 |
|---|---|---|---|---|---|
| Net Margin | 10% | 14% | 19% | 22% | 15% |
| ROE | 5.1% | 7.9% | 10.7% | 9.2% | 5.3% |
| ROIC | 4.4% | 3.9% | 3.4% | 2.9% | 0% |
| P/E | 31.3 | 22.8 | 15.3 | 19.4 | 27.8 |
| P/B | 1.59 | 1.79 | 1.64 | 1.78 | 1.49 |
| Current Ratio | 0.44 | 0.60 | 0.54 | 0.55 | 0.01 |
| Quick Ratio | 0.40 | 0.56 | 0.49 | 0.49 | 0.01 |
| D/E | 0.95 | 1.07 | 1.08 | 1.15 | 0.90 |
| Debt-to-Assets | 34% | 37% | 36% | 37% | 72% |
| Interest Coverage | 2.57 | 3.34 | 2.43 | 2.17 | 0 |
| Asset Turnover | 0.18 | 0.20 | 0.18 | 0.13 | 0.28 |
| Fixed Asset Turnover | 0.29 | 0.32 | 0.28 | 0.21 | 0 |
| Dividend Yield | 3.5% | 3.0% | 3.2% | 2.8% | 2.8% |
Evolution of Financial Ratios
Sempra’s Return on Equity (ROE) showed a decline, finishing at 5.34% in 2025, down from over 10% in previous years. The Current Ratio deteriorated sharply to 0.01, signaling liquidity stress. Debt-to-Equity remained relatively stable around 0.9, reflecting consistent leverage. Profitability margins experienced mixed shifts, with net margins holding steady at about 15%.
Are the Financial Ratios Favorable?
In 2025, profitability shows a favorable net margin of 15.12%, yet ROE and ROIC remain below WACC, indicating weak capital returns. Liquidity ratios, including Current and Quick Ratios, are critically low, posing risks. Leverage is neutral with a 0.9 Debt-to-Equity, but high debt-to-assets at 71.9% is unfavorable. Market multiples are mixed, with a high P/E of 27.8 flagged as unfavorable, while dividend yield at 2.78% is favorable overall. The global ratio assessment is unfavorable.
Shareholder Return Policy
Sempra maintains a dividend payout ratio near 77% with a stable dividend per share around $2.46, yielding roughly 2.78% annually. The company also engages in share buybacks, supported by free cash flow coverage exceeding dividend payments and capital expenditures.
This distribution approach balances shareholder returns with capital needs amid leverage near 0.9 debt-to-equity. While the payout ratio is elevated, coverage by free cash flow suggests sustainability. The policy appears aligned with long-term value creation, though high leverage warrants monitoring.
Score analysis
The radar chart below highlights Sempra’s key financial metric scores for investor evaluation:

Sempra scores very low on discounted cash flow and price-to-earnings, signaling valuation concerns. Return on assets is favorable, while return on equity and debt-to-equity scores remain moderate to unfavorable, reflecting mixed operational efficiency and leverage.
Analysis of the company’s bankruptcy risk
Sempra’s Altman Z-Score places it firmly in the distress zone, indicating a significant risk of financial distress and potential bankruptcy:

Is the company in good financial health?
The Piotroski diagram presents Sempra’s strong financial health based on its score of 7 out of 9:

A score of 7 suggests solid profitability and balance sheet strength, although not at the highest echelon of financial robustness. This indicates the company maintains considerable internal operational strength despite external risks.
Competitive Landscape & Sector Positioning
This analysis explores Sempra’s strategic positioning, revenue segments, key products, and main competitors. I will assess whether Sempra holds a competitive advantage within the diversified utilities sector.
Strategic Positioning
Sempra focuses on diversified utilities, primarily serving the US with $11.6B revenue in 2024, plus $1.56B from Mexico. Its portfolio centers on electric and natural gas services, reflecting concentrated geographic exposure with strong regulated operations in California and Texas.
Revenue by Segment
This pie chart illustrates Sempra’s revenue distribution by segment for fiscal year 2024, highlighting the key contributors to the company’s top line.
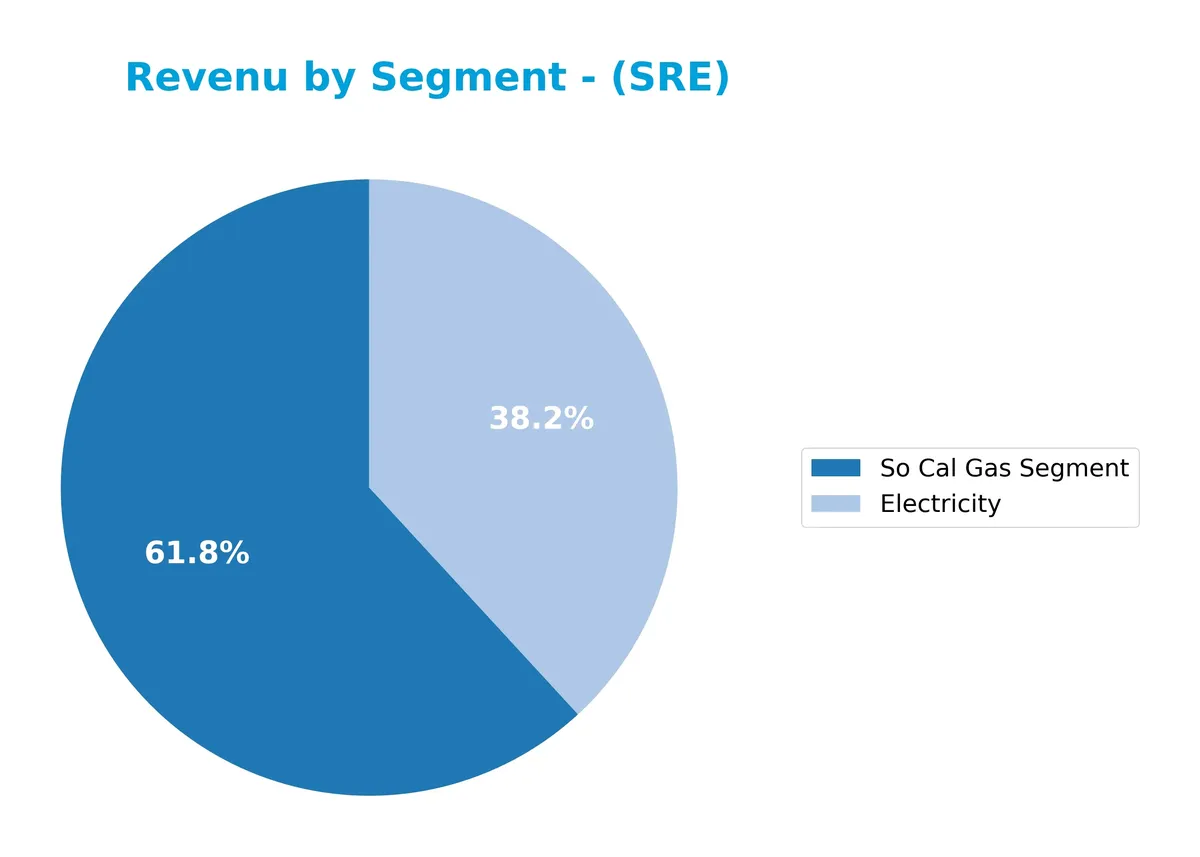
Sempra’s revenue in 2024 centers mainly on its So Cal Gas Segment at 7.3B and Electricity at 4.5B. The gas segment, although dominant, has declined notably from 9.7B in 2023, indicating a potential slowdown or market shift. Electricity revenue also contracted from 5.2B in 2023. This concentration risk in So Cal Gas revenue and the recent pullback warrant cautious monitoring as Sempra navigates evolving energy dynamics.
Key Products & Brands
The following table summarizes Sempra’s key products and brands with concise descriptions:
| Product | Description |
|---|---|
| Electricity | Provides electric services primarily through San Diego Gas & Electric and Sempra Texas Utilities. |
| So Cal Gas Segment | Operates natural gas distribution, transmission, and storage systems serving approximately 22M people. |
Sempra’s core business revolves around electricity and natural gas services, with significant scale in Southern California and Texas. Electricity and natural gas segments consistently generate multi-billion dollar revenues, highlighting their central role in Sempra’s operations.
Main Competitors
There are 2 competitors in the sector, with the table below listing the top 10 leaders by market capitalization:
| Competitor | Market Cap. |
|---|---|
| Sempra | 58.6B |
| The AES Corporation | 10.6B |
Sempra ranks 1st among its competitors, commanding a market cap 6% larger than the next leader. It sits well above both the average market cap of the top 10 utilities (34.6B) and the sector median. The company’s market cap exceeds its closest rival by nearly 489%, reflecting a dominant position.
Comparisons with competitors
Check out how we compare the company to its competitors:
Does Sempra have a competitive advantage?
Sempra currently lacks a competitive advantage, with a very unfavorable moat rating and a ROIC 5.6% below its WACC. The company’s declining ROIC signals value destruction and limited capacity to reinvest profitably.
Looking ahead, Sempra’s scale in electric and natural gas services across millions of customers and extensive transmission infrastructure offers opportunities for growth. Expansion into new markets and product innovation could improve its competitive positioning over time.
SWOT Analysis
This SWOT analysis highlights Sempra’s critical internal and external factors shaping its strategic outlook.
Strengths
- strong market presence in US utilities
- diversified energy services portfolio
- favorable net margin of 15.12%
Weaknesses
- unfavorable ROIC compared to WACC
- high debt-to-assets ratio at 71.93%
- weak liquidity with current ratio near 0.01
Opportunities
- expanding renewable energy investments
- growth potential in international markets like Mexico
- regulatory support for cleaner energy transition
Threats
- regulatory and political risks in cross-border operations
- exposure to volatile energy prices
- rising interest expenses impacting profitability
Sempra’s strengths in scale and margin provide a solid base, but its poor capital efficiency and liquidity pose risks. Strategic focus should target debt reduction and leveraging growth in renewables to enhance long-term value.
Stock Price Action Analysis
The upcoming weekly chart illustrates Sempra’s stock price performance over the past 12 months, highlighting key movements and volatility:

Trend Analysis
Over the past year, Sempra’s stock gained 35%, indicating a strong bullish trend with accelerating momentum. The price ranged from a low of 65.88 to a high of 95.2, supported by elevated volatility (7.43 std deviation), confirming robust upward dynamics.
Volume Analysis
Trading volume has increased, with buyers accounting for 53.78% overall. In the recent three months, buyer dominance slightly strengthened to 54.52%, suggesting cautious but growing investor confidence and steady market participation.
Target Prices
Analysts set a consensus target price reflecting moderate optimism for Sempra.
| Target Low | Target High | Consensus |
|---|---|---|
| 89 | 112 | 100.88 |
The target range suggests expectations of upside potential near 10% from current levels, balanced against market volatility risks.

Don’t Let Luck Decide Your Entry Point
Optimize your entry points with our advanced ProRealTime indicators. You’ll get efficient buy signals with precise price targets for maximum performance. Start outperforming now!
Analyst & Consumer Opinions
This section examines Sempra’s recent analyst ratings alongside consumer feedback to gauge market sentiment and reputation.
Stock Grades
Below is a summary of recent stock grades for Sempra from leading financial institutions:
| Grading Company | Action | New Grade | Date |
|---|---|---|---|
| Barclays | Maintain | Overweight | 2026-02-03 |
| Morgan Stanley | Maintain | Overweight | 2026-02-02 |
| UBS | Maintain | Neutral | 2026-01-22 |
| Barclays | Maintain | Overweight | 2026-01-22 |
| Wells Fargo | Maintain | Overweight | 2026-01-20 |
| UBS | Maintain | Neutral | 2025-12-17 |
| Citigroup | Maintain | Neutral | 2025-11-24 |
| Goldman Sachs | Upgrade | Buy | 2025-11-14 |
| UBS | Maintain | Neutral | 2025-11-06 |
| Barclays | Maintain | Overweight | 2025-11-06 |
The overall trend reflects a strong buy consensus, with most firms maintaining overweight or neutral ratings and Goldman Sachs notably upgrading their grade. This pattern indicates steady confidence without recent downgrades.
Consumer Opinions
Consumer sentiment around Sempra reflects a mix of appreciation and frustration. Many praise its service reliability but express concerns about pricing.
| Positive Reviews | Negative Reviews |
|---|---|
| Reliable energy delivery with minimal outages | Customer service response times can lag |
| Transparent billing and clear statements | Rates have increased noticeably over the past year |
| Strong community involvement and environmental initiatives | Occasional billing errors reported by customers |
Overall, consumers value Sempra’s dependable service and community focus. However, rising rates and customer support delays remain consistent pain points. This feedback highlights areas for operational improvement amid a stable core offering.
Risk Analysis
Below is a table summarizing key risks affecting Sempra’s financial and operational outlook:
| Category | Description | Probability | Impact |
|---|---|---|---|
| Financial Health | Altman Z-score in distress zone signals high bankruptcy risk | High | High |
| Liquidity | Extremely low current and quick ratios indicate poor liquidity | High | Medium |
| Leverage | Debt-to-assets at 71.9% raises solvency concerns | Medium | High |
| Profitability | ROE and ROIC below WACC reflect weak capital returns | Medium | Medium |
| Market Valuation | Elevated P/E at 27.8 suggests overvaluation risk | Medium | Medium |
| Interest Coverage | Negative interest coverage signals difficulty servicing debt | Medium | High |
The most urgent risk is Sempra’s financial distress as shown by its Altman Z-score of 0.75, well below the safe threshold. Poor liquidity ratios and negative interest coverage amplify solvency concerns. While the Piotroski score of 7 indicates operational strength, high leverage and valuation multiples limit upside. Investors must weigh these risks carefully in the current interest rate environment.
Should You Buy Sempra?
Sempra appears to be a company with weakening profitability and a very unfavorable competitive moat, indicating value destruction. While its leverage profile seems moderate, the overall rating of B- suggests cautious optimism amid financial distress risks.
Strength & Efficiency Pillars
Sempra’s operational efficiency shows mixed signals. The company posts a solid net margin of 15.12%, indicating decent profitability on sales. However, return on equity stands at a low 5.34%, reflecting limited shareholder value generation. Critically, its ROIC is 0%, below the WACC of 5.61%, signaling value destruction rather than creation. Despite favorable gross margin at 52.1% and interest expense benefits, the absence of excess capital return marks a significant efficiency concern.
Weaknesses and Drawbacks
Sempra is in financial distress with an Altman Z-Score of 0.75, well below the 1.8 distress threshold, signaling a high bankruptcy risk. This solvency issue overshadows other weak metrics, including an unfavorable P/E ratio of 27.81, suggesting an expensive valuation relative to earnings. The company’s liquidity is critically poor, with a current ratio at 0.01, exposing it to short-term cash flow risks. High debt-to-assets at 71.93% further strains its financial stability amid weak interest coverage.
Our Final Verdict about Sempra
Despite operational profitability signals, Sempra’s Altman Z-Score firmly places it in the distress zone. This solvency risk makes the stock highly speculative and too risky for conservative capital. Investors should exercise caution, as the company’s financial health presents a significant threat that overshadows its income statement strengths and recent bullish price momentum.
Disclaimer: This content is for informational purposes only and does not constitute financial, investment, or other professional advice. Investing in financial markets involves a significant risk of loss, and past performance is not indicative of future results.
Additional Resources
- Sempra (SRE) Q4 Earnings and Revenues Surpass Estimates – Yahoo Finance (Feb 26, 2026)
- Did Sempra’s (SRE) Higher 2030 EPS Targets and Dividend Hike Just Recast Its Investment Narrative? – simplywall.st (Feb 27, 2026)
- Sempra Energy (NYSE:SRE) Receives Average Recommendation of “Moderate Buy” from Brokerages – MarketBeat (Feb 27, 2026)
- Sempra (SRE) Q4 2025 Earnings Call Transcript – The Globe and Mail (Feb 27, 2026)
- Decoding Sempra (SRE): A Strategic SWOT Insight – GuruFocus (Feb 27, 2026)
For more information about Sempra, please visit the official website: sempra.com