Home > Analyses > Technology > Seagate Technology Holdings plc
Seagate Technology Holdings plc revolutionizes how the world stores and accesses data, powering everything from enterprise servers to personal gaming setups. As a pioneer in computer hardware, Seagate commands leadership with its broad portfolio of high-capacity HDDs, SSDs, and innovative edge-to-cloud storage solutions. Renowned for quality and cutting-edge technology, the company shapes the future of data infrastructure. The key question remains: does Seagate’s robust foundation still support its premium market valuation and growth ambitions in a rapidly evolving tech landscape?
Table of contents
Business Model & Company Overview
Seagate Technology Holdings plc, founded in 1978 and headquartered in Dublin, Ireland, stands as a dominant player in the computer hardware industry. Its comprehensive ecosystem spans mass capacity storage solutions, including enterprise nearline HDDs and SSDs, external and legacy storage products, as well as innovative platforms like Lyve edge-to-cloud. This broad portfolio addresses diverse market needs, from OEMs to retailers, shaping how data is stored and accessed globally.
The company’s revenue engine balances sales of physical storage devices with strategic growth in software and cloud-enabled services, enabling recurring value creation. Seagate’s global footprint extends across the Americas, Europe, and Asia, supporting a varied customer base. Its robust integration of hardware and evolving software platforms creates a competitive advantage that fortifies its economic moat and positions the company at the forefront of the data storage industry’s future.
Financial Performance & Fundamental Metrics
In this section, I will analyze Seagate Technology Holdings plc’s income statement, key financial ratios, and dividend payout policy to assess its financial health and investment potential.
Income Statement
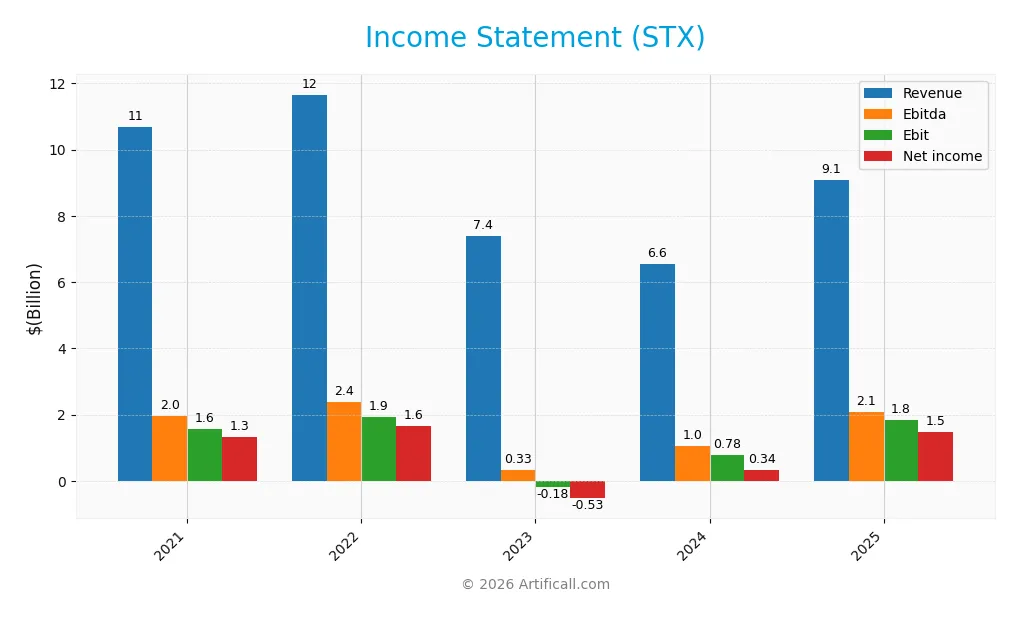
The table below presents Seagate Technology Holdings plc’s key income statement figures for fiscal years 2021 through 2025, reported in USD.
| 2021 | 2022 | 2023 | 2024 | 2025 | |
|---|---|---|---|---|---|
| Revenue | 10.7B | 11.7B | 7.4B | 6.6B | 9.1B |
| Cost of Revenue | 7.8B | 8.2B | 6.0B | 5.0B | 5.9B |
| Operating Expenses | 1.4B | 1.5B | 1.8B | 1.1B | 1.3B |
| Gross Profit | 2.9B | 3.5B | 1.4B | 1.5B | 3.2B |
| EBITDA | 2.0B | 2.4B | 330M | 1.0B | 2.1B |
| EBIT | 1.6B | 1.9B | -183M | 777M | 1.8B |
| Interest Expense | 220M | 249M | 313M | 332M | 321M |
| Net Income | 1.3B | 1.6B | -529M | 335M | 1.5B |
| EPS | 5.43 | 7.50 | -2.56 | 1.60 | 6.93 |
| Filing Date | 2021-08-06 | 2022-08-05 | 2023-08-04 | 2024-08-02 | 2025-08-01 |
Income Statement Evolution
Seagate Technology’s revenue showed a mixed trend with a 14.83% decline over 2021-2025, despite a strong 38.86% increase from 2024 to 2025. Net income grew by 11.8% overall, supported by a significant 215.78% net margin expansion in the last year. Margins improved notably, with gross margin at 35.18% and EBIT margin at 20.16%, reflecting better profitability.
Is the Income Statement Favorable?
The 2025 fiscal year features robust fundamentals with revenue at $9.1B and net income of $1.47B, marking a sharp recovery from prior years. Operating efficiency improved as operating expenses grew proportionally with revenue, supporting a favorable EBIT margin of 20.16%. Interest expense remains controlled at 3.53% of revenue, contributing to a strong net margin of 16.15%. Overall, the income statement shows predominantly favorable indicators.
Financial Ratios
The following table summarizes key financial ratios for Seagate Technology Holdings plc over the last five fiscal years:
| Ratios | 2021 | 2022 | 2023 | 2024 | 2025 |
|---|---|---|---|---|---|
| Net Margin | 12% | 14% | -7% | 5% | 16% |
| ROE | 2.1% | 15.1% | 0.4% | -0.2% | -3.2% |
| ROIC | 24% | 32% | -7% | 7% | 34% |
| P/E | 16.2 | 9.5 | -24.2 | 63.9 | 20.4 |
| P/B | 33.7 | 144.2 | -10.7 | -14.4 | -66.2 |
| Current Ratio | 1.29 | 1.13 | 1.12 | 1.08 | 1.38 |
| Quick Ratio | 0.88 | 0.69 | 0.68 | 0.68 | 0.84 |
| D/E | 8.2 | 52.3 | -4.9 | -3.8 | -11.9 |
| Debt-to-Assets | 60% | 64% | 77% | 73% | 67% |
| Interest Coverage | 6.8 | 7.9 | -1.1 | 1.4 | 5.9 |
| Asset Turnover | 1.23 | 1.30 | 0.98 | 0.85 | 1.13 |
| Fixed Asset Turnover | 4.69 | 5.00 | 4.33 | 4.06 | 5.49 |
| Dividend Yield | 3.0% | 3.9% | 4.5% | 2.7% | 2.0% |
Evolution of Financial Ratios
Over the 2021–2025 period, Seagate Technology’s Return on Equity (ROE) showed significant volatility, peaking positively in earlier years but turning sharply negative at -324.3% in 2025. Meanwhile, the Current Ratio improved steadily to 1.38 in 2025, indicating enhanced liquidity. The Debt-to-Equity Ratio fluctuated considerably, ending with a highly negative value of -11.86, reflecting unusual capital structure dynamics. Profitability margins notably improved in 2025, with net profit margin rising to 16.15%.
Are the Financial Ratios Favorable?
In 2025, Seagate’s financial ratios present a generally favorable outlook with 57.14% of key metrics positive. Profitability is strong, with a net margin of 16.15% and return on invested capital at 33.76%. Liquidity ratios such as the Current and Quick Ratios remain neutral around 1.38 and 0.84 respectively. Leverage indicators are mixed: the Debt-to-Equity ratio is favorable at -11.86, yet the Debt-to-Assets ratio is unfavorable at 66.97%. Market valuation metrics like the Price-to-Earnings ratio are neutral, while dividend yield stands favorably at 2.0%.
Shareholder Return Policy
Seagate Technology Holdings plc (STX) maintains a consistent dividend policy with a payout ratio around 40%, a stable dividend per share near 2.8 USD, and an annual yield close to 2%. These dividends are supported by a solid free cash flow coverage ratio of approximately 75%, reflecting a disciplined distribution approach. The company also engages in share buybacks, complementing its shareholder return strategy.
This balanced combination of dividends and buybacks appears sustainable given STX’s positive net income and operating cash flow margins. While the payout ratio leaves room for reinvestment, the approach offers a moderate income stream to shareholders without compromising long-term value creation, assuming continued operational profitability and cash flow generation.
Score analysis
The following radar chart presents the evaluation scores for Seagate Technology Holdings plc across several key financial metrics:
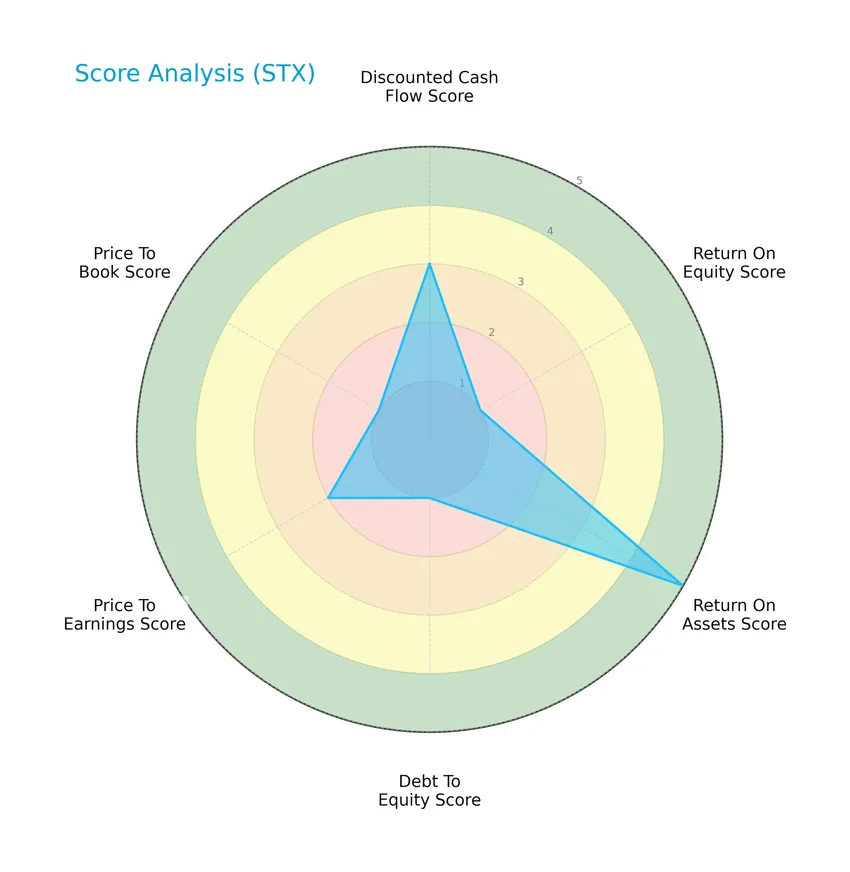
The company shows a mixed financial profile: a moderate discounted cash flow score (3), very unfavorable return on equity (1) and debt-to-equity (1) scores, but a very favorable return on assets score (5). Price-to-earnings (2) and price-to-book (1) scores remain moderate to unfavorable.
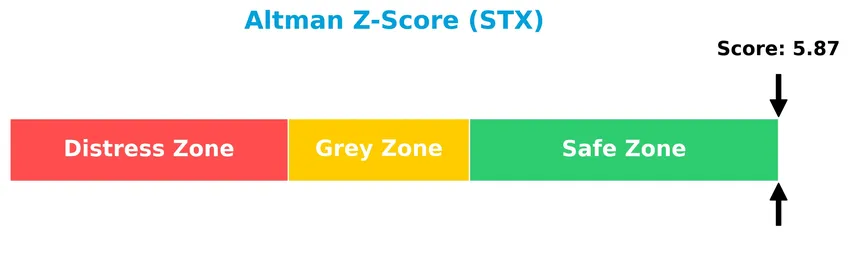
Analysis of the company’s bankruptcy risk
Seagate Technology Holdings plc’s Altman Z-Score indicates a strong financial position well within the safe zone, suggesting low risk of bankruptcy:
Is the company in good financial health?
The Piotroski Score diagram illustrates the company’s financial strength based on nine fundamental criteria:
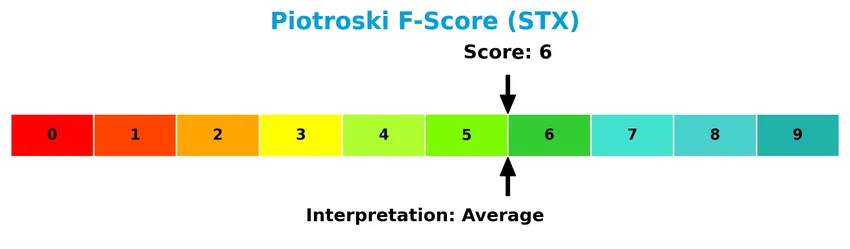
With a Piotroski Score of 6, Seagate Technology Holdings plc demonstrates average financial health, signaling moderate strength but room for improvement in key operational and profitability factors.
Competitive Landscape & Sector Positioning
This sector analysis will examine Seagate Technology Holdings plc’s strategic position, revenue segments, key products, main competitors, competitive advantages, and a SWOT analysis. I will assess whether Seagate holds a competitive advantage over its industry peers in the technology sector.
Strategic Positioning
Seagate Technology Holdings plc operates a diversified product portfolio in data storage, spanning HDDs, SSDs, external storage, and cloud platforms. Geographically, its revenues are primarily concentrated in the United States and Singapore, with significant exposure in the Netherlands and limited presence in other countries, reflecting a focused yet international footprint.
Key Products & Brands
The table below outlines Seagate Technology’s main product lines and brand offerings:
| Product | Description |
|---|---|
| Enterprise Nearline HDDs | High-capacity hard disk drives designed for enterprise storage needs with nearline performance. |
| Enterprise Nearline SSDs | Solid state drives for enterprise applications requiring speed and reliability. |
| Enterprise Nearline Systems | Integrated storage systems combining HDDs and SSDs for enterprise use. |
| Video and Image HDDs | Hard drives optimized for video recording and image storage applications. |
| Network-Attached Storage Drives | Storage drives configured for network-attached storage solutions, enhancing data accessibility. |
| Mission Critical HDDs and SSDs | Legacy storage products designed for mission-critical applications, ensuring high reliability. |
| External Storage Solutions | Consumer external drives under Seagate Ultra Touch, One Touch, Expansion lines, and LaCie brand. |
| Desktop Drives | Storage drives intended for desktop computer use. |
| Notebook Drives | Storage drives designed for notebook and portable computers. |
| DVR HDDs | Hard drives specialized for digital video recorder applications. |
| Gaming SSDs | Solid state drives tailored for gaming performance requirements. |
| Lyve Edge-to-Cloud Platform | A mass capacity platform facilitating data storage from edge devices to cloud infrastructure. |
Seagate Technology offers a broad portfolio of storage hardware and systems, serving enterprise and consumer markets globally, with notable brands and specialized products enhancing data storage and management solutions.
Main Competitors
In the Technology sector’s Computer Hardware industry, there are 12 competitors, with the table below showing the top 10 leaders by market capitalization:
| Competitor | Market Cap. |
|---|---|
| Arista Networks, Inc. | 168B |
| Dell Technologies Inc. | 86B |
| Western Digital Corporation | 65B |
| Seagate Technology Holdings plc | 61B |
| Pure Storage, Inc. | 22B |
| NetApp, Inc. | 21B |
| HP Inc. | 21B |
| Super Micro Computer, Inc. | 18B |
| IonQ, Inc. | 16B |
| D-Wave Quantum Inc. | 9B |
Seagate Technology Holdings plc ranks 4th among its competitors, with a market cap about 44% the size of the leader, Arista Networks. Its capitalization is above both the average market cap of the top 10 (49B) and the sector median (21B). The company maintains an 11.82% gap below the next larger competitor, Western Digital, highlighting a moderate distance from its closest rival above.
Does STX have a competitive advantage?
Seagate Technology Holdings plc (STX) presents a clear competitive advantage, evidenced by a very favorable moat status with a ROIC exceeding WACC by 22.7%, alongside a 39.6% rising ROIC trend, indicating efficient capital use and value creation. The company maintains favorable profitability margins, including a 16.15% net margin and strong income growth metrics over the recent fiscal year.
Looking ahead, STX’s competitive position may benefit from its diverse product portfolio spanning enterprise HDDs, SSDs, and innovative storage solutions like the Lyve edge-to-cloud platform. Its geographic revenue expansion, especially strong in the United States and Singapore, suggests opportunities for growth in established and emerging markets.
Comparisons with competitors
Check out how we compare the company to its competitors:
SWOT Analysis
This SWOT analysis highlights Seagate Technology Holdings plc’s key internal and external factors to consider for strategic investment decisions.
Strengths
- strong profitability with 16.15% net margin
- durable competitive advantage with growing ROIC
- global presence with diversified revenue streams
Weaknesses
- negative return on equity indicating inefficient equity use
- high debt-to-assets ratio at 66.97%
- moderate liquidity ratios limiting financial flexibility
Opportunities
- expanding demand for data storage in cloud and edge computing
- growth in enterprise SSD and nearline HDD markets
- potential to leverage Lyve edge-to-cloud platform
Threats
- intense competition in data storage industry
- rapid technological changes requiring continuous innovation
- geopolitical risks impacting global supply chain
Overall, Seagate demonstrates robust profitability and a clear competitive moat, but investors should watch its leverage and equity returns. The company’s strategy should focus on innovation and managing debt to capitalize on growing data storage needs while mitigating industry risks.
Stock Price Action Analysis
The weekly stock chart for Seagate Technology Holdings plc (STX) illustrates price movements and trading patterns over the past 100 weeks:
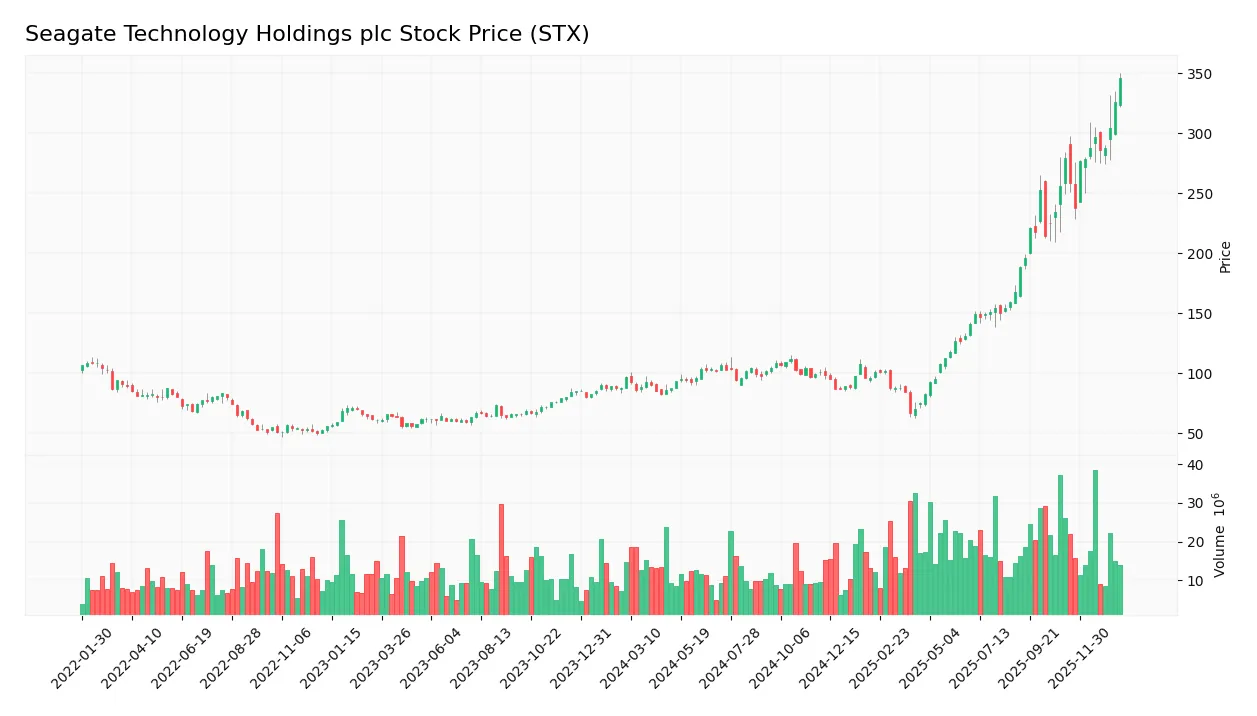
Trend Analysis
Over the past 100 weeks, STX’s stock price increased by 256.22%, indicating a bullish trend with acceleration. The price ranged from a low of 66.73 to a high of 346.1, with a standard deviation of 68.87 highlighting notable volatility. Recent data from 2025-11-09 to 2026-01-25 shows a 23.89% gain, confirming the upward momentum with moderate volatility.
Volume Analysis
Trading volume is increasing, with a total of 1.83B shares traded overall and buyer volume representing 67.82%. In the recent period (2025-11-09 to 2026-01-25), buyer dominance strengthened to 78.18%, indicating strong buyer-driven activity and increased market participation.
Target Prices
The current analyst consensus for Seagate Technology Holdings plc (STX) shows a moderate upside potential.
| Target High | Target Low | Consensus |
|---|---|---|
| 400 | 270 | 329.43 |
Analysts expect Seagate’s stock price to trade between 270 and 400, with a consensus target around 329, indicating cautious optimism in the medium term.
Analyst & Consumer Opinions
This section reviews analyst ratings and consumer feedback to provide insight into Seagate Technology Holdings plc’s market perception.

Don’t Let Luck Decide Your Entry Point
Optimize your entry points with our advanced ProRealTime indicators. You’ll get efficient buy signals with precise price targets for maximum performance. Start outperforming now!
Stock Grades
Here are the latest verified analyst grades for Seagate Technology Holdings plc, reflecting current market sentiment and consensus:
| Grading Company | Action | New Grade | Date |
|---|---|---|---|
| Morgan Stanley | Maintain | Overweight | 2026-01-22 |
| UBS | Maintain | Neutral | 2026-01-20 |
| Citigroup | Maintain | Buy | 2026-01-20 |
| Rosenblatt | Maintain | Buy | 2026-01-20 |
| B of A Securities | Maintain | Buy | 2026-01-20 |
| Susquehanna | Upgrade | Neutral | 2026-01-16 |
| Wells Fargo | Maintain | Equal Weight | 2026-01-15 |
The overall distribution favors a Hold consensus, supported by a near-even split between Buy and Hold ratings, with few Sell opinions, indicating moderate confidence with cautious optimism among analysts.
Consumer Opinions
Seagate Technology Holdings plc (STX) enjoys a generally positive reputation among consumers, reflecting solid product performance and reliable customer support.
| Positive Reviews | Negative Reviews |
|---|---|
| “Seagate’s hard drives offer excellent durability and speed, perfect for data-intensive tasks.” | “Some models have experienced premature failure within the warranty period.” |
| “Customer service was responsive and helpful when I needed assistance.” | “Occasional firmware issues caused disruptions in data access.” |
| “Competitive pricing with consistent product quality makes Seagate a go-to brand.” | “The noise level of certain external drives can be distracting.” |
Overall, consumers appreciate Seagate’s durable and high-performance storage solutions alongside responsive support. However, concerns about occasional hardware failures and firmware bugs suggest some risk to consider.
Risk Analysis
Below is a table summarizing key risks associated with investing in Seagate Technology Holdings plc (STX):
| Category | Description | Probability | Impact |
|---|---|---|---|
| Financial Health | High debt-to-assets ratio (66.97%) poses leverage risk despite favorable Altman Z-Score (5.87). | Medium | High |
| Profitability | Negative return on equity (-324.28%) signals potential inefficiencies and shareholder risk. | High | High |
| Market Volatility | Beta of 1.619 indicates above-average stock price volatility relative to the market. | High | Medium |
| Liquidity | Neutral current (1.38) and quick ratios (0.84) suggest moderate liquidity constraints. | Medium | Medium |
| Competitive Tech | Rapid innovation in data storage technology may pressure Seagate’s market share long term. | Medium | High |
The most concerning risks are Seagate’s negative ROE reflecting profitability challenges and its high leverage, which increase financial vulnerability. However, a strong Altman Z-Score indicates a low bankruptcy risk currently. Market volatility also demands cautious position sizing for investors.
Should You Buy Seagate Technology Holdings plc?
Seagate Technology Holdings plc appears to be generating strong value creation with a durable competitive moat supported by growing ROIC. While the leverage profile could be seen as substantial, the overall rating of C+ suggests a moderate investment profile within a safe financial zone.
Strength & Efficiency Pillars
Seagate Technology Holdings plc exhibits strong profitability and financial health, underscored by a net margin of 16.15% and an EBIT margin of 20.16%. The company is a clear value creator, with a return on invested capital (ROIC) of 33.76% significantly exceeding its weighted average cost of capital (WACC) at 11.09%. This sizable spread confirms efficient capital allocation and durable competitive advantages. Additionally, a robust Altman Z-Score of 5.87 places the firm securely in the safe zone, while a Piotroski score of 6 denotes average but stable financial strength.
Weaknesses and Drawbacks
Despite favorable profitability, several valuation and leverage metrics raise concerns. The price-to-earnings ratio stands at 20.41, reflecting moderate market expectations, but a highly negative price-to-book ratio of -66.19 signals potential accounting or valuation anomalies that warrant caution. Leverage indicators are mixed; while the debt-to-equity ratio is favorably negative at -11.86, a high debt-to-assets ratio of 66.97% indicates significant asset financing through debt, which could elevate financial risk. Liquidity ratios are neutral but suggest only moderate short-term buffer, and seller volume, though currently subdued, still requires monitoring.
Our Verdict about Seagate Technology Holdings plc
Seagate presents a fundamentally favorable long-term profile supported by strong profitability and value creation metrics. The bullish overall stock trend, coupled with recent strong buyer dominance at 78.18%, suggests positive market sentiment and momentum. This combination may make the company appear attractive for long-term exposure, though investors should remain vigilant about valuation inconsistencies and leverage risks that could introduce volatility or downside pressure.
Disclaimer: This content is for informational purposes only and does not constitute financial, investment, or other professional advice. Investing in financial markets involves a significant risk of loss, and past performance is not indicative of future results.
Additional Resources
- Assessing Seagate Technology Holdings (STX) Valuation After Analyst Upgrades And AI Storage Showcase At Intersec 2026 – simplywall.st (Jan 25, 2026)
- Seagate Technology Holdings PLC $STX Shares Sold by QRG Capital Management Inc. – MarketBeat (Jan 21, 2026)
- BofA Maintains Buy on Seagate Technology Holdings (STX) Stock, Raises PT – MSN (Jan 22, 2026)
- Seagate (STX) Pivots to AI-Centric Storage: Evolution in Moat or Just Marketing Shift? – Sahm (Jan 23, 2026)
- Fund Update: 560,925 SEAGATE TECHNOLOGY PLC (STX) shares added to KBC Group NV portfolio – Quiver Quantitative (Jan 20, 2026)
For more information about Seagate Technology Holdings plc, please visit the official website: seagate.com