Home > Analyses > Technology > Sanmina Corporation
Sanmina Corporation drives the backbone of modern technology by delivering integrated manufacturing solutions that power industries from medical to aerospace. Renowned for its precision engineering, advanced logistics, and innovative product design, Sanmina stands as a key enabler for original equipment manufacturers worldwide. As it navigates a competitive landscape with a diversified portfolio, the critical question remains: does Sanmina’s current financial and operational strength justify its market valuation and growth prospects in the evolving tech ecosystem?

Table of contents
Business Model & Company Overview
Sanmina Corporation, founded in 1980 and headquartered in San Jose, California, stands as a leader in the hardware, equipment, and parts industry. It delivers a cohesive ecosystem of integrated manufacturing solutions, combining product design, engineering, assembly, and after-market services. With a workforce of 32,000, Sanmina supports original equipment manufacturers across diverse sectors such as industrial, medical, defense, aerospace, automotive, communications, and cloud solutions.
The company’s revenue engine balances high-value hardware manufacturing with software-driven supply chain management and cloud-based manufacturing execution systems. Sanmina operates globally, with strategic footprints across the Americas, Europe, and Asia, enabling direct order fulfillment and logistics services worldwide. Its robust presence and comprehensive capabilities create a durable economic moat, positioning it at the forefront of shaping the future of advanced manufacturing.
Financial Performance & Fundamental Metrics
In this section, I analyze Sanmina Corporation’s income statement, key financial ratios, and dividend payout policy to assess its financial health and investment potential.
Income Statement
The table below presents Sanmina Corporation’s key income statement figures for fiscal years 2021 through 2025, illustrating trends in revenue, profitability, and earnings per share.

| 2021 | 2022 | 2023 | 2024 | 2025 | |
|---|---|---|---|---|---|
| Revenue | 6.74B | 7.92B | 8.94B | 7.57B | 8.13B |
| Cost of Revenue | 6.21B | 7.30B | 8.19B | 6.93B | 7.41B |
| Operating Expenses | 271M | 273M | 288M | 305M | 362M |
| Gross Profit | 526M | 622M | 743M | 640M | 716M |
| EBITDA | 411M | 434M | 567M | 469M | 463M |
| EBIT | 301M | 325M | 449M | 347M | 344M |
| Interest Expense | 19.6M | 22.5M | 36.3M | 29.2M | 4.3M |
| Net Income | 250M | 240M | 310M | 223M | 246M |
| EPS | 4.12 | 4.18 | 5.36 | 4.00 | 4.56 |
| Filing Date | 2021-11-12 | 2022-11-10 | 2023-11-16 | 2024-11-27 | 2025-11-13 |
Income Statement Evolution
Sanmina Corporation’s revenue showed a favorable overall growth of 20.63% from 2021 to 2025, with a 7.4% increase in the last year, indicating steady top-line expansion. However, net income declined slightly by 1.46% over the full period, and net margin decreased by 18.31%, reflecting some pressure on profitability despite a favorable 11.86% growth in gross profit last year. Margins overall remained neutral, with gross and EBIT margins stable.
Is the Income Statement Favorable?
In 2025, Sanmina reported $8.13B in revenue and a net income of $246M, yielding a net margin of 3.03%, classified as neutral. Although EBIT declined slightly by 0.86%, EPS grew strongly by 14.07%, suggesting improved shareholder returns. Interest expenses were low, deemed favorable at 0.05% of revenue. The combination of mixed margin trends and positive EPS growth results in a generally favorable income statement assessment for the most recent fiscal year.
Financial Ratios
The table below presents key financial ratios for Sanmina Corporation across fiscal years 2021 to 2025, providing an overview of profitability, valuation, liquidity, leverage, efficiency, and dividend metrics:
| Ratios | 2021 | 2022 | 2023 | 2024 | 2025 |
|---|---|---|---|---|---|
| Net Margin | 3.7% | 3.0% | 3.5% | 2.9% | 3.0% |
| ROE | 13.3% | 13.2% | 14.3% | 10.1% | 10.4% |
| ROIC | 9.1% | 11.6% | 12.5% | 8.6% | 9.1% |
| P/E | 10.4 | 11.8 | 10.1 | 17.1 | 25.6 |
| P/B | 1.38 | 1.55 | 1.45 | 1.73 | 2.67 |
| Current Ratio | 1.86 | 1.57 | 1.91 | 1.99 | 1.72 |
| Quick Ratio | 1.27 | 0.89 | 1.18 | 1.25 | 1.02 |
| D/E | 0.21 | 0.23 | 0.19 | 0.17 | 0.13 |
| Debt-to-Assets | 9.2% | 8.5% | 8.6% | 8.0% | 5.1% |
| Interest Coverage | 13.1 | 15.6 | 12.6 | 11.5 | 82.5 |
| Asset Turnover | 1.60 | 1.64 | 1.83 | 1.57 | 1.39 |
| Fixed Asset Turnover | 11.2 | 12.1 | 12.3 | 10.9 | 11.9 |
| Dividend Yield | 0% | 0% | 0% | 0% | 0% |
Evolution of Financial Ratios
Between 2021 and 2025, Sanmina Corporation’s Return on Equity (ROE) showed variability, peaking near 14.3% in 2023 before declining to approximately 10.45% in 2025, indicating moderated profitability. The Current Ratio fluctuated but remained above 1.5, signaling consistent liquidity with a slight dip to 1.72 in 2025. The Debt-to-Equity Ratio steadily decreased from about 0.21 in 2021 to 0.13 in 2025, reflecting reduced leverage and improved financial stability.
Are the Financial Ratios Fovorable?
In 2025, Sanmina’s financial ratios present a mixed picture. Profitability metrics such as net margin (3.03%) and price-to-earnings ratio (25.59) are classified as unfavorable, while ROE (10.45%) and return on invested capital (9.11%) are neutral. Liquidity ratios, including a current ratio of 1.72 and quick ratio of 1.02, are favorable, indicating solid short-term financial health. Low leverage ratios, with debt-to-equity at 0.13 and debt-to-assets at 5.13%, alongside a high interest coverage ratio near 80, suggest strong debt management. Overall, half of the assessed ratios are favorable, supporting a slightly favorable global evaluation.
Shareholder Return Policy
Sanmina Corporation (SANM) does not pay dividends, reflecting a strategic choice likely aimed at reinvestment or growth rather than immediate shareholder payouts. Despite zero dividend yield and payout ratio, the company maintains positive net income and free cash flow, with no evidence of share buybacks.
This distribution approach appears consistent with sustainable long-term value creation, as Sanmina preserves capital for operational needs and potential investments. The absence of dividends combined with no buyback activity suggests a focus on strengthening financial health rather than returning cash to shareholders currently.
Score analysis
The following radar chart illustrates key financial scores for Sanmina Corporation, reflecting various valuation and performance metrics:
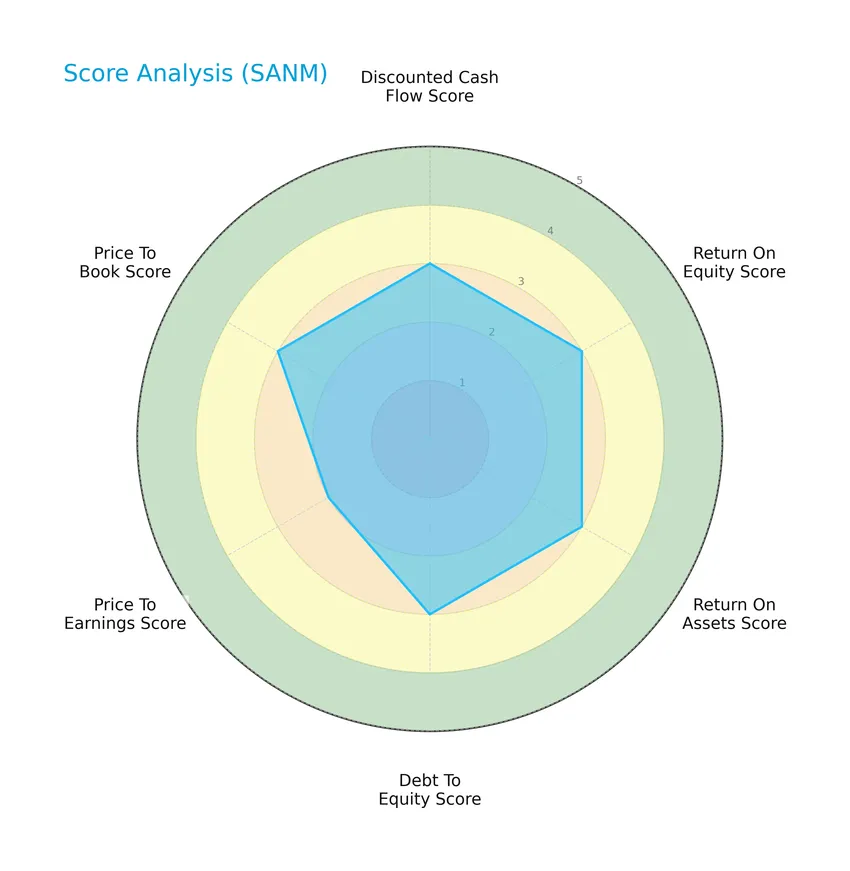
Sanmina Corporation presents moderate scores across discounted cash flow, return on equity, return on assets, debt to equity, and price to book ratios, with a slightly lower price to earnings score, indicating balanced but cautious valuation metrics.
Analysis of the company’s bankruptcy risk
Sanmina Corporation’s Altman Z-Score places it in the safe zone, indicating a low risk of bankruptcy and financial distress:

Is the company in good financial health?
The Piotroski Score diagram below provides insight into the company’s financial strength and operational efficiency:

With a strong Piotroski Score of 7, Sanmina Corporation demonstrates solid financial health, suggesting effective management and sound fundamentals within the company’s financial statements.
Competitive Landscape & Sector Positioning
This sector analysis will explore Sanmina Corporation’s strategic positioning, revenue by segment, key products, main competitors, competitive advantages, and SWOT analysis. I will assess whether Sanmina holds a competitive advantage over its industry peers in the technology hardware and equipment sector.
Strategic Positioning
Sanmina Corporation diversifies its revenue across two main segments: Integrated Manufacturing Solutions (IMS) generating $6.5B and Components, Products and Services (CPS) at $1.6B in 2025. Geographically, it spans Americas ($4.7B), Asia Pacific ($2.6B), and EMEA ($0.9B), reflecting broad industrial exposure.
Revenue by Segment
The pie chart illustrates Sanmina Corporation’s revenue distribution by segment for fiscal year 2025, highlighting the contribution of each business area to total sales.
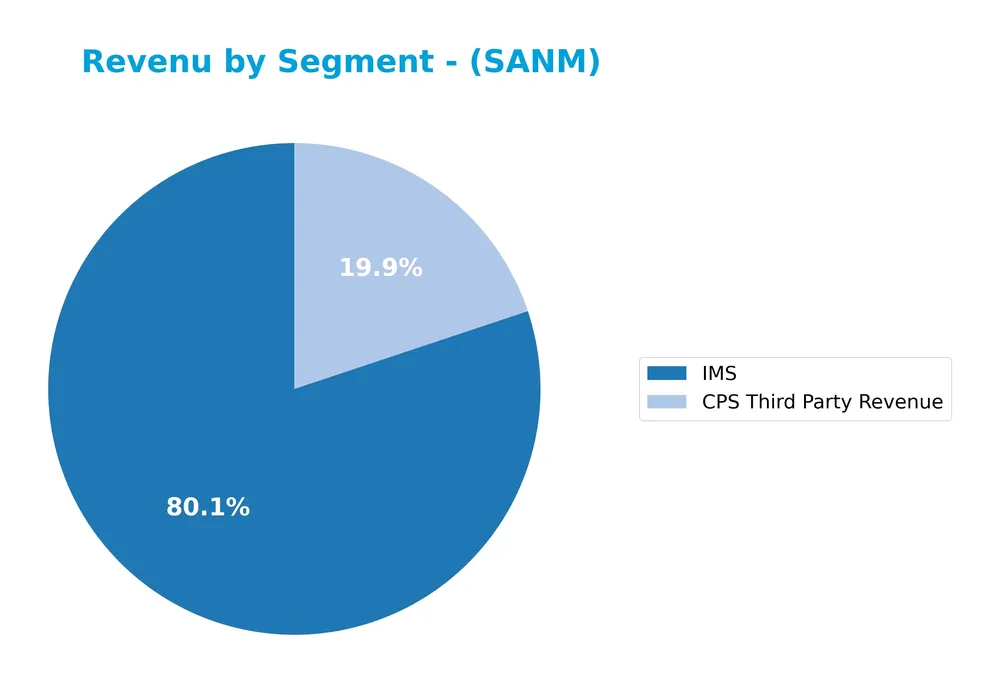
In 2025, IMS remains the dominant segment with $6.5B in revenue, showing steady growth from $5.5B in 2021. CPS Third Party Revenue contributes significantly less at $1.6B but has shown gradual increases since 2021. The data indicates a concentration of revenue in IMS, suggesting the business relies heavily on this segment, with CPS providing a stable secondary source. There are no recent signs of diversification acceleration or notable shifts between segments.
Key Products & Brands
The following table outlines Sanmina Corporation’s main products and brands with their descriptions:
| Product | Description |
|---|---|
| Integrated Manufacturing Solutions (IMS) | Comprehensive manufacturing services including product design, engineering, prototyping, validation, assembly, testing, and supply chain management. |
| Components, Products and Services (CPS) | Manufacturing of components, subassemblies, complete systems, interconnect systems, mechanical systems, memory/storage platforms, and RF/optical/microelectronic solutions. |
Sanmina Corporation operates primarily through two segments: Integrated Manufacturing Solutions, offering end-to-end manufacturing and design services, and Components, Products and Services, focusing on the production of electronic and mechanical components for diverse industries.
Main Competitors
There are 20 competitors in the Technology sector of Hardware, Equipment & Parts, with the table below listing the top 10 leaders by market capitalization:
| Competitor | Market Cap. |
|---|---|
| Amphenol Corporation | 171B |
| Corning Incorporated | 77.7B |
| TE Connectivity Ltd. | 68.6B |
| Sandisk Corporation | 40.0B |
| Garmin Ltd. | 38.9B |
| Keysight Technologies, Inc. | 35.5B |
| Celestica Inc. | 34.0B |
| Coherent, Inc. | 28.7B |
| Jabil Inc. | 25.7B |
| Teledyne Technologies Incorporated | 24.4B |
Sanmina Corporation ranks 15th among 20 competitors, with a market cap approximately 5.7% that of the leader, Amphenol Corporation. It sits below both the average market cap of the top 10 competitors (54.4B) and the median market cap in its sector (21.6B). The company’s market cap is 10.62% less than its nearest competitor above, indicating a moderate gap in scale relative to competitors immediately ahead.
Comparisons with competitors
Check out how we compare the company to its competitors:
Does SANM have a competitive advantage?
Sanmina Corporation currently does not present a clear competitive advantage, as its return on invested capital (ROIC) is slightly below its weighted average cost of capital (WACC), indicating value is being shed. The company’s ROIC trend is declining, reflecting decreasing profitability and an overall slightly unfavorable moat status from 2021 to 2025.
Looking ahead, Sanmina’s presence across diverse geographic markets including the Americas, Asia Pacific, and EMEA provides opportunities for growth. Its broad portfolio in integrated manufacturing solutions and components for industries such as industrial, medical, defense, aerospace, automotive, and cloud solutions suggests potential for expanding product offerings and market reach.
SWOT Analysis
This SWOT analysis provides a clear overview of Sanmina Corporation’s internal strengths and weaknesses alongside external opportunities and threats to guide investment decisions.
Strengths
- diversified global manufacturing footprint
- strong product design and engineering capabilities
- favorable liquidity and low debt levels
Weaknesses
- modest net margin of 3.03%
- declining ROIC trend
- limited dividend yield
Opportunities
- growing demand in industrial and medical sectors
- expansion in cloud-based manufacturing solutions
- increasing revenue in Americas and Asia Pacific
Threats
- intense competition in hardware and electronics
- supply chain disruptions impact
- geopolitical risks affecting EMEA region
Sanmina shows solid operational capabilities and financial health but faces profitability challenges and value erosion. Strategic focus on innovation and geographic expansion could capture growth while addressing margin improvement and external risks remains critical.
Stock Price Action Analysis
The weekly chart illustrates Sanmina Corporation’s stock price movement over the past 100 weeks, highlighting key price fluctuations and trend developments:
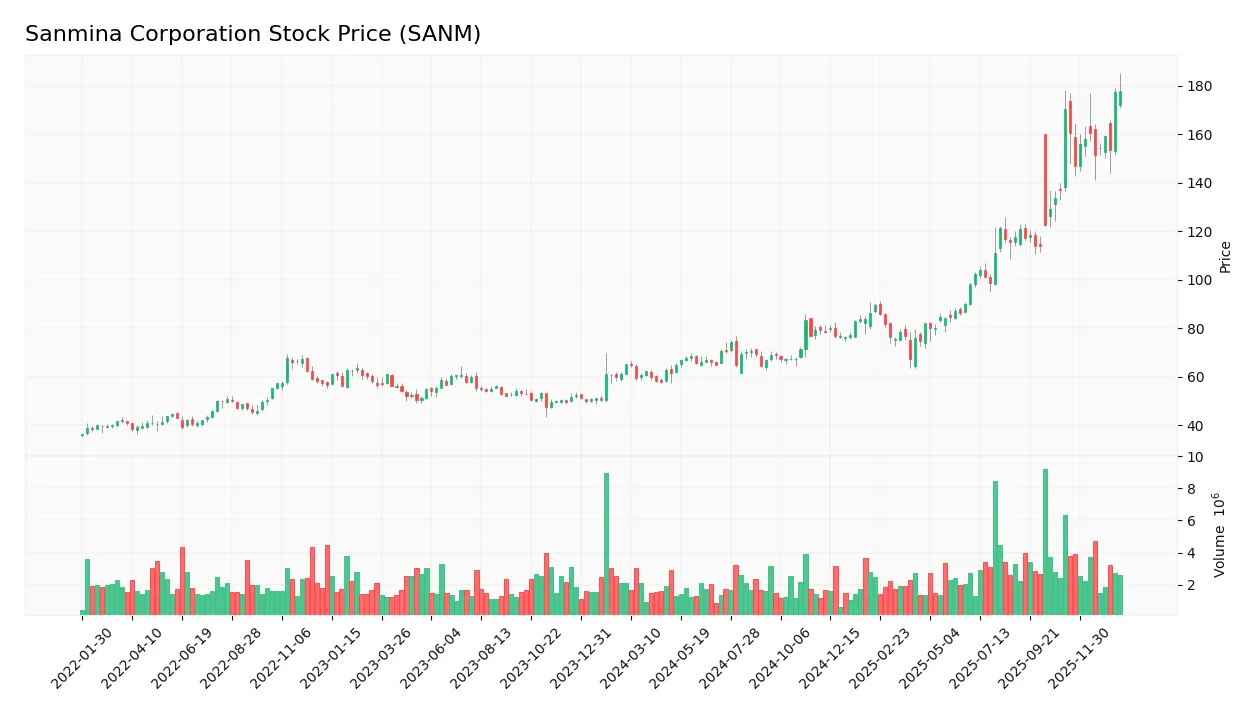
Trend Analysis
Over the past twelve months, Sanmina’s stock price increased by 173.21%, indicating a strong bullish trend. The price accelerated upward with a standard deviation of 31.56, reaching a high of 177.83 and a low of 57.79. Recent weeks show a continued moderate bullish trend with a 4.42% rise and a trend slope of 0.97.
Volume Analysis
Trading volume over the last three months is increasing, with a total volume of 39.13M shares traded. Buyer volume dominates at 60.04%, suggesting buyer-driven activity. This rising volume and buyer dominance indicate growing market participation and positive investor sentiment toward SANM stock.
Target Prices
The consensus target price for Sanmina Corporation (SANM) reflects a unified expectation among analysts.
| Target High | Target Low | Consensus |
|---|---|---|
| 62 | 62 | 62 |
Analysts project a steady target price of $62, indicating a consistent outlook with limited variability in expectations.

Don’t Let Luck Decide Your Entry Point
Optimize your entry points with our advanced ProRealTime indicators. You’ll get efficient buy signals with precise price targets for maximum performance. Start outperforming now!
Analyst & Consumer Opinions
This section reviews analyst ratings and consumer feedback to provide insights on Sanmina Corporation’s market perception.
Stock Grades
Here is a summary of the recent grades assigned to Sanmina Corporation by recognized analysts and grading firms:
| Grading Company | Action | New Grade | Date |
|---|---|---|---|
| B of A Securities | Maintain | Neutral | 2025-07-11 |
| B of A Securities | Maintain | Neutral | 2025-06-09 |
| B of A Securities | Upgrade | Neutral | 2025-01-29 |
| Craig-Hallum | Maintain | Hold | 2024-11-05 |
| Craig-Hallum | Downgrade | Hold | 2024-04-30 |
| Sidoti & Co. | Upgrade | Buy | 2022-11-08 |
| Sidoti & Co. | Upgrade | Buy | 2022-11-07 |
| Sidoti & Co. | Downgrade | Neutral | 2022-10-31 |
| Sidoti & Co. | Downgrade | Neutral | 2022-10-30 |
| Craig-Hallum | Maintain | Buy | 2022-08-02 |
Overall, the grades show a mixed but generally cautious sentiment, with several neutral and hold ratings prevailing in recent updates, reflecting a balanced outlook among analysts. Notably, upgrades and downgrades have occurred within short periods, indicating some volatility in analyst confidence.
Consumer Opinions
Sanmina Corporation receives a mix of praise and criticism, reflecting diverse consumer experiences with its products and services.
| Positive Reviews | Negative Reviews |
|---|---|
| High-quality manufacturing and reliable product output | Occasional delays in delivery impacting projects |
| Responsive customer service with knowledgeable staff | Some customers report issues with after-sales support |
| Competitive pricing compared to industry peers | Limited customization options for specialized needs |
Overall, consumers appreciate Sanmina’s product quality and service responsiveness, though delivery delays and after-sales support inconsistencies are notable concerns that the company should address to enhance customer satisfaction.
Risk Analysis
The table below summarizes key risks Sanmina Corporation faces, highlighting their likelihood and potential impact on investment outcomes:
| Category | Description | Probability | Impact |
|---|---|---|---|
| Market Volatility | Stock price fluctuates within a wide range (63.67 to 185.29 USD), reflecting market sensitivity | Medium | Medium |
| Profitability Risk | Unfavorable net margin of 3.03% may limit earnings growth | High | High |
| Valuation Risk | Elevated PE ratio of 25.59 suggests stock may be overvalued | Medium | Medium |
| Dividend Policy | No dividend paid, potentially reducing appeal for income-focused investors | High | Low |
| Industry Exposure | Operation in hardware and manufacturing subject to supply chain disruptions | Medium | High |
| Financial Health | Favorable Altman Z-score (3.18) indicates low bankruptcy risk | Low | High |
| Leverage Risk | Low debt-to-equity ratio (0.13) reduces financial risk | Low | Medium |
Sanmina’s most significant risks stem from its modest profitability and valuation concerns amid market fluctuations. However, its strong financial health and low leverage mitigate bankruptcy risk, making cautious investment viable with attention to industry cycles and earnings performance.
Should You Buy Sanmina Corporation?
Sanmina Corporation appears to be a moderately profitable company with a slightly unfavorable competitive moat, reflecting declining value creation. Its leverage profile is manageable, supported by a safe Altman Z-Score and a strong Piotroski Score, resulting in an overall B rating.
Strength & Efficiency Pillars
Sanmina Corporation exhibits solid financial health, supported by an Altman Z-Score of 3.18, placing it securely in the safe zone and indicating low bankruptcy risk. The Piotroski Score of 7 further confirms strong fundamentals. Profitability metrics are moderate, with a return on equity (ROE) of 10.45% and return on invested capital (ROIC) at 9.11%, slightly above the weighted average cost of capital (WACC) of 8.62%, suggesting cautious value creation. Favorable leverage ratios, including a debt-to-equity of 0.13 and interest coverage of 80.01, reinforce the company’s financial stability and operational efficiency.
Weaknesses and Drawbacks
Despite strengths, Sanmina faces valuation and margin challenges. The price-to-earnings ratio of 25.59 signals a relatively high market premium, which may pressure future returns. Net margin remains low at 3.03%, marked as unfavorable, reflecting modest profitability. Operating expense growth of 7.4% outpaces revenue growth, weighing on EBIT, which declined by 0.86% over the past year. The absence of dividend yield could deter income-focused investors. These factors, combined with a neutral price-to-book ratio of 2.67, suggest cautious valuation amid operational headwinds.
Our Verdict about Sanmina Corporation
Sanmina’s long-term fundamental profile appears favorable, supported by strong financial health and moderate profitability. The bullish overall price trend and buyer dominance in recent trading reinforce positive market sentiment. Consequently, the profile might appear attractive for long-term exposure. However, investors should remain mindful of margin pressures and premium valuation, which could warrant a measured, risk-aware approach.
Disclaimer: This content is for informational purposes only and does not constitute financial, investment, or other professional advice. Investing in financial markets involves a significant risk of loss, and past performance is not indicative of future results.
Additional Resources
- Sanmina (SANM) Q4 Earnings Report Preview: What To Look For – Finviz (Jan 25, 2026)
- Universal Beteiligungs und Servicegesellschaft mbH Sells 58,082 Shares of Sanmina Corporation $SANM – MarketBeat (Jan 24, 2026)
- Is Sanmina Stock a Smart Buy Before Q1 Earnings Report? – Zacks Investment Research (Jan 22, 2026)
- Can Sanmina’s Next-Generation Fiber Solutions Generate Steady Profits? – Yahoo Finance (Jan 20, 2026)
- SANMINA CORPORATION ANNOUNCES EXPANSION OF ENERGY BUSINESS WITH NEW STATE-OF-THE-ART FACTORY IN HOUSTON, TEXAS – PR Newswire (Dec 16, 2025)
For more information about Sanmina Corporation, please visit the official website: sanmina.com