Home > Analyses > Technology > Sandisk Corporation
SanDisk Corporation revolutionizes how we store and access data, powering countless devices with its advanced NAND flash technology. As a dominant force in the hardware and storage solutions sector, SanDisk’s portfolio spans solid-state drives, removable memory cards, and embedded storage components, renowned for quality and innovation. With a strong foothold in technology, I explore whether SanDisk’s current fundamentals support its premium valuation and sustained growth prospects in an evolving digital landscape.
Table of contents
Business Model & Company Overview
Sandisk Corporation, founded in 1988 and headquartered in Milpitas, CA, stands as a dominant player in the hardware sector, specializing in NAND flash technology. Its offerings form a cohesive ecosystem that includes solid state drives, embedded products, removable cards, USB devices, and wafers, delivering comprehensive storage solutions across multiple applications. With a workforce of 12K employees, Sandisk has solidified its reputation as a key innovator in storage devices worldwide.
The company’s revenue engine balances hardware sales with embedded components, driving value through a diversified product portfolio that serves global markets in the Americas, Europe, and Asia. This strategic international presence enhances its competitive footprint, supporting sustained growth. Sandisk’s economic moat is anchored in its proprietary technology and broad market reach, positioning it at the forefront of shaping the future of digital storage infrastructure.
Financial Performance & Fundamental Metrics
I will analyze Sandisk Corporation’s income statement, key financial ratios, and dividend payout policy to provide a clear view of its financial health and performance.
Income Statement
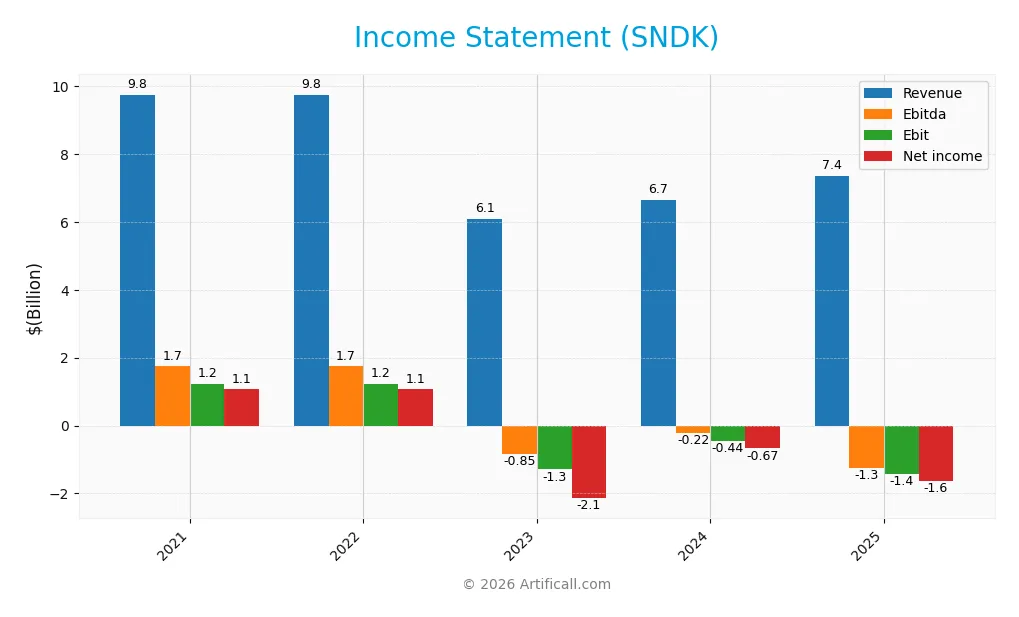
The table below summarizes Sandisk Corporation’s key income statement figures for the fiscal years 2021 through 2025, reported in USD.
| 2021 | 2022 | 2023 | 2024 | 2025 | |
|---|---|---|---|---|---|
| Revenue | 9.75B | 9.75B | 6.09B | 6.66B | 7.36B |
| Cost of Revenue | 6.51B | 6.51B | 5.66B | 5.59B | 5.14B |
| Operating Expenses | 2.04B | 2.04B | 2.47B | 1.54B | 3.59B |
| Gross Profit | 3.24B | 3.24B | 430M | 1.07B | 2.21B |
| EBITDA | 1.74B | 1.74B | -847M | -220M | -1.25B |
| EBIT | 1.22B | 1.22B | -1.30B | -444M | -1.42B |
| Interest Expense | 9M | 9M | 10M | 28M | 63M |
| Net Income | 1.06B | 1.06B | -2.14B | -672M | -1.64B |
| EPS | 7.39 | 7.39 | -14.88 | -4.67 | -11.32 |
| Filing Date | 2022-07-01 | 2022-07-01 | 2023-06-30 | 2024-06-30 | 2025-08-21 |
Income Statement Evolution
From 2022 to 2025, Sandisk Corporation’s revenue declined overall by 24.6%, although it grew 10.39% between 2024 and 2025. Gross profit showed a favorable recovery with a 106.34% increase in the last year, improving the gross margin to 30.07%. However, operating expenses grew at the same rate as revenue, and the EBIT margin remained negative at -19.25%, reflecting persistent profitability challenges.
Is the Income Statement Favorable?
The 2025 income statement reveals unfavorable fundamentals despite revenue growth and improved gross margin. Net income was negative at -$1.64B, with a net margin of -22.31%, deteriorating from prior years. EPS dropped significantly to -$11.32. Interest expense remained low at 0.86% of revenue, which is favorable, but operating losses and declining net income indicate ongoing financial difficulties. Overall, the income statement is evaluated as unfavorable.
Financial Ratios
The table below presents key financial ratios for Sandisk Corporation (SNDK) over the fiscal years 2021 to 2025, reflecting profitability, valuation, liquidity, leverage, and efficiency metrics:
| Ratios | 2021 | 2022 | 2023 | 2024 | 2025 |
|---|---|---|---|---|---|
| Net Margin | 11% | 11% | -35% | -10% | -22% |
| ROE | 8.2% | 8.2% | -18.7% | -6.1% | -17.8% |
| ROIC | 7.3% | 7.3% | -16.2% | -3.8% | -11.9% |
| P/E | 4.9 | 4.9 | -2.4 | -7.7 | -4.2 |
| P/B | 0.40 | 0.40 | 0.45 | 0.47 | 0.74 |
| Current Ratio | 1.79 | 1.79 | 1.56 | 1.67 | 3.56 |
| Quick Ratio | 0.99 | 0.99 | 0.52 | 0.75 | 2.11 |
| D/E | 0.07 | 0.07 | 0.09 | 0.09 | 0.22 |
| Debt-to-Assets | 6.0% | 6.0% | 7.4% | 7.4% | 16% |
| Interest Coverage | 133.3 | 133.3 | -204 | -16.7 | -21.9 |
| Asset Turnover | 0.62 | 0.62 | 0.44 | 0.49 | 0.57 |
| Fixed Asset Turnover | 9.39 | 9.39 | 5.93 | 6.87 | 11.9 |
| Dividend Yield | 0.0% | 0.0% | 0.0% | 0.0% | 0.0% |
All figures are rounded and expressed in decimal or percentage format where appropriate. Negative values in profitability and coverage ratios indicate losses or negative earnings in those years.
Evolution of Financial Ratios
Over the 2021-2025 period, Sandisk Corporation’s Return on Equity (ROE) declined substantially from a positive 8.2% in 2022 to a negative -17.8% in 2025, indicating deteriorating profitability. The Current Ratio improved markedly, rising from about 1.57 in 2023 to a robust 3.56 in 2025, signaling enhanced liquidity. The Debt-to-Equity Ratio increased from roughly 0.09 in 2023 to 0.22 in 2025, though it remains low, showing a moderate rise in leverage.
Are the Financial Ratios Favorable?
In 2025, Sandisk’s profitability ratios, including net margin (-22.3%) and ROE (-17.8%), are unfavorable, reflecting losses. Liquidity is mixed: the Current Ratio at 3.56 is unfavorable, possibly indicating excess assets, while the Quick Ratio at 2.11 is favorable. Leverage ratios, such as debt-to-equity (0.22) and debt-to-assets (15.7%), are favorable, suggesting manageable debt levels. Efficiency shows neutrality with asset turnover at 0.57, while market valuation ratios like P/E (negative but marked favorable) and P/B (0.74) are favorable. Overall, the ratios present a slightly unfavorable financial profile.
Shareholder Return Policy
Sandisk Corporation has not paid dividends in recent years, reflecting its negative net income since 2023 and ongoing reinvestment needs. The company’s share buyback activity is not explicitly reported, indicating limited direct shareholder cash returns currently.
This no-dividend approach aligns with Sandisk’s focus on stabilizing operations and maintaining liquidity amid losses and negative free cash flow. While this policy preserves capital for potential turnaround, it leaves shareholder returns reliant on future profitability and strategic execution.
Score analysis
The following radar chart presents an overview of Sandisk Corporation’s key financial scores across several valuation and performance metrics:
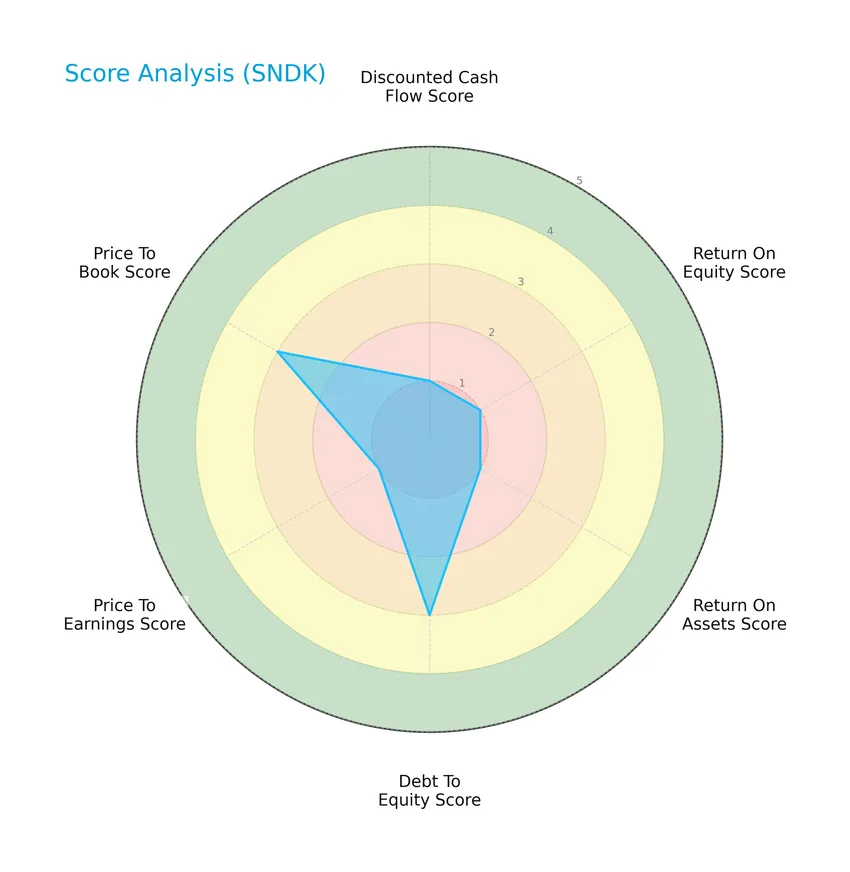
Sandisk’s scores reveal significant weaknesses in discounted cash flow, return on equity, return on assets, and price-to-earnings ratios, all rated very unfavorable at 1. However, debt-to-equity and price-to-book scores show moderate strength, each rated 3, suggesting some balance in capital structure and valuation metrics.
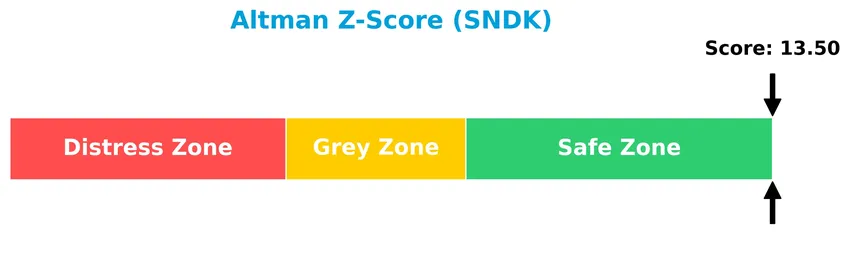
Analysis of the company’s bankruptcy risk
Sandisk Corporation’s Altman Z-Score places it well within the safe zone, indicating a very low risk of bankruptcy:
Is the company in good financial health?
The Piotroski Score diagram below illustrates Sandisk’s financial health based on nine accounting criteria:

With a Piotroski Score of 4, Sandisk falls into the average category, indicating moderate financial strength but leaving room for improvement in profitability, leverage, liquidity, and efficiency metrics.
Competitive Landscape & Sector Positioning
This sector analysis will examine Sandisk Corporation’s strategic positioning, revenue by segment, key products, main competitors, and competitive advantages. I will assess whether Sandisk holds a competitive advantage relative to its industry peers.
Strategic Positioning
SanDisk Corporation maintains a diversified product portfolio centered on NAND flash storage devices, including solid state drives, embedded products, and removable cards. Geographically, the company has broad exposure with significant revenue from China (2.04B), the US (1.45B), EMEA (1.28B), Hong Kong (1.3B), and the rest of Asia (1.12B), reflecting a balanced international presence.
Revenue by Segment
This pie chart displays Sandisk Corporation’s revenue distribution by segment for the fiscal year 2025, highlighting the company’s business focus areas.
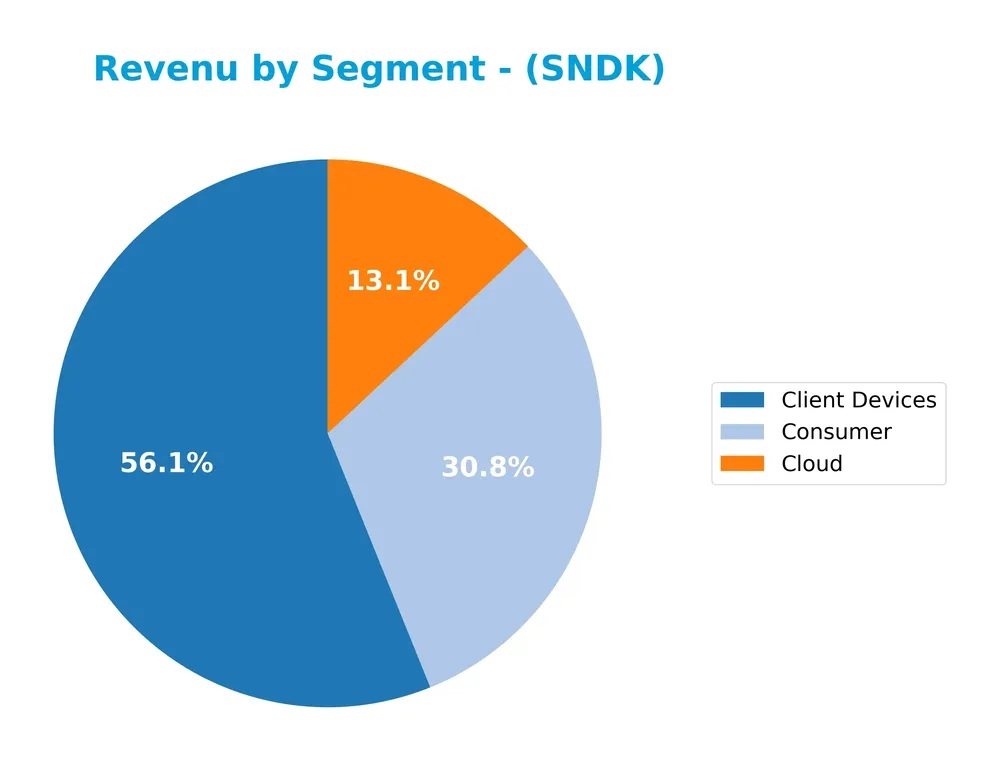
In 2025, Sandisk generated $4.13B from Client Devices, $2.27B from Consumer, and $960M from Cloud. Client Devices remain the primary revenue driver, accounting for the largest share. Consumer segment also contributes significantly, while Cloud revenue is smaller but notable. The data suggests a concentration in traditional hardware-related segments, with Cloud still emerging, indicating potential areas to watch for shifts in future growth dynamics.
Key Products & Brands
The table below presents Sandisk Corporation’s key products and brand descriptions:
| Product | Description |
|---|---|
| Solid State Drives | Storage devices based on NAND flash technology used in various computing and client devices. |
| Embedded Products | Integrated storage solutions designed for specialized hardware and industrial applications. |
| Removable Cards | Portable storage media such as memory cards for consumer electronics and mobile devices. |
| Universal Serial Bus | USB flash drives providing portable and convenient data storage and transfer capabilities. |
| Wafers and Components | Fundamental semiconductor elements used in manufacturing NAND flash memory products. |
Sandisk Corporation specializes in NAND flash-based storage solutions including SSDs, embedded systems, removable cards, USB drives, and semiconductor wafers, serving client devices, consumer electronics, and cloud storage markets.
Main Competitors
There are 20 competitors in total, with the table below listing the top 10 leaders by market capitalization:
| Competitor | Market Cap. |
|---|---|
| Amphenol Corporation | 171B |
| Corning Incorporated | 77.7B |
| TE Connectivity Ltd. | 68.6B |
| Sandisk Corporation | 40B |
| Garmin Ltd. | 39B |
| Keysight Technologies, Inc. | 35.5B |
| Celestica Inc. | 34B |
| Coherent, Inc. | 28.7B |
| Jabil Inc. | 25.7B |
| Teledyne Technologies Incorporated | 24.4B |
Sandisk Corporation ranks 4th among its top 10 competitors in the Technology sector. Its market cap is about 41% of the leader, Amphenol Corporation. Sandisk sits above both the average market cap of the top 10 competitors (54.4B) and the sector median (21.6B). The gap to the next competitor above, TE Connectivity Ltd., is relatively narrow at approximately 1.2%.
Comparisons with competitors
Check out how we compare the company to its competitors:
Does SNDK have a competitive advantage?
Sandisk Corporation does not currently present a competitive advantage as it shows a very unfavorable economic moat, with a ROIC significantly below WACC and a sharply declining ROIC trend, indicating value destruction. Despite favorable gross margin and revenue growth in the last year, the overall income statement and profitability metrics remain unfavorable.
Looking ahead, the company’s position in the hardware and storage device market, including NAND flash technology and solid state drives, suggests potential opportunities to leverage innovation in embedded products and new geographic markets. However, the financial results to date reflect challenges in operational efficiency and sustained profitability.
SWOT Analysis
This SWOT analysis highlights the key internal and external factors affecting Sandisk Corporation to guide investors in their decision-making.
Strengths
- Strong market presence in NAND flash storage
- High gross margin at 30%
- Solid geographic diversification with strong sales in China and US
Weaknesses
- Negative net margin at -22%
- Declining ROIC and value destruction
- Unfavorable EBIT and net income growth trends
Opportunities
- Growing demand for solid state drives
- Expansion in emerging markets
- Technological advancements in storage solutions
Threats
- Intense competition in hardware sector
- High beta indicating stock volatility
- Macroeconomic risks impacting tech spending
Overall, Sandisk’s strong market position and product portfolio are tempered by profitability challenges and value destruction. The company must focus on improving operational efficiency and leveraging growth opportunities while managing competitive and economic risks.
Stock Price Action Analysis
The following weekly stock chart of Sandisk Corporation (SNDK) illustrates price movements and volatility over the recent periods:
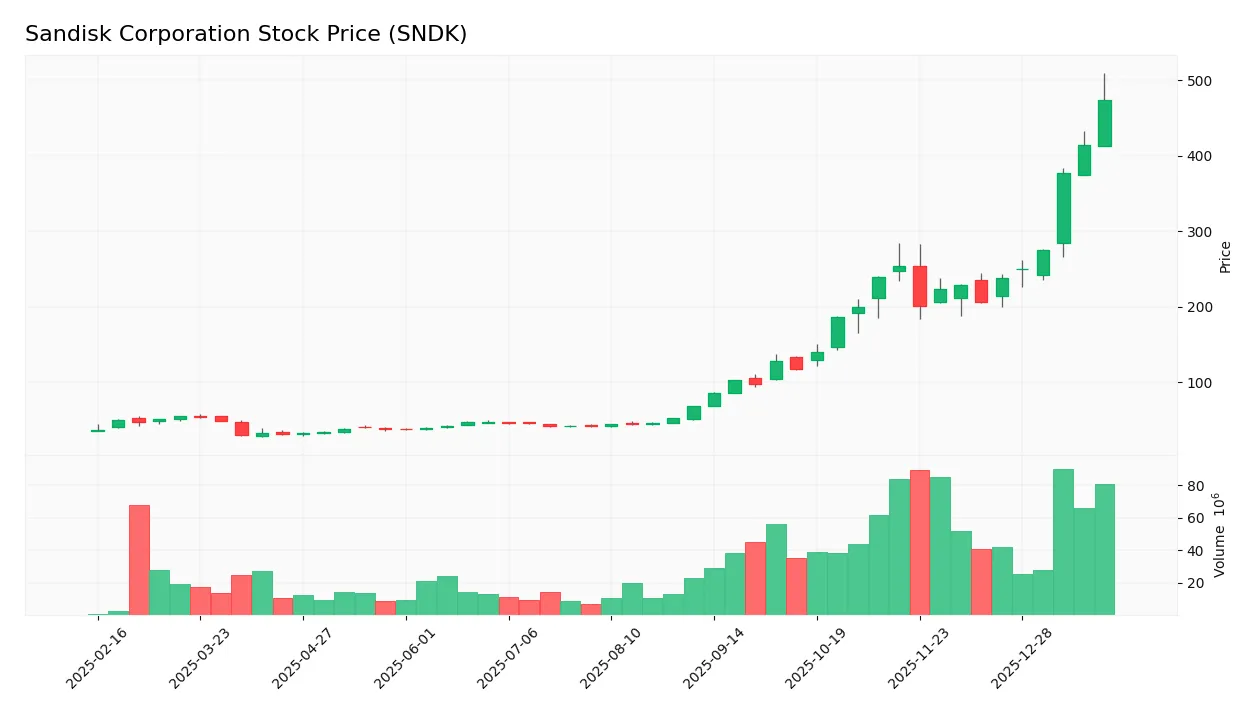
Trend Analysis
Over the past 12 years, SNDK’s stock price surged by 1192.85%, indicating a strong bullish trend with accelerating momentum. The price fluctuated significantly, ranging from a low of 30.11 to a high of 473.83, supported by a high standard deviation of 108.65. Recent months confirm continued bullish acceleration with a 97.86% gain.
Volume Analysis
Trading volume over the last three months shows a strongly buyer-dominant pattern, with buyers accounting for 82.51% of activity. Volume is increasing, reflecting heightened market participation and positive investor sentiment favoring accumulation in SNDK shares. Seller activity remains comparatively subdued during this period.
Target Prices
The consensus target prices for Sandisk Corporation indicate a broad range with a positive outlook.
| Target High | Target Low | Consensus |
|---|---|---|
| 580 | 220 | 390.73 |
Analysts expect Sandisk’s stock to trade between 220 and 580, with a consensus target around 391, suggesting moderate growth potential.

Don’t Let Luck Decide Your Entry Point
Optimize your entry points with our advanced ProRealTime indicators. You’ll get efficient buy signals with precise price targets for maximum performance. Start outperforming now!
Analyst & Consumer Opinions
This section reviews recent analyst ratings and consumer feedback to assess Sandisk Corporation’s market perception.
Stock Grades
The following table presents recent verified stock grades for Sandisk Corporation from established financial institutions:
| Grading Company | Action | New Grade | Date |
|---|---|---|---|
| Citigroup | Maintain | Buy | 2026-01-20 |
| Benchmark | Maintain | Buy | 2026-01-15 |
| Wells Fargo | Maintain | Equal Weight | 2026-01-15 |
| Bernstein | Maintain | Outperform | 2026-01-14 |
| Mizuho | Maintain | Outperform | 2026-01-09 |
| B of A Securities | Maintain | Buy | 2026-01-07 |
| Susquehanna | Maintain | Positive | 2025-12-08 |
| Morgan Stanley | Maintain | Overweight | 2025-11-24 |
| B of A Securities | Maintain | Buy | 2025-11-20 |
| Morgan Stanley | Maintain | Overweight | 2025-11-10 |
Overall, the consensus among these recognized analysts favors maintaining a positive outlook on Sandisk Corporation, with most grades clustered around Buy and Outperform ratings, indicating moderate confidence in the stock’s performance.
Consumer Opinions
Consumers express a mix of appreciation and critique regarding Sandisk Corporation’s products, reflecting a balanced market perception.
| Positive Reviews | Negative Reviews |
|---|---|
| Reliable storage devices with fast speeds. | Occasional compatibility issues with devices. |
| Competitive pricing for high-capacity drives. | Customer service response times could improve. |
| Durable products that withstand daily use. | Some users report slower data transfer in older models. |
Overall, Sandisk is praised for its reliable and competitively priced storage solutions, though users sometimes face compatibility and customer service challenges.
Risk Analysis
The following table summarizes key risks related to Sandisk Corporation, highlighting their probability and potential impact on investors:
| Category | Description | Probability | Impact |
|---|---|---|---|
| Financial Performance | Negative net margin (-22.31%) and ROE (-17.81%) signal ongoing losses. | High | High |
| Market Volatility | Very high beta (4.89) indicates significant price fluctuations risk. | High | Medium |
| Liquidity Risk | Unfavorable current ratio (3.56) and negative interest coverage suggest liquidity pressure. | Medium | High |
| Valuation | Favorable PE (-4.17) and PB (0.74) ratios contrast with weak profitability. | Medium | Medium |
| Dividend Policy | No dividend yield poses income risk for dividend-focused investors. | High | Low |
| Credit Risk | Low debt-to-equity (0.22) and debt-to-assets (15.73%) reduce default risk. | Low | Low |
The most critical risks stem from Sandisk’s sustained negative profitability and high market volatility, which recently caused a 5.9% price drop. Despite being in the Altman Z-score safe zone, the company’s moderate Piotroski score (4) and unfavorable returns suggest cautious risk management is essential.
Should You Buy Sandisk Corporation?
Sandisk Corporation appears to be facing deteriorating profitability with a very unfavorable competitive moat marked by declining returns and value destruction. Despite manageable leverage and a strong Altman Z-score suggesting financial safety, the overall rating of C and average Piotroski score indicate moderate operational challenges.
Strength & Efficiency Pillars
Sandisk Corporation displays a solid financial safety profile with an Altman Z-score of 13.50, placing it well within the safe zone for bankruptcy risk. The Piotroski score of 4 indicates moderate financial health, suggesting average operational efficiency. Favorable metrics include a gross margin of 30.07% and prudent leverage ratios, with a debt-to-equity ratio of 0.22 and a debt-to-assets ratio of 15.73%, both signaling conservative financial management. However, the company suffers from negative profitability metrics, with ROE at -17.81% and ROIC at -11.89%, both trailing its high WACC of 26.26%, indicating that Sandisk is currently not a value creator.
Weaknesses and Drawbacks
Sandisk’s financial profile is burdened by significant profitability challenges and valuation concerns. The net margin stands negative at -22.31%, reflecting persistent operational losses. The company’s interest coverage ratio is -22.48, indicating difficulty covering interest expenses, which heightens financial risk. Despite a low P/B ratio of 0.74 suggesting undervaluation, the negative P/E ratio of -4.17 reflects losses and complicates traditional valuation assessments. The elevated current ratio of 3.56, while generally positive, may point to inefficient asset utilization. These factors collectively imply caution due to ongoing profitability weaknesses and elevated financial stress.
Our Verdict about Sandisk Corporation
Sandisk presents an overall unfavorable fundamental profile, primarily due to its negative profitability and inability to generate returns above its cost of capital, signaling value destruction. Despite this, the stock’s technical trend is strongly bullish, supported by dominant buyer volume at 82.51% in recent months and a substantial price appreciation of 1192.85% over the long term. Given these mixed signals, the company’s profile may appear attractive for those prioritizing momentum, but it could warrant a cautious wait-and-see approach from a fundamental perspective until profitability metrics improve.
Disclaimer: This content is for informational purposes only and does not constitute financial, investment, or other professional advice. Investing in financial markets involves a significant risk of loss, and past performance is not indicative of future results.
Additional Resources
- Why Sandisk Corporation (SNDK) Could Beat Earnings Estimates Again – Yahoo Finance (Jan 23, 2026)
- Sandisk rally inflicts $3B loss on shorts, squeeze risk spikes – report (SNDK:NASDAQ) – Seeking Alpha (Jan 23, 2026)
- Sandisk (NASDAQ:SNDK) Stock Price Down 6.5% – Here’s What Happened – MarketBeat (Jan 23, 2026)
- SanDisk Shares Are Already Up 105% in 2026. How Much Higher Can SNDK Stock Go This Year? – Yahoo Finance (Jan 22, 2026)
- Sandisk Has Become the Hottest Tech Stock to Pursue in 2026 – Investing.com (Jan 21, 2026)
For more information about Sandisk Corporation, please visit the official website: sandisk.com