Home > Analyses > Financial Services > S&P Global Inc.
S&P Global Inc. shapes financial markets by powering critical decisions with trusted data and analytics. Its credit ratings, indices, and market intelligence influence trillions in capital worldwide. The company’s innovation spans sectors from commodities to mobility, delivering precision and insight that investors and businesses rely on daily. As market dynamics evolve, the key question is whether S&P Global’s robust fundamentals continue to support its premium valuation and growth trajectory.

Table of contents
Business Model & Company Overview
S&P Global Inc., founded in 1860 and headquartered in New York City, stands as a titan in the financial data and analytics sector. It operates a cohesive ecosystem through six distinct divisions, delivering credit ratings, indices, commodity insights, market intelligence, mobility data, and engineering solutions. This integrated approach empowers investors and businesses to navigate complex capital, commodity, and automotive markets with precision.
The company’s revenue engine blends recurring subscription services with data-driven analytics and benchmark products, balancing software and workflow solutions across global markets in the Americas, Europe, and Asia. Its diversified portfolio supports robust capital formation and risk assessment, reinforcing a durable economic moat that shapes the future of financial information services.
Financial Performance & Fundamental Metrics
I analyze S&P Global Inc.’s income statement, key financial ratios, and dividend payout policy to reveal its profitability, efficiency, and shareholder return strategy.
Income Statement
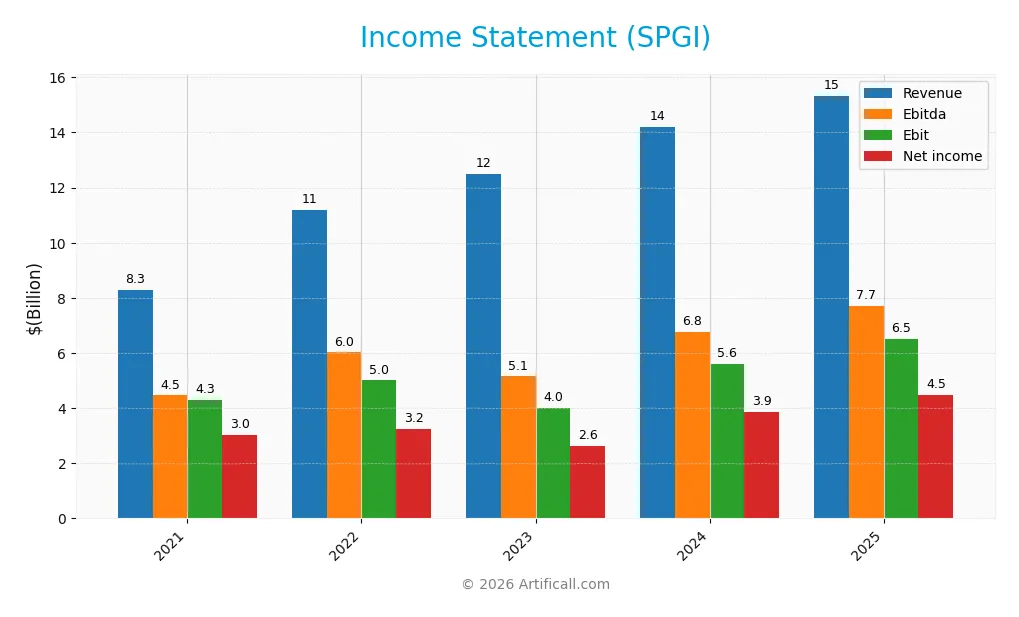
The table below presents S&P Global Inc.’s key income statement figures from 2021 through 2025, reflecting revenue growth and profit trends in USD.
| 2021 | 2022 | 2023 | 2024 | 2025 | |
|---|---|---|---|---|---|
| Revenue | 8.3B | 11.2B | 12.5B | 14.2B | 15.3B |
| Cost of Revenue | 2.2B | 3.8B | 4.1B | 4.4B | 9.2B |
| Operating Expenses | 1.9B | 2.5B | 4.3B | 4.2B | 0 |
| Gross Profit | 6.1B | 7.4B | 8.4B | 9.8B | 6.2B |
| EBITDA | 4.5B | 6.0B | 5.1B | 6.8B | 7.7B |
| EBIT | 4.3B | 5.0B | 4.0B | 5.6B | 6.5B |
| Interest Expense | 119M | 304M | 334M | 297M | 287M |
| Net Income | 3.0B | 3.2B | 2.6B | 3.9B | 4.5B |
| EPS | 12.56 | 10.25 | 8.25 | 12.36 | 14.67 |
| Filing Date | 2022-02-08 | 2023-02-10 | 2024-02-09 | 2025-02-11 | 2026-02-11 |
Income Statement Evolution
From 2021 to 2025, S&P Global’s revenue rose 85% to $15.3B. Net income increased 48% to $4.47B. Gross margin declined by 20%, though it remained strong at 40.3%. EBIT and net margins improved, reaching 42.5% and 29.2%, respectively, reflecting better operational efficiency despite some margin compression over the period.
Is the Income Statement Favorable?
The 2025 income statement shows solid fundamentals with a 7.9% revenue growth and a 16.2% increase in EBIT. Net margin rose 7.5% to 29.2%, supported by controlled interest expense at 1.9%. EPS grew 18.7%, indicating effective capital allocation. Overall, 79% of key income metrics rate favorable, signaling robust profitability and margin management.
Financial Ratios
The table below summarizes key financial ratios for S&P Global Inc. over the last five fiscal years, illustrating profitability, leverage, liquidity, and valuation metrics:
| Ratios | 2021 | 2022 | 2023 | 2024 | 2025 |
|---|---|---|---|---|---|
| Net Margin | 36% | 29% | 21% | 27% | 29% |
| ROE | 149% | 9% | 8% | 12% | 14% |
| ROIC | 29% | 7% | 6% | 8% | 9% |
| P/E | 38 | 33 | 53 | 40 | 36 |
| P/B | 56 | 3 | 4 | 5 | 5 |
| Current Ratio | 2.31 | 0.94 | 0.84 | 0.85 | 0.82 |
| Quick Ratio | 2.31 | 0.94 | 0.84 | 0.85 | 0.82 |
| D/E | 2.31 | 0.32 | 0.35 | 0.36 | 0.43 |
| Debt-to-Assets | 31% | 19% | 20% | 20% | 22% |
| Interest Coverage | 35.5 | 16.3 | 12.0 | 18.8 | 22.6 |
| Asset Turnover | 0.55 | 0.18 | 0.21 | 0.24 | 0.25 |
| Fixed Asset Turnover | 12.4 | 15.5 | 19.6 | 21.0 | 55.2 |
| Dividend Yield | 0.65% | 0.96% | 0.82% | 0.73% | 0.73% |
Evolution of Financial Ratios
Return on Equity (ROE) improved from a low 7.68% in 2023 to 14.31% in 2025, indicating a moderate recovery in profitability. The Current Ratio declined steadily from 2.31 in 2021 to 0.82 in 2025, signaling weakening liquidity. Debt-to-Equity Ratio dropped significantly from 2.31 in 2021 to 0.43 in 2025, reflecting reduced leverage and improved balance sheet stability.
Are the Financial Ratios Favorable?
In 2025, profitability ratios show mixed signals: net margin is favorable at 29.15%, but ROE and ROIC are neutral near 14.31% and 9.24%. Liquidity is weak with an unfavorable current ratio of 0.82, while leverage remains favorable with a low debt-to-equity ratio of 0.43. Market valuation ratios like P/E (35.63) and P/B (5.1) appear elevated and unfavorable. Overall, the ratio profile is balanced, neither clearly favorable nor unfavorable.
Shareholder Return Policy
S&P Global Inc. maintains a consistent dividend policy, with a payout ratio around 26%, supporting a dividend yield near 0.73% in 2025. The dividend per share has grown steadily, and distributions remain well covered by free cash flow, indicating financial discipline. The company also engages in share buybacks, complementing dividends to return capital to shareholders.
This balanced approach aligns with sustainable long-term value creation. Coverage ratios suggest payouts and buybacks are prudent, avoiding excessive leverage or cash strain. I observe that S&P Global’s policy supports shareholder returns without compromising financial stability, a critical factor in the current market environment.
Score analysis
The radar chart below illustrates key valuation and financial strength scores for S&P Global Inc.:
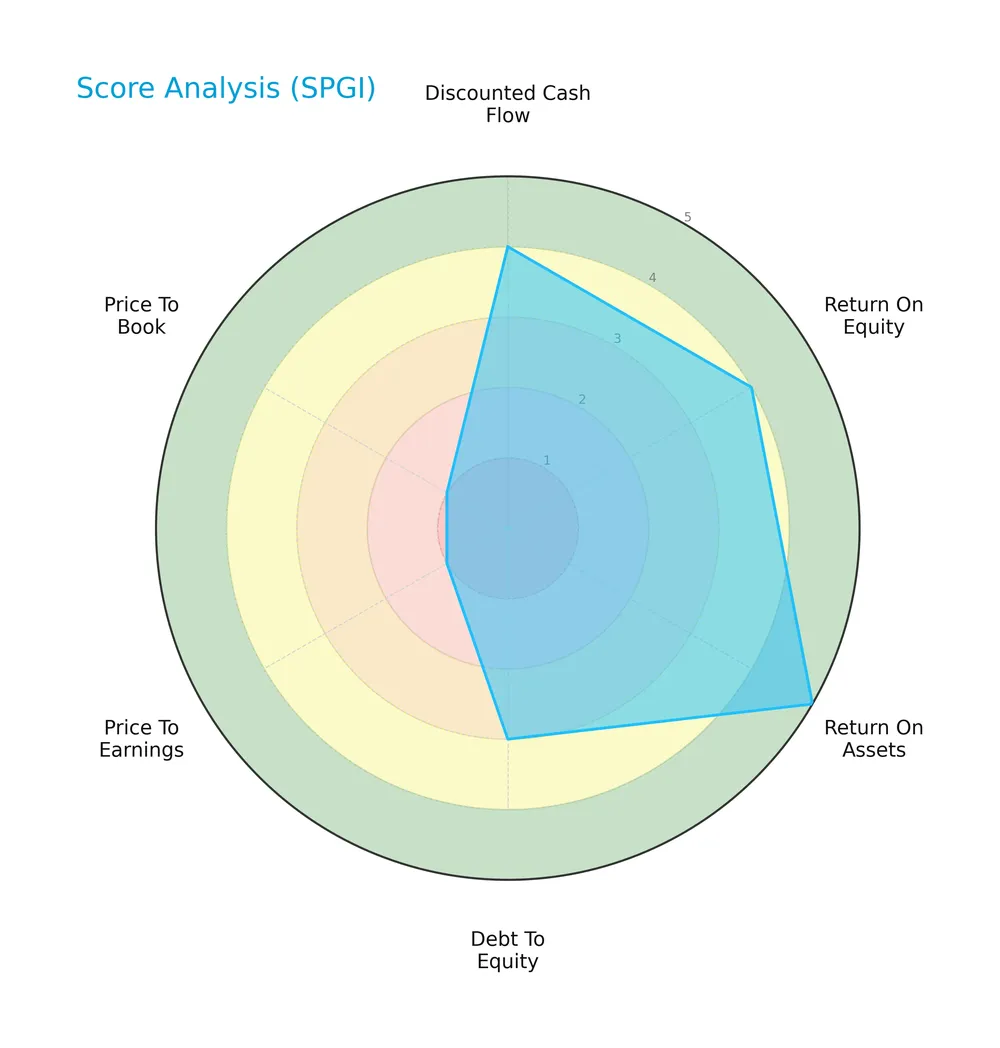
S&P Global scores favorably in discounted cash flow, return on equity, and return on assets, indicating strong operational efficiency. Debt-to-equity stands at a moderate level. Price-to-earnings and price-to-book scores are very unfavorable, suggesting valuation concerns.
Analysis of the company’s bankruptcy risk
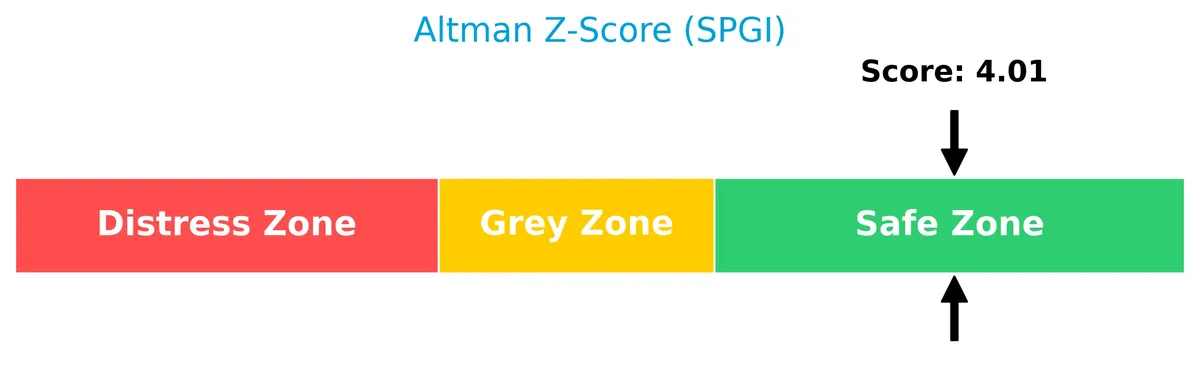
The Altman Z-Score places S&P Global well within the safe zone, indicating a low risk of bankruptcy and solid financial stability:
Is the company in good financial health?
The Piotroski Score diagram highlights S&P Global’s strong financial health status based on profitability, leverage, liquidity, and efficiency criteria:

With a score of 7, the company demonstrates robust fundamentals, signaling reliable financial strength though not at the highest echelon.
Competitive Landscape & Sector Positioning
This sector analysis examines S&P Global Inc.’s strategic positioning, revenue segments, and key products. I will assess whether the company holds a competitive advantage over its main competitors.
Strategic Positioning
S&P Global Inc. operates a diversified product portfolio across six divisions, including Ratings, Market Intelligence, Indices, Commodity Insights, Mobility, and Engineering Solutions. Its revenue is geographically diversified, with the U.S. contributing 8.64B, Europe 3.26B, Asia 1.49B, and Rest of World 821M in 2024.
Revenue by Segment
The pie chart illustrates S&P Global Inc.’s revenue distribution by segment for the fiscal year 2024, highlighting key business drivers across its diverse operations.
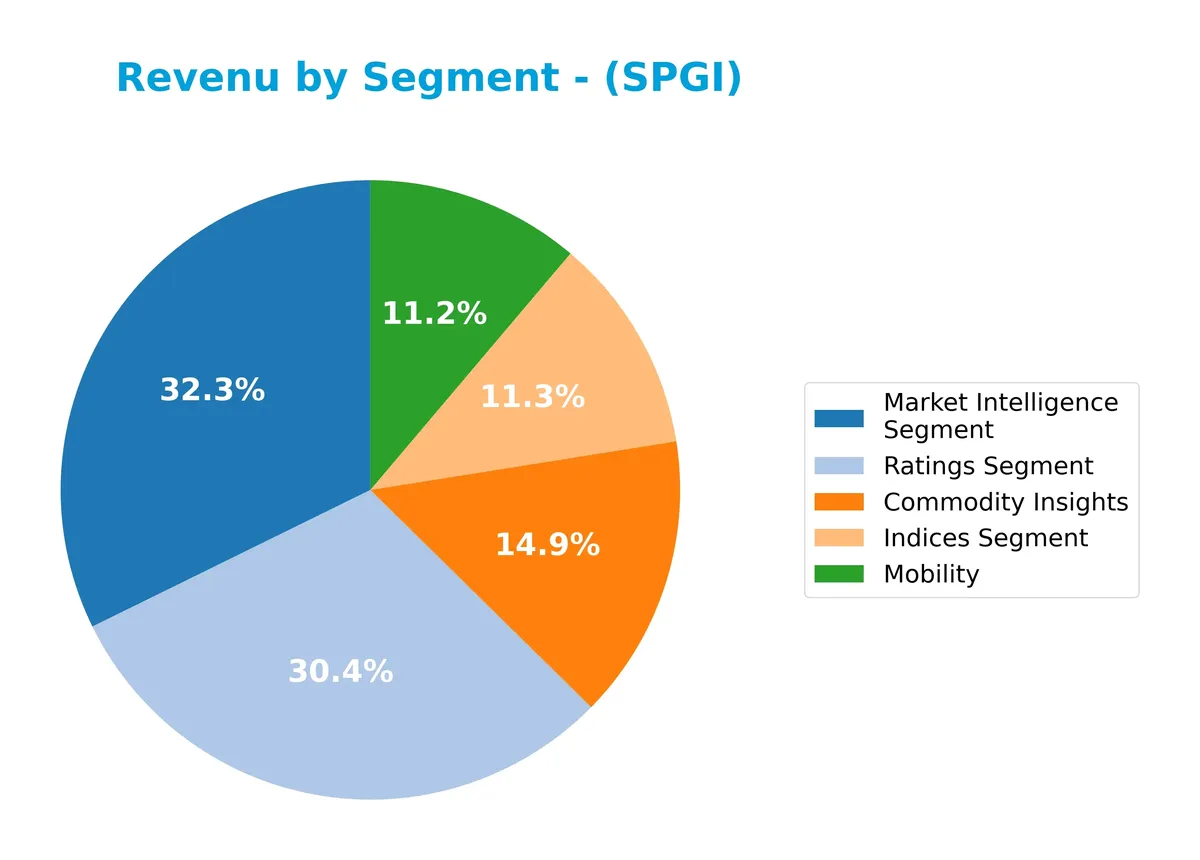
In 2024, Market Intelligence leads with $4.6B, underscoring its central role in the portfolio. Ratings closely follow at $4.4B, demonstrating its consistent strength. Commodity Insights and Indices contribute significantly with $2.1B and $1.6B respectively, while Mobility adds $1.6B, reflecting recent growth. The business shows balanced diversification, although Market Intelligence and Ratings dominate, signaling concentrated exposure in data and credit services.
Key Products & Brands
The table below outlines S&P Global Inc.’s main products and brand segments with concise descriptions:
| Product | Description |
|---|---|
| S&P Global Ratings | Independent credit ratings, research, and analytics providing benchmarks and risk assessments for investors. |
| S&P Dow Jones Indices | Provider of valuation and index benchmarks for investment advisors, wealth managers, and institutional investors. |
| S&P Global Commodity Insights | Data and insights for global energy and commodity markets to support informed decision-making. |
| S&P Global Market Intelligence | Data and technology solutions delivering workflow, ESG, credit, risk, and regulatory insights across sectors. |
| S&P Global Mobility | Automotive data and insights enabling customers to anticipate industry changes and make strategic decisions. |
| S&P Global Engineering Solutions | Engineering expertise and solutions for aerospace, defense, energy, architecture, construction, and transportation. |
S&P Global’s diversified portfolio spans credit ratings, indices, commodity data, market intelligence, automotive insights, and engineering services. This breadth supports its leadership in financial data and analytics sectors.
Main Competitors
There are 9 competitors in total; the table below shows the top 9 leaders by market capitalization:
| Competitor | Market Cap. |
|---|---|
| S&P Global Inc. | 155.2B |
| CME Group Inc. | 97.2B |
| Intercontinental Exchange, Inc. | 91.7B |
| Moody’s Corporation | 89.7B |
| Coinbase Global, Inc. | 60.5B |
| Nasdaq, Inc. | 55.5B |
| MSCI Inc. | 43.7B |
| Cboe Global Markets, Inc. | 25.9B |
| FactSet Research Systems Inc. | 10.8B |
S&P Global Inc. ranks 1st among its competitors with a market cap of 155.2B. It stands well above the average market cap of 70.0B for the top 10 and exceeds the sector median of 60.5B. The company leads its closest competitor, CME Group, by 21.7%, highlighting a significant scale advantage in this sector.
Comparisons with competitors
Check out how we compare the company to its competitors:
Does SPGI have a competitive advantage?
SPGI currently does not exhibit a strong competitive advantage, as its ROIC falls below WACC with a declining trend, indicating the company is shedding value and profitability is decreasing. Despite favorable income margins and revenue growth, its economic moat status is slightly unfavorable, reflecting challenges in sustaining value creation.
Looking ahead, SPGI’s diversified divisions across global markets offer opportunities for growth through new data products and analytics services. Expansion in automotive data, commodity insights, and engineering solutions could enhance future competitive positioning if profitability trends improve.
SWOT Analysis
This analysis highlights S&P Global Inc.’s key internal strengths and weaknesses alongside external opportunities and threats to inform strategic decisions.
Strengths
- Strong market position in financial data and analytics
- Diverse revenue streams across six divisions
- Favorable profitability metrics with a 29% net margin
Weaknesses
- Declining ROIC signals value erosion
- High P/E and P/B ratios suggest valuation premium
- Low current ratio indicates liquidity risk
Opportunities
- Expansion in global markets, especially Asia and Europe
- Growth in ESG and sustainability analytics
- Increasing demand for workflow and automation solutions
Threats
- Intense competition in financial data services
- Regulatory changes impacting credit ratings
- Economic volatility affecting client budgets
S&P Global’s robust market presence and profitability provide a solid foundation. However, declining capital efficiency and valuation concerns require cautious capital allocation. Growth hinges on global expansion and innovation, balanced against competitive and regulatory risks.
Stock Price Action Analysis
The coming weekly chart illustrates S&P Global Inc.’s stock price fluctuations and key highs and lows over the past 100 weeks:
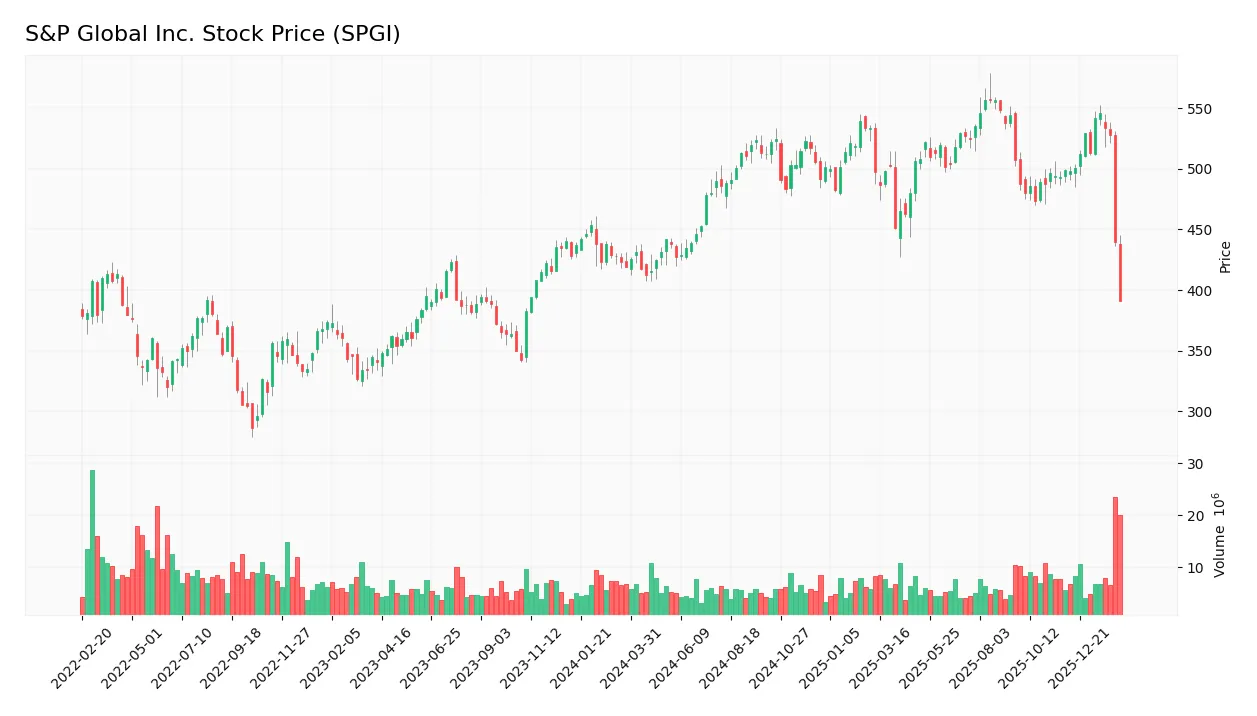
Trend Analysis
Over the past 12 months, SPGI’s stock price declined by 6.77%, indicating a bearish trend. The trend shows deceleration with a high volatility level (std dev 37.34). The stock’s highest price reached 556.87, while the lowest touched 390.76, reflecting significant price swings.
Volume Analysis
In the last three months, trading volume has increased overall, with sellers dominating at 62.19%. Buyer volume fell to 42.3M, while seller volume rose to 69.6M, signaling heightened selling pressure and cautious investor sentiment. Market participation remains active but skewed toward selling.
Target Prices
Analysts present a confident target consensus for S&P Global Inc., reflecting strong growth expectations.
| Target Low | Target High | Consensus |
|---|---|---|
| 482 | 643 | 556.25 |
The target range shows bullish sentiment, with analysts expecting the stock to appreciate significantly from current levels. This consensus reflects confidence in SPGI’s durable competitive advantages and robust financials.

Don’t Let Luck Decide Your Entry Point
Optimize your entry points with our advanced ProRealTime indicators. You’ll get efficient buy signals with precise price targets for maximum performance. Start outperforming now!
Analyst & Consumer Opinions
This section examines analyst ratings and consumer feedback to provide a comprehensive view of S&P Global Inc.’s market perception.
Stock Grades
Here are the latest verified grades from leading financial institutions for S&P Global Inc.:
| Grading Company | Action | New Grade | Date |
|---|---|---|---|
| Evercore ISI Group | Maintain | Outperform | 2026-02-11 |
| RBC Capital | Maintain | Outperform | 2026-02-11 |
| Stifel | Maintain | Buy | 2026-02-11 |
| Wells Fargo | Maintain | Overweight | 2026-02-11 |
| Goldman Sachs | Maintain | Buy | 2026-02-11 |
| Goldman Sachs | Maintain | Buy | 2026-02-09 |
| Morgan Stanley | Maintain | Overweight | 2026-01-13 |
| Evercore ISI Group | Maintain | Outperform | 2026-01-08 |
| Evercore ISI Group | Maintain | Outperform | 2025-10-31 |
| Stifel | Maintain | Buy | 2025-10-31 |
The consensus view remains firmly positive, with all firms maintaining bullish ratings. This steady pattern reflects broad confidence in the stock’s outlook and resilience.
Consumer Opinions
S&P Global Inc. receives mixed but largely favorable feedback from its user base, reflecting its strong market position alongside areas needing improvement.
| Positive Reviews | Negative Reviews |
|---|---|
| “Reliable data and insightful market analysis.” | “Subscription costs have increased sharply.” |
| “User-friendly platform with comprehensive tools.” | “Customer support response times can lag.” |
| “Consistent accuracy in credit ratings.” | “Interface updates sometimes cause confusion.” |
Consumers consistently praise S&P Global’s data reliability and analytical depth. However, they note higher prices and occasional customer service delays as notable drawbacks.
Risk Analysis
Below is a summary table outlining key risks facing S&P Global Inc. in 2026:
| Category | Description | Probability | Impact |
|---|---|---|---|
| Valuation Risk | Elevated P/E (35.6) and P/B (5.1) ratios suggest overvaluation. | High | High |
| Liquidity Risk | Current ratio at 0.82 signals potential short-term liquidity constraints. | Medium | Medium |
| Market Volatility | Beta of 1.20 indicates sensitivity to market swings, impacting share price. | Medium | Medium |
| Competitive Risk | Intense competition in financial data services could pressure margins. | Medium | Medium |
| Regulatory Risk | Changes in financial regulations could disrupt operations and revenue. | Low | High |
I observe that valuation risk stands out due to the company’s stretched P/E and P/B multiples compared to industry averages. The liquidity ratio below 1.0 is a red flag, hinting at weaker short-term financial flexibility. However, the strong Altman Z-Score (4.01) reassures that bankruptcy risk remains low. Market volatility remains a constant threat given SPGI’s beta exceeding 1. Industry competition and regulatory changes pose moderate risks, but recent stable margins (net margin 29.15%) mitigate immediate concerns.
Should You Buy S&P Global Inc.?
S&P Global Inc. appears to be a profitable entity with improving operational efficiency but faces a slightly unfavorable moat due to declining ROIC, suggesting value erosion. Supported by a manageable leverage profile and a B+ rating, the overall profile could be seen as moderately favorable.
Strength & Efficiency Pillars
S&P Global Inc. delivers robust operational efficiency with a net margin of 29.15% and an EBIT margin of 42.48%. The company maintains a solid ROE of 14.31%, reflecting steady shareholder returns. Its ROIC stands at 9.24%, slightly above the WACC of 8.74%, indicating modest value creation. The Altman Z-Score of 4.01 places it comfortably in the safe zone, underscoring solid financial health. I view these metrics as signs of a company with reliable profitability and operational discipline.
Weaknesses and Drawbacks
Despite operational strengths, S&P Global faces valuation headwinds. Its P/E ratio of 35.63 and P/B ratio of 5.1 signal a premium valuation, which could limit upside. The current ratio of 0.82 flags short-term liquidity concerns, suggesting the company’s ability to cover short-term liabilities is constrained. Market pressure intensified recently with seller dominance (37.81% buyers vs. 62.19% sellers) from late 2025 into early 2026, creating near-term price volatility and risk for new entrants.
Our Final Verdict about S&P Global Inc.
The company’s long-term fundamentals remain sound, supported by strong profitability and a safe solvency profile. However, recent bearish price action and seller dominance suggest caution. Despite its favorable operational metrics and financial stability, the current market environment may warrant a wait-and-see approach for a more attractive entry point. The profile suggests potential but is tempered by valuation and near-term technical pressures.
Disclaimer: This content is for informational purposes only and does not constitute financial, investment, or other professional advice. Investing in financial markets involves a significant risk of loss, and past performance is not indicative of future results.
Additional Resources
- Behind the E.P.A.’s Rush to Repeal the Endangerment Finding – The New York Times (Feb 10, 2026)
- Suspect in custody after deadly Starbucks shooting on S. Grand – fox2now.com (Feb 10, 2026)
- Mercedes-Benz Confirms S-Class EV to Replace EQS After Sales Miss – Autoblog (Feb 11, 2026)
- Used Tesla Model S sees a major price drop in 2026 – USA Today (Feb 10, 2026)
- Mercedes Confirms Electric S-Class As BMW i7 Rival – BMW Blog (Feb 10, 2026)
For more information about S&P Global Inc., please visit the official website: spglobal.com