Home > Analyses > Consumer Cyclical > Royal Caribbean Cruises Ltd.
Royal Caribbean Cruises Ltd. transforms how millions experience travel, crafting journeys that blend adventure with luxury. Its fleet spans 61 ships under iconic brands like Royal Caribbean International and Celebrity Cruises. The company commands a significant share of the global cruise market, known for innovation in ship design and immersive itineraries. As travel rebounds in 2026, I examine whether Royal Caribbean’s strong market position still supports its premium valuation and growth ambitions.

Table of contents
Business Model & Company Overview
Royal Caribbean Cruises Ltd. stands as a dominant player in the travel services sector, headquartered in Miami, FL, with roots dating back to 1968. The company operates a cohesive ecosystem of cruise brands—Royal Caribbean International, Celebrity Cruises, Azamara, and Silversea Cruises—offering diverse itineraries across roughly 1,000 destinations. Its fleet of 61 ships forms the backbone of an expansive global leisure network, supporting over 105K employees worldwide.
The company’s revenue engine balances ticket sales, onboard services, and premium experiences, blending hardware (ships) with software-like offerings (loyalty programs, excursions). Royal Caribbean commands strategic market exposure across the Americas, Europe, and Asia, fueling consistent cash flow. Its economic moat derives from scale, brand equity, and a vast global footprint that shapes the future of cruise travel.
Financial Performance & Fundamental Metrics
I will analyze Royal Caribbean Cruises Ltd.’s income statement, key financial ratios, and dividend payout policy to assess its overall financial health and investor appeal.
Income Statement
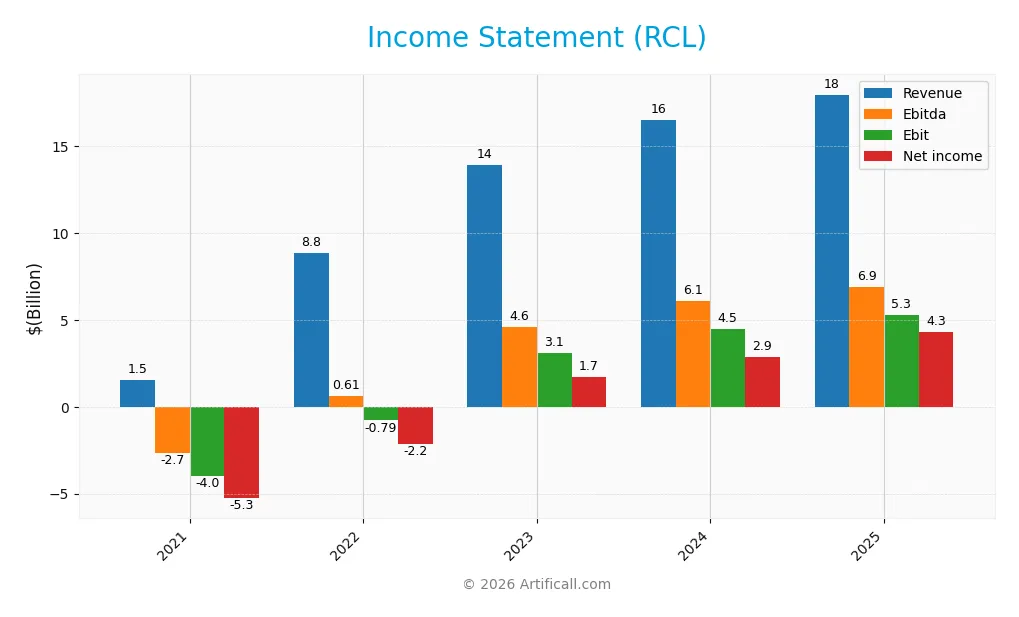
The table below summarizes Royal Caribbean Cruises Ltd.’s key income statement metrics for fiscal years 2021 through 2025, reflecting its financial trajectory.
| 2021 | 2022 | 2023 | 2024 | 2025 | |
|---|---|---|---|---|---|
| Revenue | 1.53B | 8.84B | 13.9B | 16.5B | 17.9B |
| Cost of Revenue | 2.74B | 6.62B | 7.78B | 8.65B | 9.54B |
| Operating Expenses | 2.66B | 3.00B | 3.25B | 3.73B | 3.49B |
| Gross Profit | -1.21B | 2.22B | 6.13B | 7.83B | 8.40B |
| EBITDA | -2.68B | 615M | 4.56B | 6.09B | 6.91B |
| EBIT | -3.97B | -792M | 3.11B | 4.49B | 5.30B |
| Interest Expense | 1.29B | 1.36B | 1.40B | 1.59B | 992M |
| Net Income | -5.26B | -2.16B | 1.70B | 2.88B | 4.27B |
| EPS | -20.89 | -8.45 | 6.63 | 11.00 | 15.73 |
| Filing Date | 2022-03-01 | 2023-02-23 | 2024-02-21 | 2025-02-14 | 2026-02-11 |
Income Statement Evolution
Royal Caribbean Cruises Ltd. revenue expanded strongly from 1.53B in 2021 to 17.94B in 2025, reflecting robust growth. Net income turned positive after significant losses in 2021 and 2022, reaching 4.28B in 2025. Margins improved markedly, with gross margin climbing to 46.8% and net margin rising to nearly 24%, signaling enhanced profitability and operational efficiency.
Is the Income Statement Favorable?
The 2025 income statement shows solid fundamentals with an 8.8% revenue increase year-over-year and a 36.5% net margin growth. EBIT margin stands at a favorable 29.5%, while interest expense remains neutral at 5.5% of revenue, indicating manageable debt costs. Overall, 92.9% of income statement metrics are positive, confirming a strong financial performance for the latest fiscal year.
Financial Ratios
The table below summarizes key financial ratios for Royal Caribbean Cruises Ltd. from 2021 to 2025, providing insights into profitability, liquidity, leverage, and market valuation:
| Ratios | 2021 | 2022 | 2023 | 2024 | 2025 |
|---|---|---|---|---|---|
| Net Margin | -343% | -244% | 12.2% | 17.5% | 23.8% |
| ROE | -103% | -75% | 36% | 38% | 43% |
| ROIC | -14% | -3% | 10% | 14% | 15% |
| P/E | -3.7x | -5.8x | 19.5x | 20.9x | 17.7x |
| P/B | 3.81x | 4.39x | 7.02x | 7.96x | 7.53x |
| Current Ratio | 0.49 | 0.37 | 0.19 | 0.17 | 0.18 |
| Quick Ratio | 0.47 | 0.35 | 0.16 | 0.15 | 0.16 |
| D/E | 4.27x | 8.36x | 4.68x | 2.75x | 2.26x |
| Debt-to-Assets | 67.3% | 71.0% | 63.0% | 56.2% | 54.4% |
| Interest Coverage | -3.0x | -0.56x | 2.05x | 2.58x | 4.95x |
| Asset Turnover | 0.05x | 0.26x | 0.40x | 0.44x | 0.43x |
| Fixed Asset Turnover | 0.058x | 0.31x | 0.45x | 0.51x | 0.49x |
| Dividend Yield | 0% | 0% | 0% | 0.18% | 0.35% |
Evolution of Financial Ratios
From 2021 to 2025, Royal Caribbean Cruises Ltd. saw Return on Equity (ROE) rebound strongly from negative territory to 42.6%, signaling improved profitability. The Current Ratio declined steadily, reaching 0.18 in 2025, indicating weakening short-term liquidity. Debt-to-Equity Ratio improved from over 8.3 in 2022 to 2.26 in 2025, reflecting some deleveraging but remaining elevated.
Are the Financial Ratios Favorable?
In 2025, profitability metrics like ROE (42.6%) and net margin (23.8%) are favorable, well above industry averages. However, liquidity ratios such as Current Ratio (0.18) and Quick Ratio (0.16) remain weak, raising concerns about short-term financial flexibility. Leverage ratios, including Debt-to-Equity (2.26) and Debt-to-Assets (54.4%), are unfavorable, indicating high debt levels. Market valuation metrics like Price-to-Book (7.53) also appear stretched. Overall, the ratio profile is more unfavorable than favorable.
Shareholder Return Policy
Royal Caribbean Cruises Ltd. pays dividends with a payout ratio near 6.2% in 2025 and a dividend yield below 0.35%. Dividend coverage by free cash flow remains positive, supported by moderate share buyback activity, indicating a balanced capital return approach.
The company’s policy reflects prudent distribution aligned with cash flow generation, avoiding excessive payouts or buybacks. This approach supports sustainable long-term value creation by maintaining financial flexibility amid its capital-intensive operations and cyclical industry risks.
Score analysis
The following radar chart displays key financial scores for Royal Caribbean Cruises Ltd., illustrating its performance across valuation and profitability metrics:
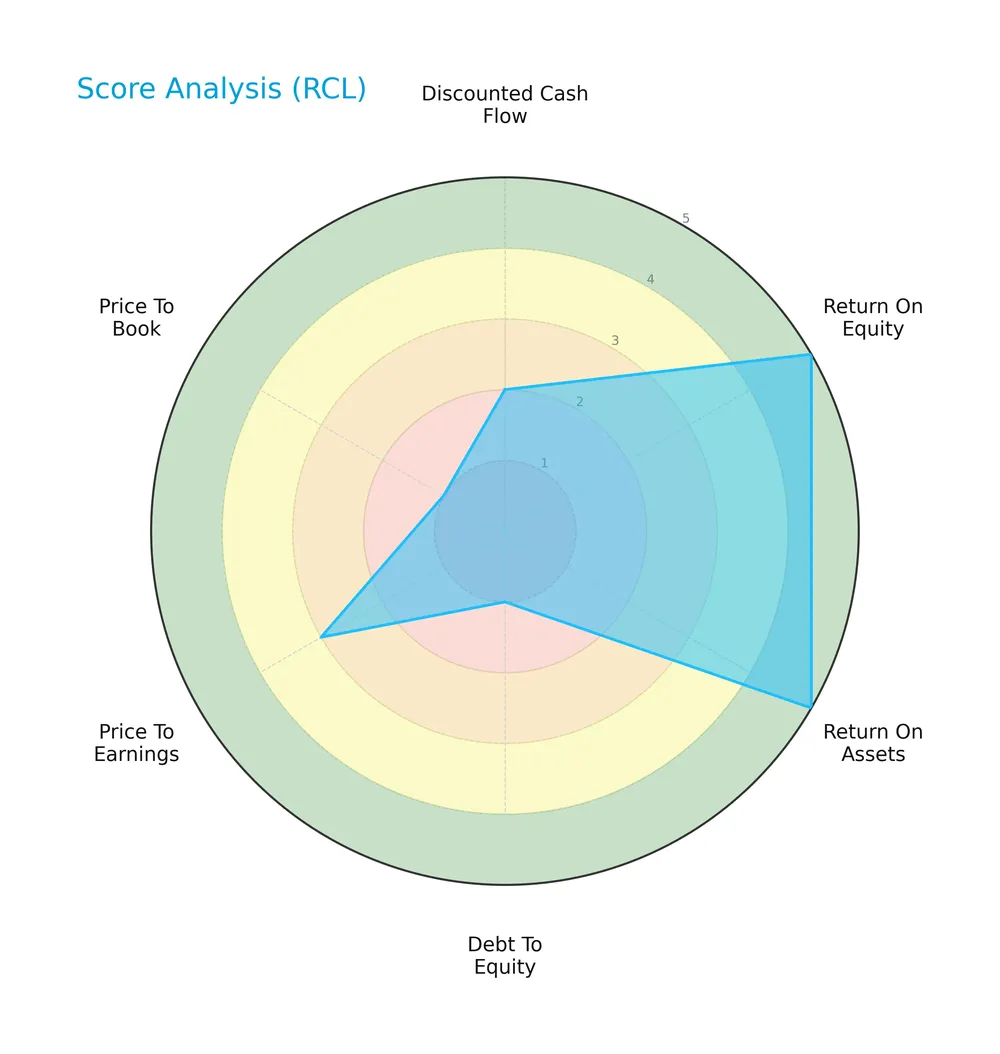
Royal Caribbean shows strong returns on equity and assets with top scores of 5 each. However, it struggles with leverage and valuation, scoring very low on debt-to-equity and price-to-book ratios. The discounted cash flow score also appears weak at 2, while price-to-earnings is moderate at 3.
Analysis of the company’s bankruptcy risk
The Altman Z-Score places Royal Caribbean in the grey zone, indicating a moderate risk of bankruptcy and financial distress in uncertain market conditions:

Is the company in good financial health?
The Piotroski Score chart offers insight into Royal Caribbean’s financial strength and operational efficiency:

With a Piotroski Score of 6, the company demonstrates average financial health. This suggests moderate profitability and stability, but not the robust strength seen in top-tier value investments.
Competitive Landscape & Sector Positioning
This sector analysis reviews Royal Caribbean Cruises Ltd.’s strategic positioning, revenue breakdown, and main competitors. We will examine key products and assess the company’s competitive advantages. I aim to determine whether Royal Caribbean holds a sustainable edge over its industry peers.
Strategic Positioning
Royal Caribbean Cruises Ltd. concentrates its revenue primarily in cruise itineraries, generating $17.1B in 2025, with limited diversification into other services ($864M). Geographically, it focuses on North America ($11.5B), followed by Europe and Asia Pacific, maintaining a strong presence in key travel markets worldwide.
Revenue by Segment
This pie chart presents Royal Caribbean Cruises Ltd.’s revenue breakdown by segment for fiscal year 2025, highlighting the relative contributions of Cruise Itinerary and Other Products And Services.
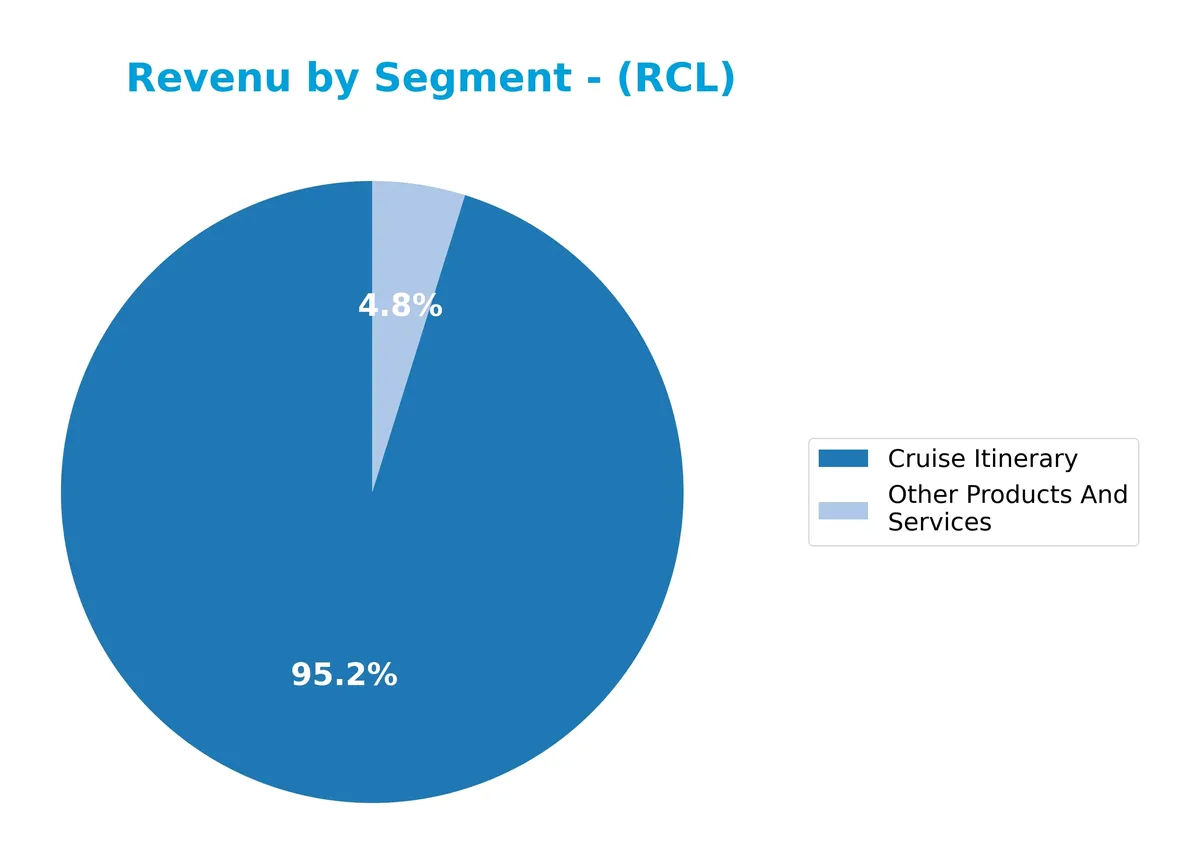
Cruise Itinerary remains the dominant revenue driver, generating 17B in 2025, up from 13.2B in 2023, reflecting strong demand recovery post-pandemic. Other Products And Services contribute a smaller but steady 864M, showing moderate growth. The business increasingly concentrates on core cruise operations, with itinerary revenues accelerating faster than ancillary services, signaling focused capital allocation on high-margin segments.
Key Products & Brands
Royal Caribbean Cruises Ltd. operates key cruise brands and related services generating diversified revenues:
| Product | Description |
|---|---|
| Royal Caribbean International | Flagship cruise brand offering a wide range of itineraries to about 1,000 global destinations. |
| Celebrity Cruises | Premium cruise line targeting upscale travelers with diverse itineraries worldwide. |
| Azamara | Boutique cruise brand focusing on immersive, destination-rich experiences. |
| Silversea Cruises | Luxury cruise brand providing all-inclusive voyages to exclusive locations. |
| Cruise Itinerary Revenue | Income from passenger cruise bookings and related travel services, the largest revenue segment. |
| Other Products And Services | Revenue from onboard services, merchandise, and ancillary offerings supporting cruise operations. |
Royal Caribbean’s portfolio combines mainstream, premium, boutique, and luxury cruise brands. Cruise itinerary sales dominate revenue, reflecting strong market demand. Ancillary services complement core offerings, enhancing customer experience and profitability.
Main Competitors
There are 5 main competitors in the Travel Services industry; below are the top 5 leaders by market capitalization:
| Competitor | Market Cap. |
|---|---|
| Booking Holdings Inc. | 172B |
| Airbnb, Inc. | 82B |
| Royal Caribbean Cruises Ltd. | 77B |
| Expedia Group, Inc. | 33B |
| Norwegian Cruise Line Holdings Ltd. | 10B |
Royal Caribbean Cruises Ltd. ranks 3rd among its peers, with a market cap 53% of the sector leader, Booking Holdings. It sits above both the average market cap of the top 10 competitors (75B) and the sector median (77B). The company edges its nearest rival by approximately 9.4%, demonstrating a solid mid-tier position in this competitive landscape.
Comparisons with competitors
Check out how we compare the company to its competitors:
Does RCL have a competitive advantage?
Royal Caribbean Cruises Ltd. shows a very favorable competitive advantage, with ROIC exceeding WACC by 4%, indicating value creation and efficient capital use. Its growing ROIC trend confirms increasing profitability and a sustainable moat.
Looking ahead, RCL leverages a diversified brand portfolio and global reach, serving 1,000 destinations. Expansion into Asia Pacific and Europe markets supports future revenue growth and operational opportunities.
SWOT Analysis
This SWOT analysis highlights Royal Caribbean Cruises Ltd.’s key internal and external factors to guide strategic decisions.
Strengths
- strong brand portfolio
- high gross and net margins
- growing ROIC well above WACC
Weaknesses
- weak liquidity ratios
- high debt-to-equity ratio
- low asset turnover
Opportunities
- expanding Asia-Pacific market
- increasing global travel demand
- fleet modernization potential
Threats
- economic downturn impacts
- rising fuel and operational costs
- regulatory and environmental pressures
Royal Caribbean’s strengths in profitability and competitive advantage support growth initiatives. However, liquidity and leverage risks require cautious capital management. Strategic focus on emerging markets and cost control will be critical to navigate industry volatility.
Stock Price Action Analysis
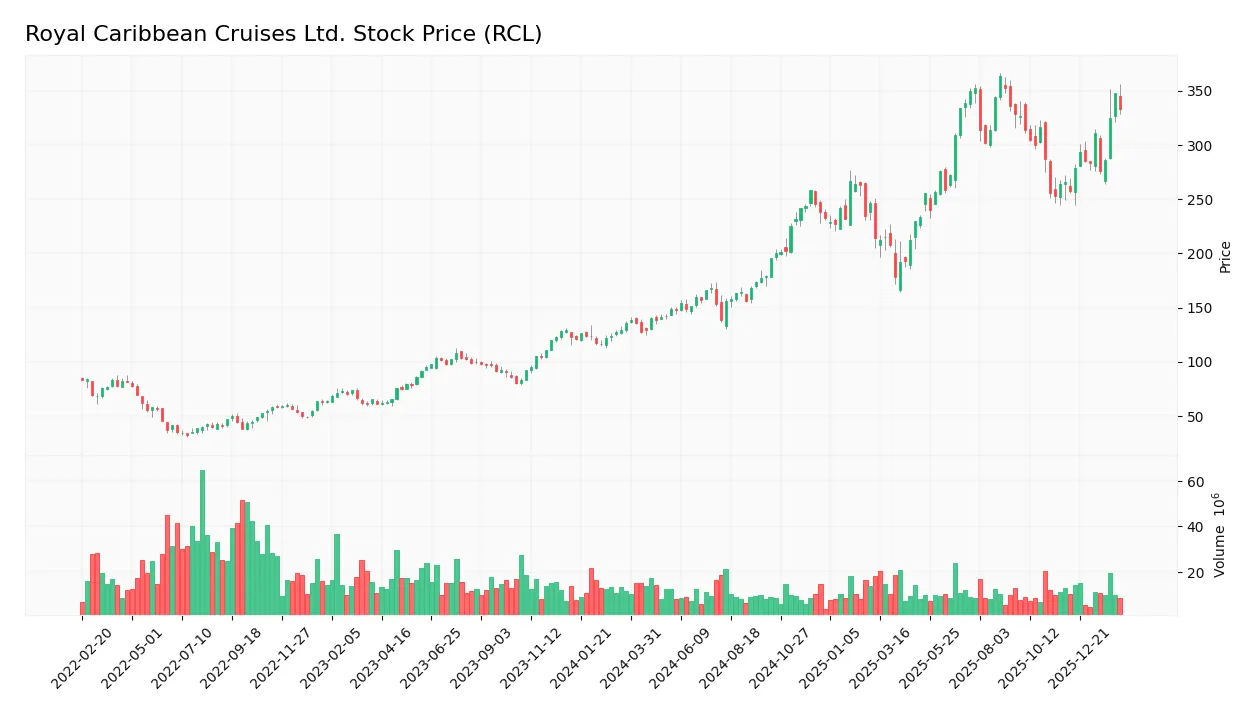
The weekly stock chart for Royal Caribbean Cruises Ltd. (RCL) highlights significant price movements and volatility over the past 12 months:
Trend Analysis
Over the past year, RCL’s stock price rose 144.67%, indicating a strong bullish trend with clear acceleration. The highest price reached 363.22, and the lowest was 127.67. Volatility is high, with a standard deviation of 66.69, reflecting substantial price swings during this period.
Volume Analysis
Trading volumes over the last three months show strongly buyer-driven activity, with buyers accounting for 70.16% of volume. Despite decreasing overall volume, buyer dominance suggests sustained investor interest and positive market participation amid waning turnover.
Target Prices
Analysts present a solid target consensus for Royal Caribbean Cruises Ltd., reflecting cautious optimism.
| Target Low | Target High | Consensus |
|---|---|---|
| 318 | 425 | 367.5 |
The target range suggests upside potential near 15-20% from current levels, indicating moderate confidence in recovery and growth prospects.

Don’t Let Luck Decide Your Entry Point
Optimize your entry points with our advanced ProRealTime indicators. You’ll get efficient buy signals with precise price targets for maximum performance. Start outperforming now!
Analyst & Consumer Opinions
This section reviews analyst ratings and consumer feedback to provide a comprehensive view of Royal Caribbean Cruises Ltd.’s market perception.
Stock Grades
Here are the latest verified grades from leading financial institutions for Royal Caribbean Cruises Ltd.:
| Grading Company | Action | New Grade | Date |
|---|---|---|---|
| Tigress Financial | Maintain | Buy | 2026-02-06 |
| Morgan Stanley | Maintain | Equal Weight | 2026-02-03 |
| JP Morgan | Maintain | Overweight | 2026-02-02 |
| Goldman Sachs | Maintain | Buy | 2026-02-02 |
| Citigroup | Maintain | Buy | 2026-02-02 |
| Wells Fargo | Maintain | Overweight | 2026-02-02 |
| Barclays | Maintain | Overweight | 2026-01-30 |
| Stifel | Maintain | Buy | 2026-01-30 |
| Jefferies | Maintain | Hold | 2026-01-30 |
| Goldman Sachs | Maintain | Buy | 2026-01-23 |
The consensus reflects a strong inclination toward buying, with most firms maintaining Buy or Overweight ratings. Hold ratings exist but are less frequent, indicating moderate confidence in the stock’s near-term prospects.
Consumer Opinions
Royal Caribbean Cruises Ltd. (RCL) enjoys a loyal customer base, yet faces criticism on service consistency.
| Positive Reviews | Negative Reviews |
|---|---|
| “Exceptional on-board entertainment and activities.” | “Long wait times for customer service on busy days.” |
| “Spacious cabins with stunning ocean views.” | “Occasional delays in embarkation and disembarkation.” |
| “Friendly and professional staff throughout the cruise.” | “Food quality varies between cruises.” |
Overall, consumers praise Royal Caribbean for its immersive experience and hospitality. However, repeated concerns about operational delays and service variability suggest areas needing improvement.
Risk Analysis
The table below summarizes key risks Royal Caribbean Cruises Ltd. faces, highlighting their likelihood and potential impact on the business:
| Category | Description | Probability | Impact |
|---|---|---|---|
| Financial Leverage | High debt-to-equity ratio (2.26) increases default risk. | High | High |
| Liquidity | Very low current (0.18) and quick ratios (0.16) signal tight liquidity. | High | High |
| Market Volatility | Beta of 1.87 implies shares are highly sensitive to market swings. | Medium | Medium |
| Asset Efficiency | Low asset turnover (0.43) may reduce return on invested capital. | Medium | Medium |
| Valuation | Elevated price-to-book ratio (7.53) suggests potential overvaluation. | Medium | Medium |
| Dividend Yield | Low yield (0.35%) limits income appeal for investors. | Low | Low |
I see liquidity and leverage as the most pressing risks. The company’s current ratio is well below 1, restricting its ability to cover short-term obligations. High debt levels compound this risk, especially given the cyclical travel industry. The Altman Z-score in the grey zone confirms moderate financial distress risk, demanding cautious monitoring.
Should You Buy Royal Caribbean Cruises Ltd.?
Royal Caribbean Cruises Ltd. appears to be improving profitability with strong value creation and a durable competitive moat supported by growing ROIC. Despite a challenging leverage profile and moderate credit risk in the grey zone, the company’s overall rating is B, suggesting a cautiously favorable outlook.
Strength & Efficiency Pillars
Royal Caribbean Cruises Ltd. exhibits impressive operational efficiency with a net margin of 23.82% and a return on equity (ROE) of 42.57%. The company’s return on invested capital (ROIC) stands at 14.9%, comfortably exceeding its weighted average cost of capital (WACC) of 10.87%. This places Royal Caribbean in the category of a value creator, signaling robust value generation from its capital base. I note the firm’s growing ROIC trend, reflecting a sustainable competitive advantage in profitability.
Weaknesses and Drawbacks
While the Altman Z-Score of 2.51 places Royal Caribbean in the grey zone, indicating moderate bankruptcy risk, several financial red flags persist. The company’s current ratio is critically low at 0.18, raising liquidity concerns. Its debt-to-equity ratio of 2.26 signals high leverage, which could pressure cash flows. Valuation metrics are stretched, with a price-to-book ratio of 7.53, suggesting a significant premium. These factors generate risk despite favorable margins and operational growth.
Our Final Verdict about Royal Caribbean Cruises Ltd.
Royal Caribbean presents a fundamentally solid profile with strong profitability and value creation. However, its placement in the Altman Z-Score grey zone and liquidity challenges temper enthusiasm. Despite the bullish long-term trend and strong recent buyer dominance (70.16%), the financial leverage and valuation concerns suggest a cautious, wait-and-see stance. This profile might appeal to investors with a higher risk tolerance but may appear too risky for conservative capital.
Disclaimer: This content is for informational purposes only and does not constitute financial, investment, or other professional advice. Investing in financial markets involves a significant risk of loss, and past performance is not indicative of future results.
Additional Resources
- Royal Caribbean Group announces proposed offering of senior unsecured notes – PR Newswire (Feb 12, 2026)
- Royal Caribbean Blog – Unofficial blog about Royal Caribbean cruises – Royal Caribbean Blog (Feb 12, 2026)
- Royal Caribbean Cruises Ltd. (NYSE:RCL) Announces Dividend Increase – $1.50 Per Share – MarketBeat (Feb 11, 2026)
- Royal Caribbean Raises Dividend 50%: Is Cash Flow Strong Enough? – TradingView (Feb 11, 2026)
- Royal Caribbean’s (RCL) Record 2025 Profits Meet Carbon Challenges of the Cruise Industry – CarbonCredits.com (Jan 30, 2026)
For more information about Royal Caribbean Cruises Ltd., please visit the official website: rclinvestor.com