Home > Analyses > Consumer Cyclical > Ross Stores, Inc.
Ross Stores, Inc. transforms bargain shopping into a daily thrill for millions. As a dominant force in off-price retail apparel, it operates nearly 2,000 stores nationwide, including the well-known Ross Dress for Less and dd’s DISCOUNTS brands. Renowned for delivering high-quality fashion at steep discounts, Ross excels in appealing to value-conscious consumers. Now, as retail dynamics evolve, I ask: does Ross’s strong market position still support its current valuation and future growth?
Table of contents
Business Model & Company Overview
Ross Stores, Inc., founded in 1957 and headquartered in Dublin, California, dominates the off-price retail apparel and home fashion sector. Operating nearly 1,950 stores nationwide, it unites its Ross Dress for Less and dd’s DISCOUNTS brands into a cohesive ecosystem targeting middle- and moderate-income households. This dual-brand approach ensures broad market penetration while maintaining a clear value proposition across apparel, footwear, accessories, and home fashions.
The company’s revenue engine balances product sales across department and discount stores, leveraging its scale to offer compelling prices. Ross Stores thrives on high inventory turnover and geographic diversity, with strongholds in 40 states, D.C., and Guam. Its expansive footprint in the Americas cements a competitive edge. Ross Stores’ economic moat stems from its proven ability to deliver value-driven, off-price retailing, shaping industry standards in affordable fashion.
Financial Performance & Fundamental Metrics
I will analyze Ross Stores, Inc.’s income statement, key financial ratios, and dividend payout policy to assess its fundamental strength and shareholder value.
Income Statement
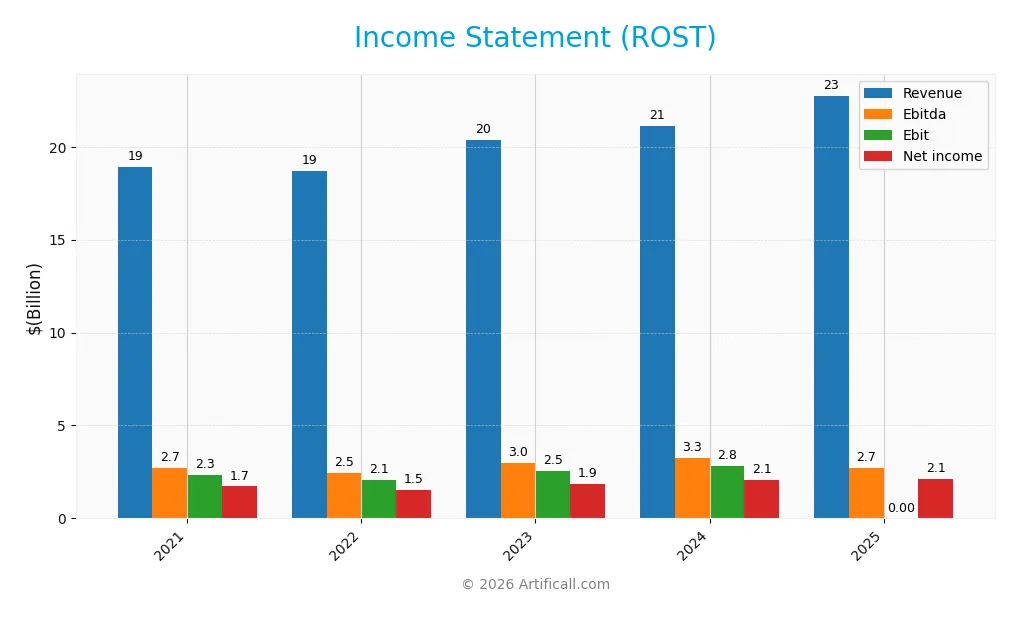
This table summarizes Ross Stores, Inc.’s key income statement figures for fiscal years 2021 through 2025.
| 2021 | 2022 | 2023 | 2024 | 2025 | |
|---|---|---|---|---|---|
| Revenue | 18.9B | 18.7B | 20.4B | 21.1B | 22.8B |
| Cost of Revenue | 13.7B | 13.9B | 14.8B | 15.3B | 0 |
| Operating Expenses | 2.9B | 2.8B | 3.3B | 3.3B | 3.6B |
| Gross Profit | 5.2B | 4.7B | 5.6B | 5.9B | 0 |
| EBITDA | 2.7B | 2.5B | 3.0B | 3.3B | 2.7B |
| EBIT | 2.3B | 2.1B | 2.5B | 2.8B | 0 |
| Interest Expense | 75M | 81M | 74M | 63M | 0 |
| Net Income | 1.7B | 1.5B | 1.9B | 2.1B | 2.1B |
| EPS | 4.9 | 4.4 | 5.6 | 6.4 | 6.7 |
| Filing Date | 2022-03-29 | 2023-03-28 | 2024-04-02 | 2025-04-01 | 2026-03-03 |
Income Statement Evolution
Ross Stores’ revenue rose 20.3% from 2021 to 2025, showing steady growth. Net income increased 24.5% over the same period. However, gross profit and EBIT margins turned unfavorable in 2025, with gross profit dropping to zero. The net margin remained favorable at 9.43%, though it declined slightly in the last year, indicating margin compression despite revenue gains.
Is the Income Statement Favorable?
The 2025 income statement reveals mixed fundamentals. Revenue grew 7.7% year-over-year, but gross profit and EBIT collapsed, signaling cost pressure or reporting anomalies. Operating expenses grew in line with revenue, hurting operating leverage. Net margin fell modestly, though EPS improved 4.6%, reflecting share count reduction or tax benefits. Overall, the income statement appears neutral, balancing strengths in top-line growth and EPS against margin deterioration.
Financial Ratios
The following table presents key financial ratios for Ross Stores, Inc. over the past five fiscal years, illustrating profitability, valuation, liquidity, leverage, efficiency, and dividend metrics:
| Ratios | 2021 | 2022 | 2023 | 2024 | 2025 |
|---|---|---|---|---|---|
| Net Margin | 9.1% | 8.1% | 9.2% | 9.9% | 9.4% |
| ROE | 42.4% | 35.3% | 38.5% | 38.0% | 33.1% |
| ROIC | 17.7% | 14.5% | 15.8% | 16.8% | 17.1% |
| P/E | 19.9 | 26.8 | 25.1 | 23.7 | 28.3 |
| P/B | 8.5 | 9.5 | 9.7 | 9.0 | 9.4 |
| Current Ratio | 1.77 | 1.90 | 1.77 | 1.62 | 1.58 |
| Quick Ratio | 1.24 | 1.34 | 1.24 | 1.09 | 1.04 |
| D/E | 1.38 | 1.33 | 1.18 | 1.03 | 0.80 |
| Debt-to-Assets | 41.2% | 42.5% | 40.2% | 38.1% | 33.5% |
| Interest Coverage | 31.0 | 24.7 | 31.1 | 40.8 | 0 |
| Asset Turnover | 1.39 | 1.39 | 1.42 | 1.42 | 1.46 |
| Fixed Asset Turnover | 3.19 | 2.98 | 3.06 | 2.98 | 2.99 |
| Dividend Yield | 1.18% | 1.06% | 0.97% | 0.99% | 0.87% |
Evolution of Financial Ratios
Return on Equity (ROE) declined from 42.4% in 2021 to 33.1% in 2025, indicating reduced profitability. The Current Ratio decreased from 1.77 to 1.58, reflecting slightly lower liquidity but remaining healthy. Debt-to-Equity Ratio improved from 1.38 to 0.80, showing reduced leverage and a more conservative capital structure over the period.
Are the Financial Ratios Favorable?
In 2025, profitability metrics show mixed signals: ROE (33.1%) and ROIC (17.1%) are favorable, exceeding the WACC (7.8%), but Net Margin (9.4%) is neutral. Liquidity ratios, Current (1.58) and Quick (1.04), are favorable, supporting short-term stability. Leverage ratios are neutral, with Debt-to-Equity at 0.8. Market multiples like P/E (28.3) and P/B (9.4) are unfavorable, indicating a high valuation. Overall, ratios are slightly favorable but warrant caution.
Shareholder Return Policy
Ross Stores, Inc. maintains a dividend payout ratio near 24-28%, with dividends per share steadily rising to $1.64 in 2025. The annual dividend yield stands below 1%, supported by free cash flow coverage and complemented by ongoing share buyback programs.
This disciplined distribution approach aligns with the company’s stable profitability and cash flow generation. The payout remains sustainable without compromising capital expenditures, supporting long-term shareholder value while mitigating risks of over-distribution or excessive repurchases.
Score analysis
The radar chart below highlights Ross Stores, Inc.’s key financial scores across valuation, profitability, and leverage metrics:
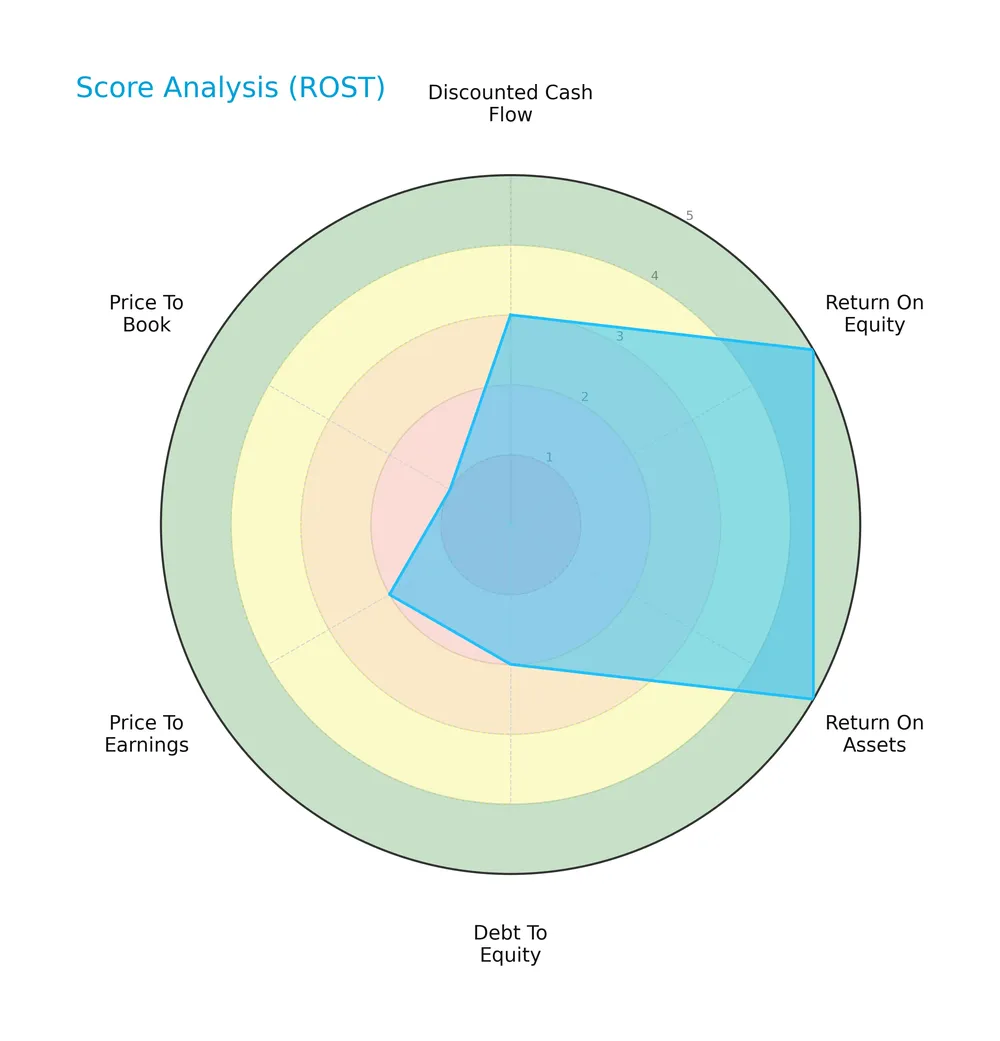
Ross Stores scores well on return on equity and assets with top marks, signaling strong profitability. However, debt-to-equity, price-to-earnings, and price-to-book scores lag, indicating valuation concerns and leverage risks.
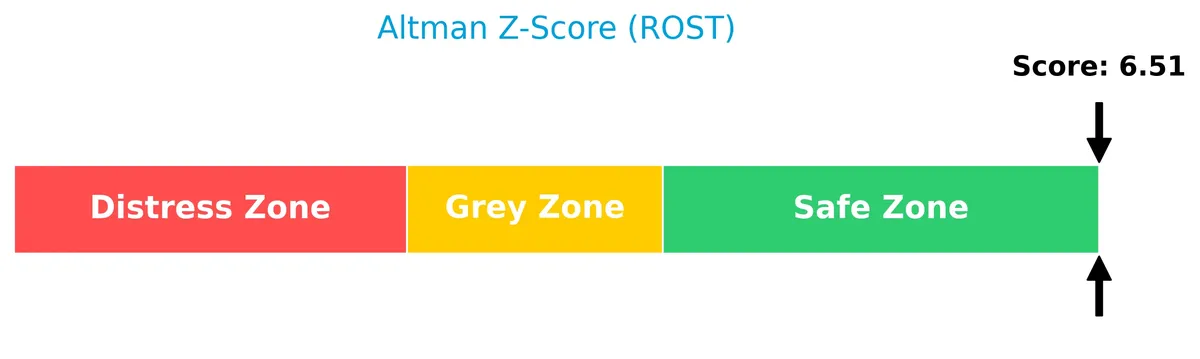
Analysis of the company’s bankruptcy risk
Ross Stores’ Altman Z-Score firmly places it in the safe zone, signaling low bankruptcy risk and solid financial stability:
Is the company in good financial health?
The Piotroski F-Score chart illustrates Ross Stores’ moderate financial strength based on key performance metrics:

With a score of 6, the company shows average financial health, reflecting some operational efficiency but room to strengthen profitability and balance sheet robustness.
Competitive Landscape & Sector Positioning
This analysis examines Ross Stores, Inc.’s strategic positioning within the apparel retail sector, focusing on key business segments and competitors. I will evaluate whether Ross Stores holds a sustainable competitive advantage over its peers.
Strategic Positioning
Ross Stores, Inc. maintains a diversified product portfolio spanning apparel, accessories, footwear, and home fashions. It operates approximately 1,950 off-price stores across 40 states, D.C., and Guam, focusing on middle- and moderate-income households through two distinct retail brands.
Revenue by Segment
This pie chart illustrates Ross Stores, Inc.’s revenue distribution across product segments for fiscal year 2024, highlighting the company’s diverse retail portfolio.
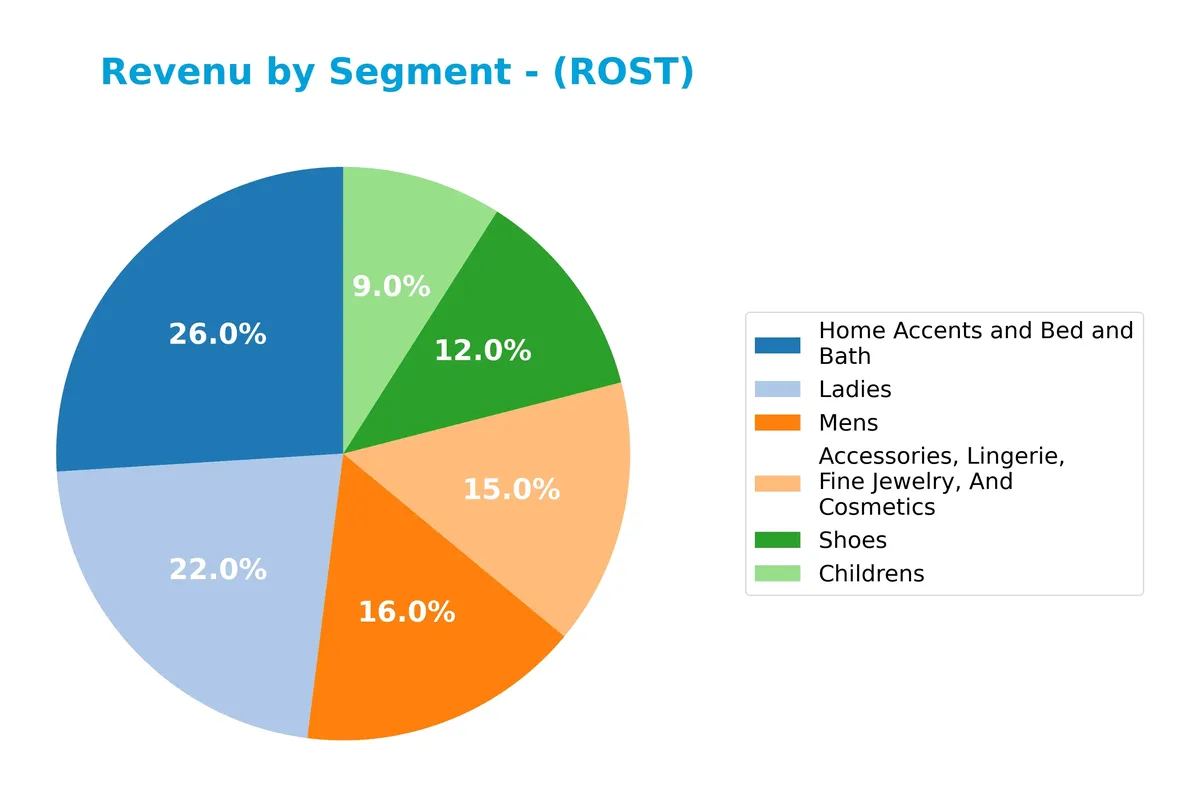
In 2024, Home Accents and Bed and Bath led with 5.5B, followed by Ladies at 4.6B and Mens at 3.4B. Accessories and Shoes contributed 3.2B and 2.5B respectively, while Childrens lagged at 1.9B. The steady growth in Home Accents and Mens segments signals strategic strength, though Shoes showed slight deceleration, warranting close monitoring for potential concentration risks.
Key Products & Brands
Ross Stores generates revenue from diverse apparel and home fashion categories, detailed as follows:
| Product | Description |
|---|---|
| Accessories, Lingerie, Fine Jewelry, And Cosmetics | Includes fashion accessories, lingerie, fine jewelry, and cosmetic products catering to middle and moderate income households. |
| Childrens | Apparel and related products designed for children, targeting value-conscious families. |
| Home Accents and Bed and Bath | Home fashion items including decorative accents, bedding, and bath products sold at off-price stores. |
| Ladies | Women’s apparel and related accessories offered primarily through Ross Dress for Less stores. |
| Mens | Men’s clothing and accessories distributed mainly through department and specialty off-price stores. |
| Shoes | Footwear for men, women, and children, positioned within the off-price retail segment. |
Ross Stores operates primarily through two brands—Ross Dress for Less and dd’s DISCOUNTS—focusing on off-price retail apparel and home fashion across multiple categories. The product mix reflects a balanced exposure to apparel and home goods, appealing to a broad middle-income consumer base.
Main Competitors
Ross Stores, Inc. faces competition from 3 key players, with the table below listing the top 3 leaders by market capitalization:
| Competitor | Market Cap. |
|---|---|
| The TJX Companies, Inc. | 172B |
| Ross Stores, Inc. | 59B |
| Lululemon Athletica Inc. | 24B |
Ross Stores ranks 2nd among its competitors, holding 37.4% of the market cap of the leader, The TJX Companies. The company is below the average market cap of the top 10 in its sector but above the median for the Apparel – Retail industry. It enjoys a substantial 167.13% lead over its closest competitor.
Comparisons with competitors
Check out how we compare the company to its competitors:
Does ROST have a competitive advantage?
Ross Stores, Inc. presents a slight competitive advantage by creating value with a ROIC exceeding its WACC by 9.3%. However, its ROIC trend shows a decline, signaling weakening profitability.
Looking ahead, the company operates nearly 1,950 off-price retail stores across 40 states, targeting middle and moderate income households. Expansion opportunities remain in new markets and product categories within apparel and home fashions.
SWOT Analysis
This analysis highlights Ross Stores, Inc.’s key strategic factors to inform investment decisions.
Strengths
- Strong ROE at 33%
- ROIC exceeds WACC, indicating value creation
- Large market cap of 64B
Weaknesses
- Declining ROIC trend signals weakening profitability
- High PE and PB ratios suggest overvaluation
- Interest coverage ratio unfavorable
Opportunities
- Expansion into new states and markets
- Growth in off-price retail sector
- Leveraging e-commerce channels
Threats
- Economic downturns reduce discretionary spending
- Intense competition in apparel retail
- Supply chain disruptions affect inventory
Ross Stores shows solid profitability and value creation but faces margin pressure and valuation risks. The company must focus on operational efficiency and market expansion to sustain growth amid competitive and economic challenges.
Stock Price Action Analysis
The following weekly chart illustrates Ross Stores, Inc. (ROST) stock price movements and key levels over the past 100 weeks:
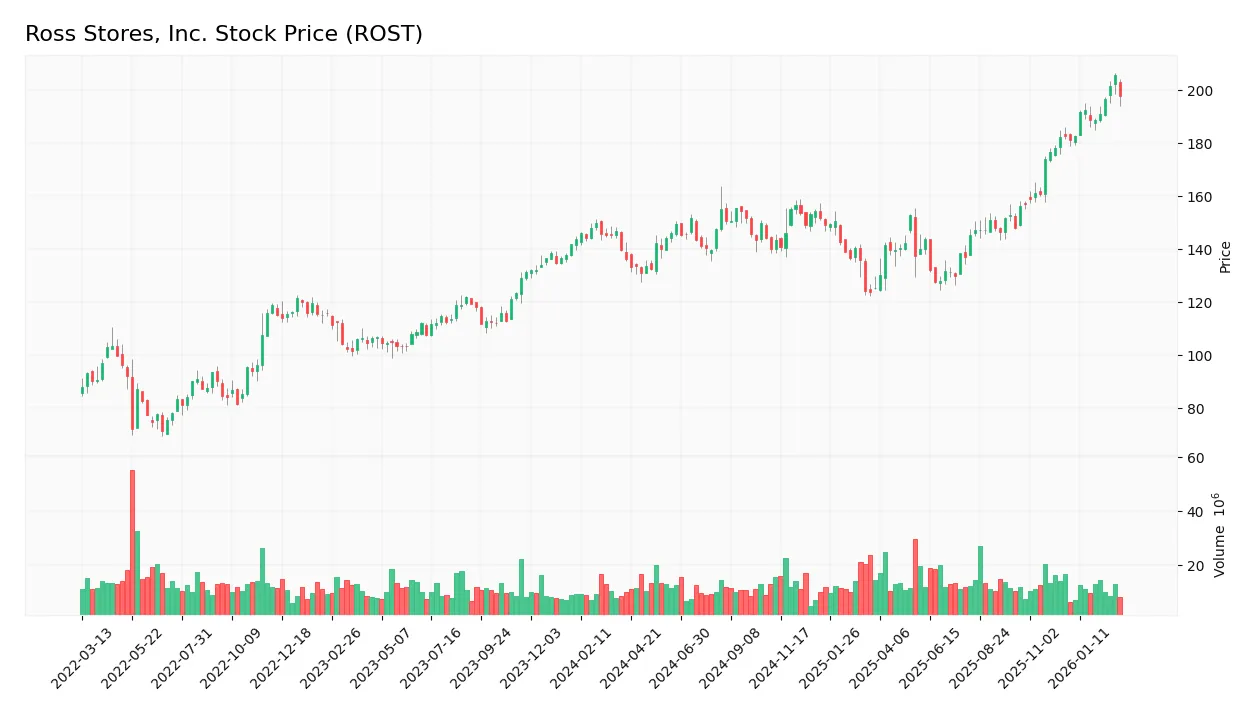
Trend Analysis
Over the past 100 weeks, ROST shares gained 45.33%, reflecting a clear bullish trend with accelerating momentum. Price volatility remains elevated with an 18.49 standard deviation. The stock reached a high of 205.64 and a low of 123.54, emphasizing significant upward movement. Recent three-month gains of 8.35% confirm continued positive momentum.
Volume Analysis
Trading volume shows a steady increase, totaling 1.48B shares with buyers accounting for 57%. In the recent quarter, buyer dominance surged to 81.6%, indicating strong buyer-driven demand and heightened investor confidence in the stock’s upward trajectory.
Target Prices
Analysts set a clear target consensus for Ross Stores, Inc., reflecting confident bullish expectations.
| Target Low | Target High | Consensus |
|---|---|---|
| 180 | 221 | 201.8 |
The target range spans 180 to 221, with a consensus near 202, indicating solid upside potential from current levels.

Don’t Let Luck Decide Your Entry Point
Optimize your entry points with our advanced ProRealTime indicators. You’ll get efficient buy signals with precise price targets for maximum performance. Start outperforming now!
Analyst & Consumer Opinions
This section reviews analyst ratings and consumer feedback to provide a balanced view of Ross Stores, Inc. (ROST).
Stock Grades
Here are the latest verified stock grades from leading financial institutions for Ross Stores, Inc.:
| Grading Company | Action | New Grade | Date |
|---|---|---|---|
| Barclays | Maintain | Overweight | 2026-03-02 |
| Telsey Advisory Group | Maintain | Market Perform | 2026-02-25 |
| JP Morgan | Maintain | Overweight | 2026-02-23 |
| UBS | Maintain | Neutral | 2026-02-17 |
| Goldman Sachs | Maintain | Buy | 2026-02-10 |
| Citigroup | Maintain | Buy | 2026-02-10 |
| UBS | Maintain | Neutral | 2026-01-08 |
| Wells Fargo | Maintain | Overweight | 2025-12-16 |
| Baird | Maintain | Outperform | 2025-11-21 |
| UBS | Maintain | Neutral | 2025-11-21 |
The consensus shows a stable outlook with most firms maintaining positive ratings, primarily Overweight and Buy. Neutral grades persist, reflecting cautious optimism amid steady market conditions.
Consumer Opinions
Consumers express a mix of admiration and frustration toward Ross Stores, Inc., reflecting its value-driven appeal and operational inconsistencies.
| Positive Reviews | Negative Reviews |
|---|---|
| “Great deals on brand-name apparel.” | “Occasionally disorganized store layout.” |
| “Helpful staff and quick checkout.” | “Limited sizes in popular items.” |
| “Consistently low prices beat competitors.” | “Stock levels vary too much by location.” |
Overall, shoppers praise Ross Stores for affordability and customer service. However, inventory management and store organization emerge as notable pain points.
Risk Analysis
The following table summarizes key risks for Ross Stores, Inc., highlighting their likelihood and potential impact:
| Category | Description | Probability | Impact |
|---|---|---|---|
| Valuation Risk | High P/E and P/B ratios suggest the stock is expensive relative to peers. | Medium | Medium |
| Interest Coverage | Zero interest coverage ratio raises concerns about debt servicing. | Low | High |
| Market Cyclicality | Apparel retail faces volatility from economic cycles and consumer spending shifts. | High | High |
| Competitive Risk | Intense competition from online and discount retailers pressures margins. | High | Medium |
| Operational Risk | Supply chain disruptions could affect inventory and sales. | Medium | Medium |
Ross Stores operates in a cyclical sector where consumer spending drives revenue volatility. Its favorable ROIC (17.1%) versus WACC (7.84%) indicates strong capital allocation, but valuation metrics (P/E 28.3, P/B 9.4) are stretched. The zero interest coverage ratio is a red flag, signaling potential vulnerability if earnings dip. Competitive pressure and market fluctuations remain the most likely and impactful risks going forward.
Should You Buy Ross Stores, Inc.?
Ross Stores appears to be a profitable company with strong value creation supported by a slightly favorable moat despite a declining ROIC trend. Its leverage profile is manageable but shows some weaknesses. The overall rating of B+ suggests a very favorable financial health profile.
Strength & Efficiency Pillars
Ross Stores, Inc. displays solid profitability with a net margin of 9.43% and a robust return on equity of 33.13%. Its return on invested capital (ROIC) stands at 17.1%, well above the weighted average cost of capital (WACC) at 7.84%, confirming the company as a clear value creator. Operational efficiency is supported by a strong asset turnover of 1.46. While ROIC shows a slight declining trend, overall, Ross maintains favorable operational margins and capital allocation.
Weaknesses and Drawbacks
Ross Stores faces valuation headwinds with a high price-to-earnings ratio of 28.34 and an elevated price-to-book ratio of 9.39, signaling a premium market valuation that may limit upside. The company’s debt-to-equity ratio is a neutral 0.8, but interest coverage is unfavorable at zero, raising concerns about debt servicing in adverse conditions. Dividend yield is low at 0.87%, which may disappoint income-focused investors. These factors suggest caution despite operational strengths.
Our Final Verdict about Ross Stores, Inc.
The company’s long-term fundamentals appear attractive, underpinned by value creation and strong equity returns. The bullish overall price trend and dominant buyer volume (81.6%) in recent months reinforce positive momentum. However, the premium valuation metrics and mixed leverage signals suggest the stock may require a wait-and-see approach for a more favorable entry point. Ross Stores might appeal to growth-oriented investors willing to tolerate valuation risk.
Disclaimer: This content is for informational purposes only and does not constitute financial, investment, or other professional advice. Investing in financial markets involves a significant risk of loss, and past performance is not indicative of future results.
Additional Resources
- Ross Stores Inc (ROST) Q4 2025 Earnings Call Highlights: Strong Sales Growth and Strategic Expansion – GuruFocus (Mar 04, 2026)
- Ross Stores lifts dividend 10%, starts $2.55B buyback after strong quarter – Stock Titan (Mar 03, 2026)
- Ross Stores beats Q4 on strong holiday sales, sets upbeat guidance (ROST:NASDAQ) – Seeking Alpha (Mar 03, 2026)
- Ross Stores (NASDAQ:ROST) Releases FY 2026 Earnings Guidance – MarketBeat (Mar 04, 2026)
- Ross Stores (ROST) Tops Q4 Earnings and Revenue Estimates – Yahoo Finance (Mar 03, 2026)
For more information about Ross Stores, Inc., please visit the official website: rossstores.com