Home > Analyses > Industrials > Roper Technologies, Inc.
Roper Technologies powers essential industries with cutting-edge software and engineered products that streamline operations worldwide. Its diverse portfolio spans healthcare, transportation, energy, and more, blending innovation with precision. Renowned for integrating cloud-based analytics and advanced instrumentation, Roper transforms complex challenges into efficient solutions. As market dynamics evolve rapidly, I ask: does Roper’s robust foundation still justify its premium valuation and growth ambitions? This analysis seeks to uncover the answer.
Table of contents
Business Model & Company Overview
Roper Technologies, Inc., founded in 1981 and headquartered in Sarasota, Florida, dominates the industrial machinery sector with a diverse portfolio of software and engineered products. It integrates management, diagnostic, and cloud-based solutions into a cohesive ecosystem, powering industries from healthcare to utilities. With 18,200 employees, Roper excels in delivering advanced data analytics and precision instruments that form the backbone of modern industrial operations.
The company’s revenue engine balances recurring software services with high-value hardware sales, ensuring steady cash flow and growth. Roper’s strategic footprint spans the Americas, Europe, and Asia, leveraging cloud-based platforms and specialized machinery to serve global markets. This blend of innovation and scale builds a strong economic moat, positioning Roper as a key architect in the future of industrial technology.
Financial Performance & Fundamental Metrics
I will analyze Roper Technologies, Inc.’s income statement, key financial ratios, and dividend payout policy to assess its fundamental strength and profitability.
Income Statement
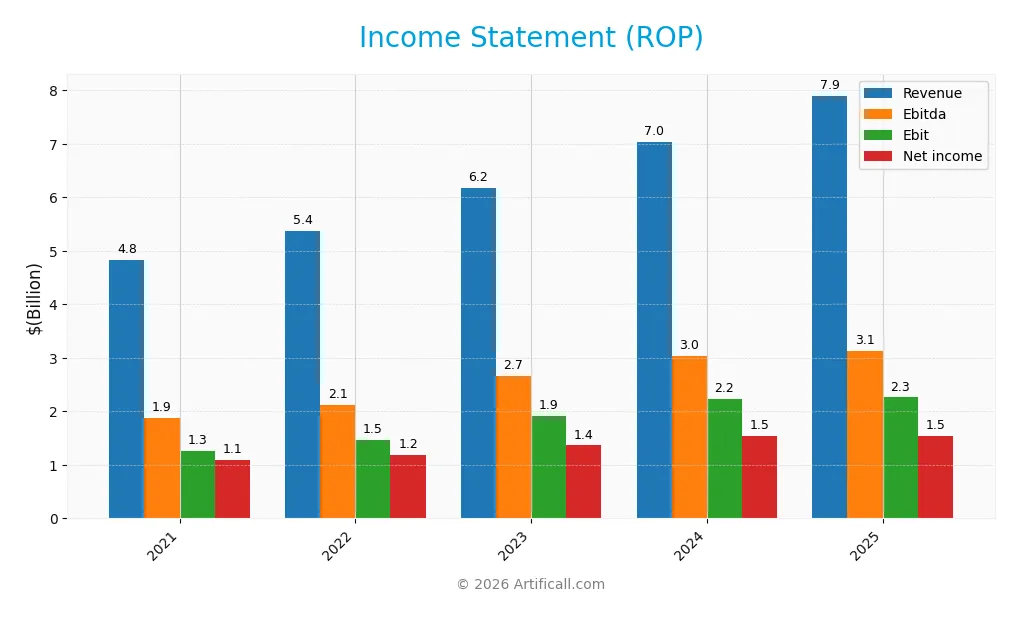
The table below presents Roper Technologies, Inc.’s key income statement metrics for fiscal years 2021 through 2025, reflecting revenue growth and profitability trends.
| 2021 | 2022 | 2023 | 2024 | 2025 | |
|---|---|---|---|---|---|
| Revenue | 4.83B | 5.37B | 6.18B | 7.04B | 7.90B |
| Cost of Revenue | 1.43B | 1.62B | 1.87B | 2.16B | 2.43B |
| Operating Expenses | 2.07B | 2.23B | 2.56B | 2.88B | 3.24B |
| Gross Profit | 3.41B | 3.75B | 4.31B | 4.88B | 5.47B |
| EBITDA | 1.88B | 2.12B | 2.66B | 3.04B | 3.13B |
| EBIT | 1.27B | 1.47B | 1.91B | 2.23B | 2.26B |
| Interest Expense | 234M | 192M | 165M | 259M | 325M |
| Net Income | 1.10B | 1.19B | 1.36B | 1.55B | 1.54B |
| EPS | 10.42 | 11.22 | 12.80 | 14.47 | 14.31 |
| Filing Date | 2022-02-22 | 2023-02-27 | 2024-02-22 | 2025-02-24 | 2026-02-24 |
Income Statement Evolution
Roper Technologies delivered steady revenue growth, rising 12.3% from 2024 to 2025 and 63.5% over five years. Net income followed suit with a 40.1% increase over the period, although it slightly declined by 1.3% year-over-year. Margins remain generally healthy, with gross margin at 69.2% and EBIT margin steady near 28.6%, reflecting consistent operational efficiency.
Is the Income Statement Favorable?
In 2025, Roper’s fundamentals show strength with a favorable gross margin of 69.24% and a net margin of 19.44%. Operating expenses grew in line with revenue, which limited EBIT growth to a modest 1.6%. Interest expense, at 4.11% of revenue, remains manageable. However, net margin and EPS declined slightly, signaling some pressure on profitability despite overall favorable performance.
Financial Ratios
The table below summarizes key financial ratios for Roper Technologies, Inc. over the past five fiscal years, providing insight into profitability, valuation, liquidity, leverage, efficiency, and dividend metrics:
| Ratios | 2021 | 2022 | 2023 | 2024 | 2025 |
|---|---|---|---|---|---|
| Net Margin | 22.7% | 22.1% | 22.1% | 22.0% | 19.4% |
| ROE | 9.5% | 7.4% | 7.8% | 8.2% | 7.7% |
| ROIC | 4.9% | 4.7% | 5.3% | 5.5% | 5.6% |
| P/E | 47.2 | 38.5 | 42.6 | 35.9 | 31.1 |
| P/B | 4.48 | 2.85 | 3.33 | 2.95 | 2.40 |
| Current Ratio | 0.78 | 0.67 | 0.50 | 0.40 | 0.52 |
| Quick Ratio | 0.75 | 0.63 | 0.46 | 0.37 | 0.48 |
| D/E | 0.69 | 0.42 | 0.37 | 0.41 | 0.47 |
| Debt-to-Assets | 33.6% | 24.9% | 22.6% | 24.5% | 26.9% |
| Interest Coverage | 5.7x | 7.9x | 10.6x | 7.7x | 6.9x |
| Asset Turnover | 0.20 | 0.20 | 0.22 | 0.22 | 0.23 |
| Fixed Asset Turnover | 47.0 | 63.0 | 51.7 | 47.0 | 50.4 |
| Dividend Yield | 0.46% | 0.57% | 0.50% | 0.58% | 0.74% |
Evolution of Financial Ratios
Roper Technologies’ Return on Equity (ROE) declined from 9.48% in 2021 to 7.73% in 2025, indicating reduced profitability. The Current Ratio steadily dropped from 0.78 to 0.52, signaling weakening liquidity. Meanwhile, the Debt-to-Equity Ratio improved from 0.69 to 0.47, reflecting more prudent leverage management over the period.
Are the Financial Ratios Favorable?
In 2025, profitability shows mixed signals: a favorable net margin of 19.44% contrasts with an unfavorable ROE of 7.73%. Liquidity ratios like Current and Quick Ratios remain below 1, posing concerns. Leverage metrics, including Debt-to-Equity at 0.47 and Interest Coverage near 7, are favorable. Asset turnover is weak, and dividend yield is low. Overall, the ratios reveal a neutral financial profile.
Shareholder Return Policy
Roper Technologies maintains a dividend payout ratio near 21-23%, with dividends per share rising steadily from $2.24 in 2021 to $3.31 in 2025. The annual dividend yield hovers below 1%, supported by free cash flow coverage and complemented by share buybacks.
This distribution policy appears balanced, avoiding excessive payouts or repurchases that could jeopardize cash reserves. The consistent dividend growth and buyback activity support sustainable long-term shareholder value, aligned with the company’s robust profitability and cash flow metrics.
Score analysis
The radar chart below highlights Roper Technologies’ key valuation and profitability metrics:
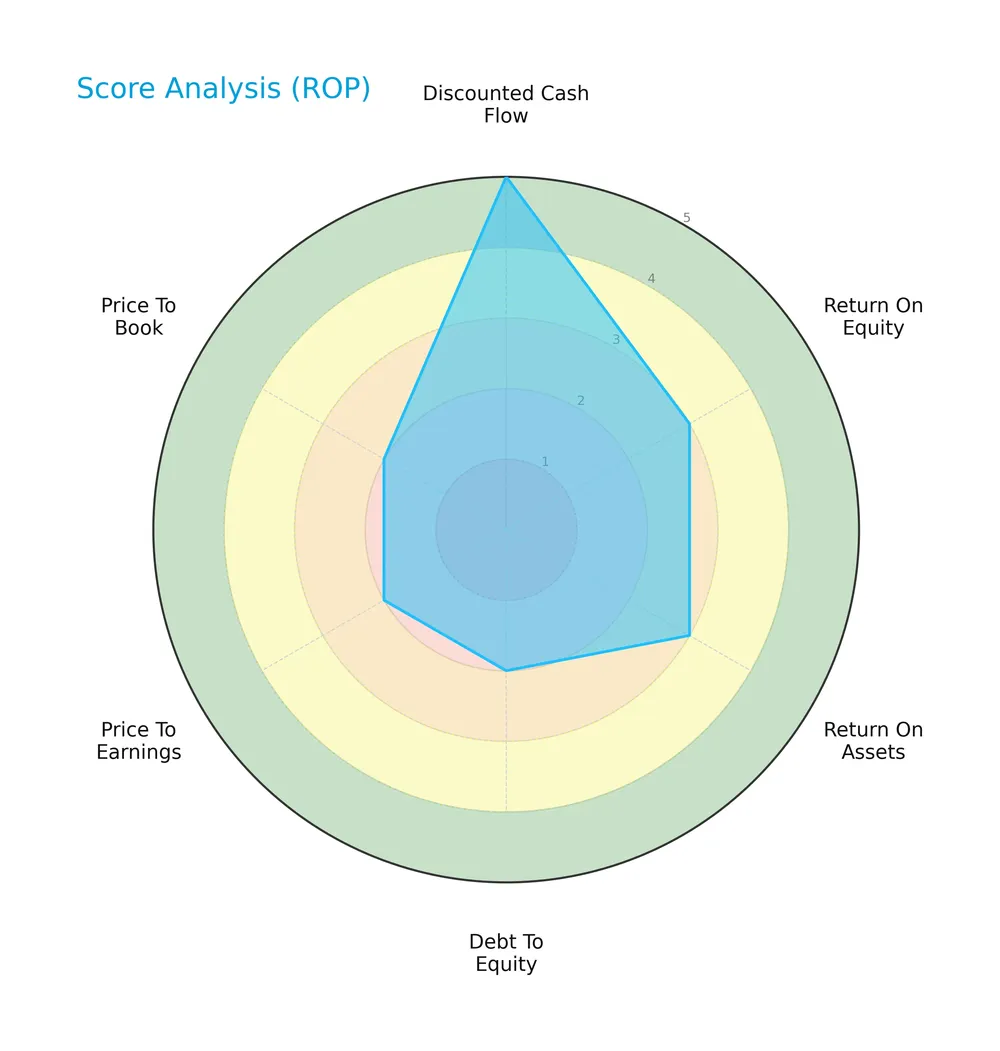
Roper scores very favorably on discounted cash flow at 5, indicating strong intrinsic value. Return on equity and assets both earn moderate scores of 3, reflecting average profitability. Debt to equity, price to earnings, and price to book ratios are unfavorable at 2, signaling some valuation and leverage concerns.
Analysis of the company’s bankruptcy risk
The Altman Z-Score places Roper Technologies in the grey zone, suggesting a moderate risk of financial distress:

Is the company in good financial health?
The Piotroski Score diagram illustrates the company’s financial strength based on nine fundamental criteria:
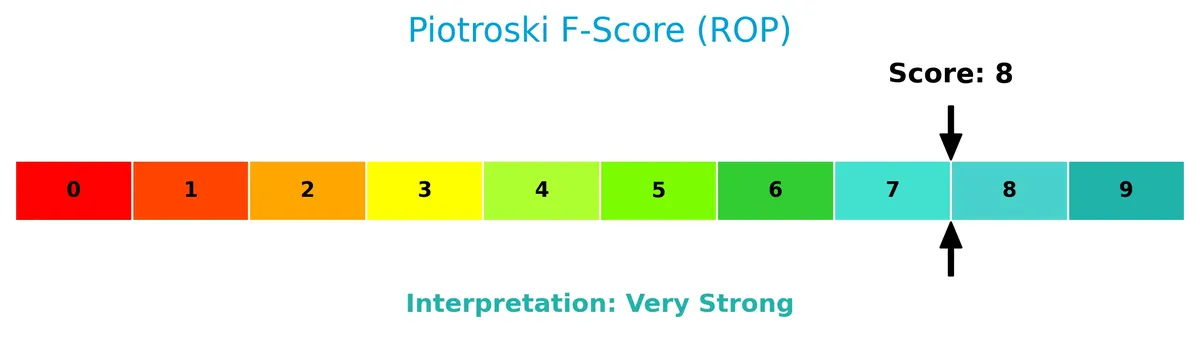
With a score of 8, Roper demonstrates very strong financial health. This high rating implies robust profitability, efficient capital allocation, and solid balance sheet management.
Competitive Landscape & Sector Positioning
This sector analysis examines Roper Technologies’ strategic positioning, revenue segments, and key products within industrial machinery. I will assess its main competitors and evaluate whether Roper holds a competitive advantage. The analysis also includes a SWOT overview to understand strengths and risks clearly.
Strategic Positioning
Roper Technologies maintains a highly diversified product portfolio centered on software and engineered solutions, generating over $12B in software revenue in 2025. Geographically, the company concentrates heavily in the U.S. market, with $6.87B domestic revenue, while maintaining modest international exposure across Europe, Canada, and Asia.
Revenue by Segment
This pie chart illustrates Roper Technologies’ revenue breakdown by product segment for the fiscal year 2025, highlighting the dominance of software-related services.

In 2025, Software And Related Services generated $12.3B, dramatically surpassing previous years’ fragmented segments like Application Software and Network Systems. This consolidation signals strategic focus on scalable software solutions. The shift from diversified segments to a unified software segment suggests operational streamlining and growing reliance on high-margin services. The acceleration from $10.7B in 2024 to $12.3B in 2025 underscores robust demand but also raises concentration risk in a single segment.
Key Products & Brands
Roper Technologies offers a diverse portfolio spanning software, engineered products, and specialized industrial solutions:
| Product | Description |
|---|---|
| Software and Related Services | Cloud-based financial, insurance, healthcare, supply chain, and collaboration software platforms. |
| Application Software Segment | Software solutions for enterprise management, diagnostics, and laboratory information systems. |
| Network Software and Systems | Software and services enabling network operations, transportation, and data analytics. |
| Technology Enabled Products | Devices and automation tools including RFID readers, dispensers, and metering pumps. |
| Measurement and Analytical Solutions | Precision instruments for testing, weighing, and monitoring in industrial and medical fields. |
| Energy Systems and Controls | Control valves, emergency shutoff valves, and turbomachinery control hardware and software. |
| Industrial Technology | Specialized pumps, pressure sensors, vibration monitoring, and related industrial equipment. |
| Medical and Scientific Imaging | Medical devices, ultrasound accessories, and imaging technology solutions. |
Roper’s product range blends software innovation with precision hardware. This combination supports diversified end markets, from healthcare to industrial controls.
Main Competitors
There are 24 competitors in the Industrials sector; the table below lists the top 10 leaders by market capitalization:
| Competitor | Market Cap. |
|---|---|
| Eaton Corporation plc | 127B |
| Parker-Hannifin Corporation | 114B |
| Howmet Aerospace Inc. | 85B |
| Emerson Electric Co. | 76B |
| Illinois Tool Works Inc. | 73B |
| Cummins Inc. | 72B |
| AMETEK, Inc. | 48B |
| Roper Technologies, Inc. | 47B |
| Rockwell Automation, Inc. | 45B |
| Symbotic Inc. | 36B |
Roper Technologies ranks 8th among 24 competitors, with a market cap 29% the size of the leader, Eaton Corporation. It sits below the average market cap of the top 10 (72B) but above the sector median (32B). The company maintains a 33% market cap gap above its closest competitor, AMETEK.
Comparisons with competitors
Check out how we compare the company to its competitors:
Does Roper Technologies have a competitive advantage?
Roper Technologies shows a slightly unfavorable competitive advantage as it currently sheds value, with ROIC below WACC. However, its profitability is improving, reflecting growing efficiency in capital use.
Looking ahead, Roper leverages diverse software and engineered product lines across healthcare, financial services, and utilities. Expanding cloud-based solutions and global market penetration offer opportunities for sustained growth and margin improvement.
SWOT Analysis
This SWOT analysis distills Roper Technologies’ key internal and external factors to guide strategic decisions.
Strengths
- Diversified industrial and software portfolio
- Strong gross margin at 69.24%
- Growing revenue with 12.26% last year
Weaknesses
- Low current and quick ratios (0.52, 0.48) signal liquidity risk
- ROIC below WACC indicates value destruction
- High P/E ratio at 31.06 suggests valuation risk
Opportunities
- Expansion in US and international markets
- Increasing cloud-based software demand
- Growing ROIC trend indicates improving profitability
Threats
- Competitive pressure in industrial machinery sector
- Economic downturn affecting capital spending
- Regulatory changes impacting software and healthcare sectors
Roper’s strengths in diversified products and healthy margins support growth, yet its liquidity constraints and valuation warrant caution. The company must leverage market expansion and ROIC improvements while managing competitive and macroeconomic risks to sustain value creation.
Stock Price Action Analysis
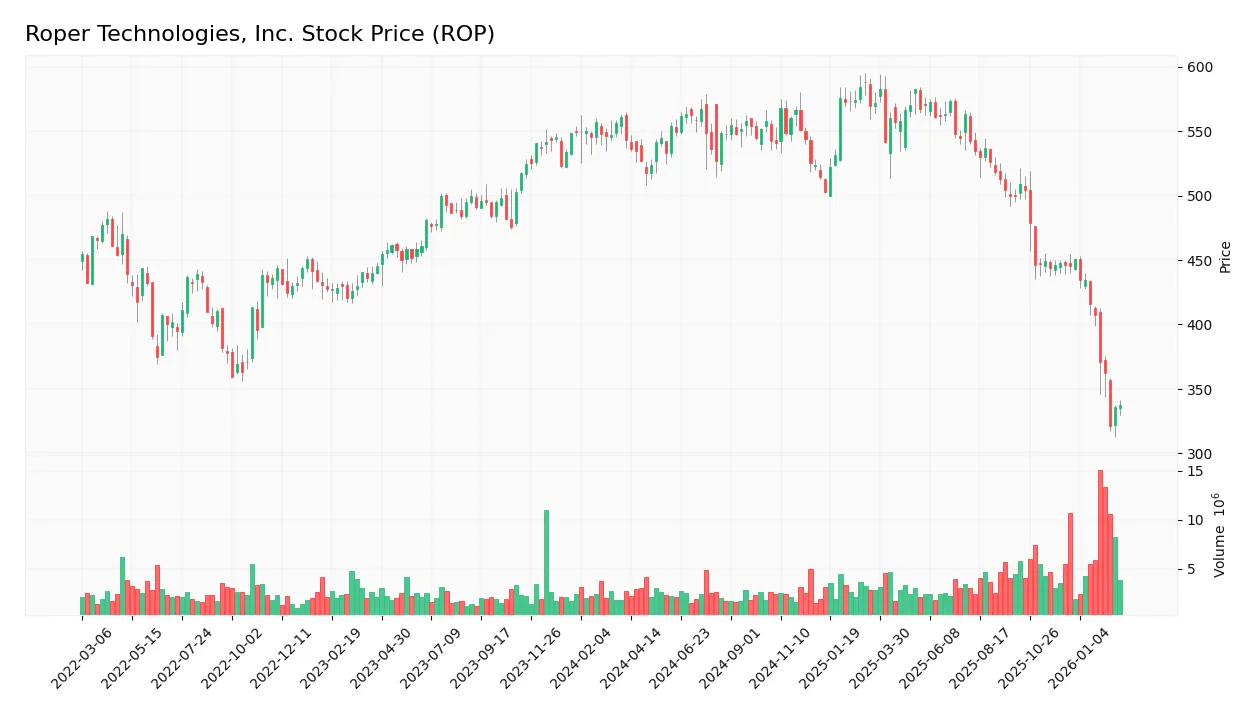
The weekly price chart of Roper Technologies, Inc. (ROP) reveals a notable downward trajectory over the past year:
Trend Analysis
ROP’s stock declined by 37.81% over the past 12 months, confirming a bearish trend with decelerating losses. The price ranged between a high of 588.38 and a low of 321.41. Volatility remains elevated, with a standard deviation of 58.29, indicating continued price swings despite the downward drift.
Volume Analysis
Trading volumes have increased overall, yet sellers dominate with 55.46% of total volume. In the recent three-month period, seller dominance intensified, with buyer participation dropping to 20.79%. This suggests weak investor conviction and persistent selling pressure in the stock.
Target Prices
Analysts set a clear consensus on Roper Technologies’ target range for 2026.
| Target Low | Target High | Consensus |
|---|---|---|
| 365 | 575 | 475.5 |
The target prices reflect strong confidence in Roper’s growth, with a bullish outlook centered near 475.5, signaling robust upside potential.

Don’t Let Luck Decide Your Entry Point
Optimize your entry points with our advanced ProRealTime indicators. You’ll get efficient buy signals with precise price targets for maximum performance. Start outperforming now!
Analyst & Consumer Opinions
This section examines analyst ratings and consumer feedback regarding Roper Technologies, Inc. to provide balanced insights.
Stock Grades
Below is a summary of recent analyst grades for Roper Technologies, Inc., highlighting the latest rating actions and trends:
| Grading Company | Action | New Grade | Date |
|---|---|---|---|
| Goldman Sachs | Maintain | Neutral | 2026-01-29 |
| Argus Research | Downgrade | Hold | 2026-01-28 |
| Mizuho | Maintain | Underperform | 2026-01-28 |
| Stifel | Downgrade | Hold | 2026-01-28 |
| Truist Securities | Maintain | Buy | 2026-01-28 |
| RBC Capital | Maintain | Sector Perform | 2026-01-28 |
| Oppenheimer | Downgrade | Perform | 2026-01-28 |
| Barclays | Maintain | Underweight | 2026-01-28 |
| Citigroup | Maintain | Buy | 2026-01-28 |
| JP Morgan | Maintain | Underweight | 2026-01-28 |
The recent analyst updates show a cautious stance with multiple downgrades from Buy to Hold and Outperform to Perform. However, the consensus remains positive, supported by a majority buy rating, indicating mixed but generally favorable sentiment.
Consumer Opinions
Roper Technologies, Inc. enjoys a generally positive reputation among consumers, reflecting its strong operational performance.
| Positive Reviews | Negative Reviews |
|---|---|
| Reliable product quality with consistent performance. | Customer service can be slow during peak times. |
| Innovative technology that enhances efficiency. | Some users report high pricing compared to competitors. |
| Strong after-sales support and comprehensive warranties. | Occasional delays in product delivery reported. |
Overall, consumers praise Roper’s innovation and dependable product quality. However, service responsiveness and pricing remain areas for improvement, signaling opportunities to refine customer experience.
Risk Analysis
Below is a summary table highlighting key risks for Roper Technologies, Inc., including their likelihood and potential impact:
| Category | Description | Probability | Impact |
|---|---|---|---|
| Liquidity Risk | Current ratio at 0.52 signals weak short-term liquidity. | High | High |
| Valuation Risk | Elevated P/E ratio of 31.06 may indicate overvaluation. | Medium | Medium |
| Profitability | ROE at 7.73% trails WACC of 7%, showing limited value creation. | Medium | Medium |
| Leverage Risk | Debt-to-equity score unfavorable despite manageable debt levels. | Medium | Medium |
| Market Volatility | Beta near 0.93 suggests moderate sensitivity to market swings. | Medium | Medium |
| Bankruptcy Risk | Altman Z-Score in grey zone (2.56) signals moderate distress risk. | Medium | High |
I see liquidity risk as the most pressing concern given the unusually low current and quick ratios. Historically, firms with such tight liquidity face operational constraints, especially in cyclical downturns. The grey-zone Altman Z-Score adds caution, implying vulnerability if market conditions worsen. Meanwhile, profitability metrics like ROE underperforming WACC signal potential capital allocation inefficiencies. Valuation risks are also evident due to the stock’s premium multiples relative to industrial peers. Investors should weigh these risks carefully against Roper’s diversified business model and strong Piotroski score before commitment.
Should You Buy Roper Technologies, Inc.?
Roper Technologies appears to be shedding value despite a growing ROIC, suggesting improving operational efficiency. While its leverage profile might be seen as substantial, the company’s profitability and overall rating of B indicate a moderately favorable investment profile amid some financial risks.
Strength & Efficiency Pillars
Roper Technologies, Inc. delivers robust operational margins, including a gross margin of 69.24% and an EBIT margin of 28.61%. The net margin stands at a solid 19.44%, underscoring efficient cost management. However, its return on invested capital (ROIC) at 5.62% falls below its weighted average cost of capital (WACC) of 7%, signaling that the company is currently destroying value despite improving profitability trends. This disconnect tempers the otherwise favorable operational performance.
Weaknesses and Drawbacks
Roper operates in the Altman Z-Score grey zone with a score of 2.56, indicating moderate bankruptcy risk. This financial uncertainty outweighs some profitability strengths. The firm’s valuation appears stretched, with a price-to-earnings ratio of 31.06 and a price-to-book of 2.4, suggesting limited margin of safety. Liquidity is a clear red flag, as the current ratio is a weak 0.52, signaling potential short-term solvency issues. Additionally, recent market dynamics show seller dominance at 79.21%, intensifying near-term selling pressure.
Our Final Verdict about Roper Technologies, Inc.
Roper’s profile appears mixed. Despite strong operational efficiency and a very strong Piotroski score of 8, the grey zone Z-Score advises caution. The company’s value destruction and liquidity risks make it a speculative choice. Given bearish price trends and seller dominance, investors might consider waiting for improved solvency signals or a more favorable technical setup before committing capital.
Disclaimer: This content is for informational purposes only and does not constitute financial, investment, or other professional advice. Investing in financial markets involves a significant risk of loss, and past performance is not indicative of future results.
Additional Resources
- Roper Technologies: Moat Under Threat As AI Threatens Vertical Software (NASDAQ:ROP) – Seeking Alpha (Feb 25, 2026)
- Equitable Trust Co. Reduces Holdings in Roper Technologies, Inc. $ROP – MarketBeat (Feb 25, 2026)
- ROPER TECHNOLOGIES INC SEC 10-K Report – TradingView (Feb 24, 2026)
- When Should You Buy Roper Technologies, Inc. (NASDAQ:ROP)? – Yahoo Finance (Jan 31, 2026)
- Roper Technologies announces dividend – GlobeNewswire (Feb 19, 2026)
For more information about Roper Technologies, Inc., please visit the official website: ropertech.com