Home > Analyses > Consumer Cyclical > Rollins, Inc.
Rollins, Inc. protects millions of homes and businesses from pests, shaping healthier and safer environments daily. As a dominant player in pest control, it delivers trusted solutions across residential and commercial markets, backed by decades of innovation and quality service. With a diverse client base spanning healthcare to foodservice, Rollins commands a resilient industry position. Yet, as market dynamics evolve, I ask: does its current valuation fully reflect sustainable growth and operational strength?

Table of contents
Business Model & Company Overview
Rollins, Inc., founded in 1948 and headquartered in Atlanta, Georgia, leads the pest and wildlife control industry. It operates a comprehensive ecosystem of residential and commercial services, tackling common pests like rodents, insects, and wildlife. Rollins extends its reach through direct operations and franchisees, serving diverse sectors including healthcare, foodservice, and logistics. This integrated approach cements its position as a dominant player in personal products and services.
The company’s revenue engine balances recurring pest control contracts with ancillary services and termite protection. Rollins leverages its global footprint across the United States and international markets, capitalizing on demand for workplace and residential pest solutions. Its competitive advantage lies in consistent service delivery and franchise scalability, creating a robust economic moat that shapes the future of pest control worldwide.
Financial Performance & Fundamental Metrics
I analyze Rollins, Inc.’s income statement, key financial ratios, and dividend payout policy to assess its operational efficiency and shareholder returns.
Income Statement
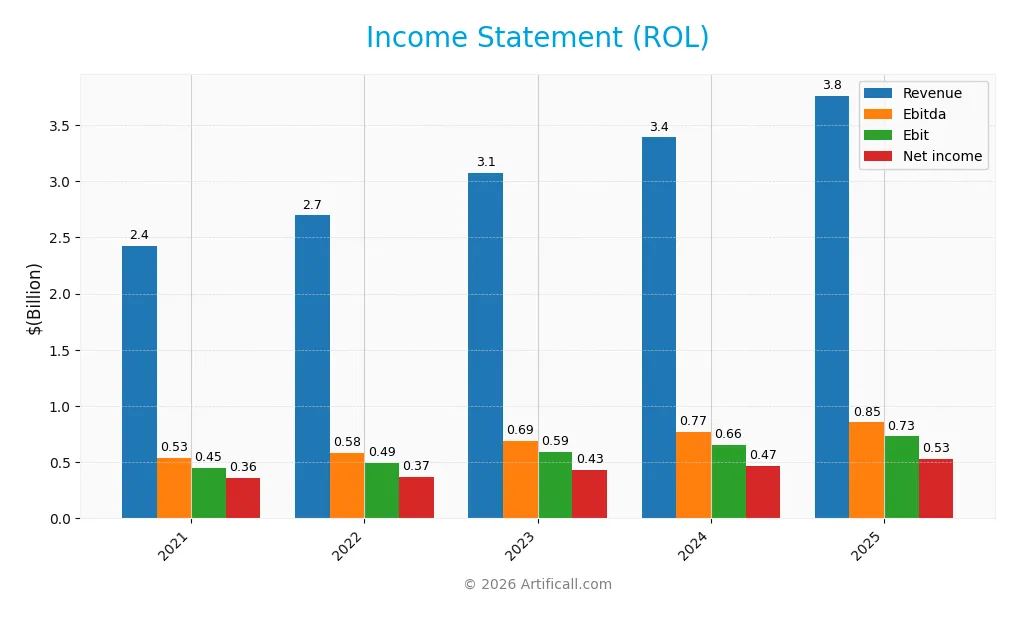
The table below summarizes Rollins, Inc.’s key income statement metrics for the fiscal years 2021 through 2025, showing revenue growth and profitability trends.
| 2021 | 2022 | 2023 | 2024 | 2025 | |
|---|---|---|---|---|---|
| Revenue | 2.42B | 2.70B | 3.07B | 3.39B | 3.76B |
| Cost of Revenue | 1.16B | 1.31B | 1.47B | 1.60B | 1.90B |
| Operating Expenses | 814M | 894M | 1.02B | 1.13B | 1.13B |
| Gross Profit | 1.26B | 1.39B | 1.60B | 1.79B | 1.86B |
| EBITDA | 534M | 585M | 688M | 770M | 854M |
| EBIT | 448M | 493M | 588M | 657M | 729M |
| Interest Expense | 830K | 2.64M | 19.1M | 27.7M | 28.6M |
| Net Income | 357M | 369M | 435M | 466M | 527M |
| EPS | 0.72 | 0.75 | 0.89 | 0.96 | 1.09 |
| Filing Date | 2022-02-25 | 2023-02-16 | 2024-02-15 | 2025-02-13 | 2026-02-12 |
Income Statement Evolution
Rollins, Inc. reported steady revenue growth from 2.42B in 2021 to 3.76B in 2025, a 55% increase overall. Net income rose by nearly 48%, reaching 527M in 2025. Gross margin remained stable near 49%, while EBIT margin improved to 19.4%, signaling better operational efficiency despite a slight net margin decline over the period.
Is the Income Statement Favorable?
The 2025 income statement shows robust fundamentals. Revenue grew 11% year-over-year, driven by favorable cost control as EBIT expanded nearly 11%. Net margin held at 14%, supported by low interest expenses (0.76% of revenue). EPS increased 13.5%, reflecting strong profitability. Overall, 79% of income metrics are favorable, indicating a solid and well-managed earnings profile.
Financial Ratios
The following table summarizes key financial ratios for Rollins, Inc. over the last five fiscal years, illustrating profitability, liquidity, leverage, and valuation metrics:
| Ratios | 2021 | 2022 | 2023 | 2024 | 2025 |
|---|---|---|---|---|---|
| Net Margin | 14.71% | 13.67% | 14.15% | 13.76% | 14.00% |
| ROE | 32.09% | 29.09% | 37.64% | 35.05% | 38.32% |
| ROIC | 20.35% | 21.10% | 19.64% | 20.12% | 20.86% |
| P/E | 47.21 | 48.80 | 49.19 | 48.13 | 55.17 |
| P/B | 15.15 | 14.20 | 18.52 | 16.87 | 21.14 |
| Current Ratio | 0.72 | 0.71 | 0.71 | 0.69 | 0.60 |
| Quick Ratio | 0.66 | 0.65 | 0.65 | 0.62 | 0.60 |
| D/E | 0.36 | 0.27 | 0.71 | 0.61 | 0.76 |
| Debt-to-Assets | 19.92% | 15.85% | 31.45% | 28.82% | 33.05% |
| Interest Coverage | 539.32 | 187.03 | 30.61 | 23.75 | 25.42 |
| Asset Turnover | 1.20 | 1.27 | 1.18 | 1.20 | 1.20 |
| Fixed Asset Turnover | 6.41 | 6.65 | 6.83 | 6.28 | 6.83 |
| Dividend Yield | 1.24% | 1.18% | 1.24% | 1.33% | 1.13% |
Evolution of Financial Ratios
Return on Equity (ROE) increased from 29.1% in 2022 to 38.3% in 2025, showing solid profitability improvement. The Current Ratio declined steadily from about 0.72 to 0.6, indicating weakening liquidity. Debt-to-Equity rose moderately from 0.27 to 0.76, suggesting a cautious increase in leverage. Profit margins remained relatively stable, with net margin around 14%.
Are the Financial Ratios Fovorable?
Profitability ratios like ROE (38.3%) and Return on Invested Capital (20.9%) are favorable, well above the 7.2% WACC. Asset turnover ratios are strong, reflecting efficient asset use. Liquidity ratios are unfavorable, with a Current Ratio below 1, signaling potential short-term risk. Leverage ratios are neutral, showing moderate debt levels. Valuation metrics such as P/E (55.2) and P/B (21.1) appear stretched. Overall, the financial ratios are slightly favorable.
Shareholder Return Policy
Rollins, Inc. maintains a dividend payout ratio near 60%, with a steady dividend per share growth reaching $0.68 in 2025 and a modest yield around 1.13%. The company supports distributions with strong free cash flow coverage and engages in share buybacks, balancing returns with capital discipline.
This policy aligns with sustainable long-term value creation, as dividends remain covered by cash flow and repurchases avoid excess leverage. The disciplined payout ratio and prudent buybacks suggest a commitment to shareholder returns without compromising financial stability.
Score analysis
The following radar chart presents the company’s key financial scores across valuation and profitability metrics:
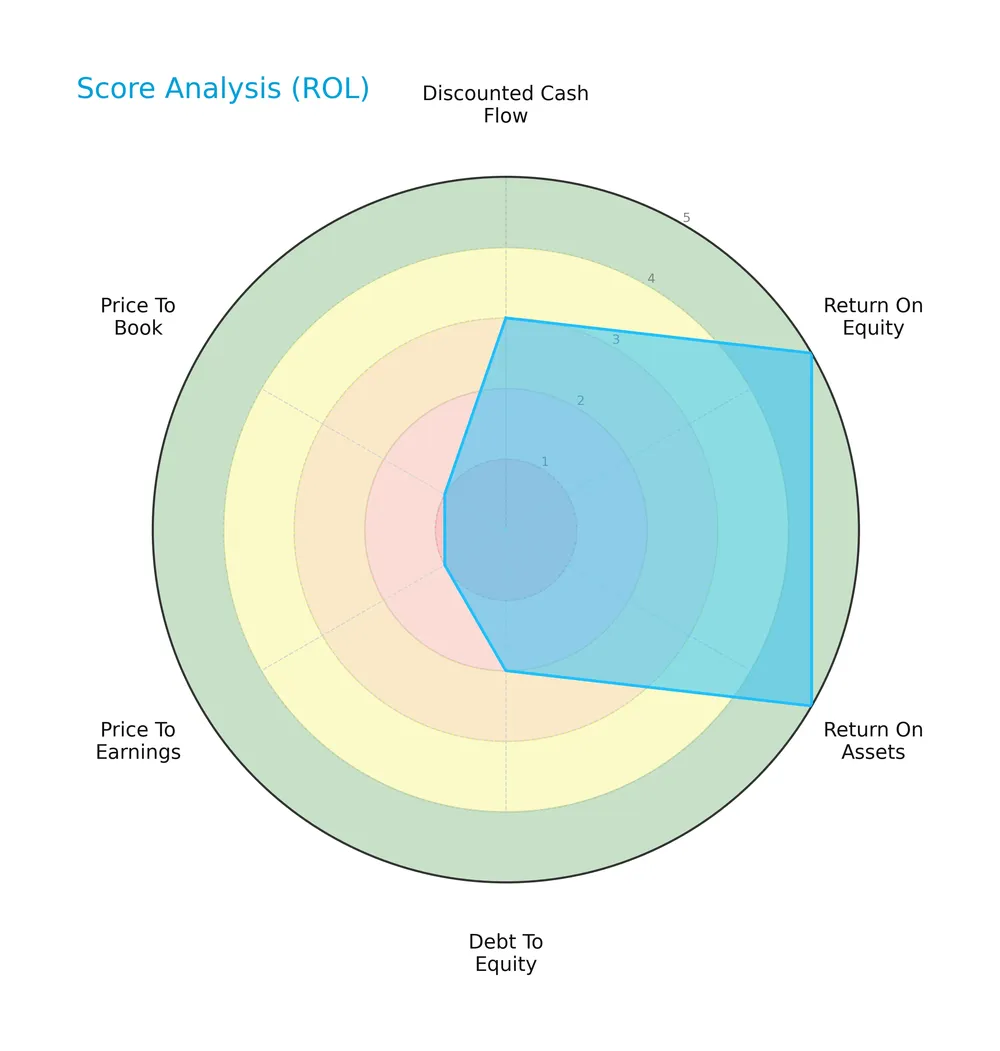
Rollins, Inc. shows strong returns on equity and assets, each rated very favorable at 5. However, its debt-to-equity and valuation scores are weak, with price-to-earnings and price-to-book scores at the lowest level. Overall, the score profile is moderate.
Analysis of the company’s bankruptcy risk
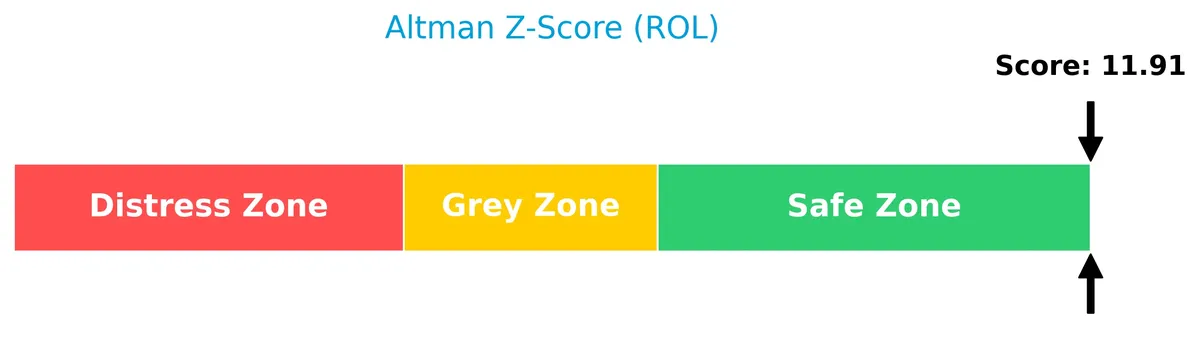
The Altman Z-Score places the company firmly in the safe zone, indicating a low risk of bankruptcy and solid financial stability:
Is the company in good financial health?
This Piotroski diagram illustrates the company’s financial strength using nine fundamental criteria:

Rollins holds an average Piotroski Score of 5, reflecting moderate financial health. The score suggests the company maintains reasonable fundamentals but lacks the robustness of stronger peers.
Competitive Landscape & Sector Positioning
This sector analysis covers Rollins, Inc.’s strategic positioning, revenue segments, key products, and main competitors. I will assess whether Rollins holds a competitive advantage over its industry peers.
Strategic Positioning
Rollins, Inc. concentrates primarily on pest control services in the U.S., generating over 3.14B in 2024 revenues domestically versus 245M internationally. Its portfolio spans residential, commercial, termite, and franchise operations, reflecting moderate product diversification within a focused geographic footprint.
Revenue by Segment
The pie chart illustrates Rollins, Inc.’s revenue distribution by segment for the fiscal year 2024, highlighting the company’s core income sources and segment contributions.
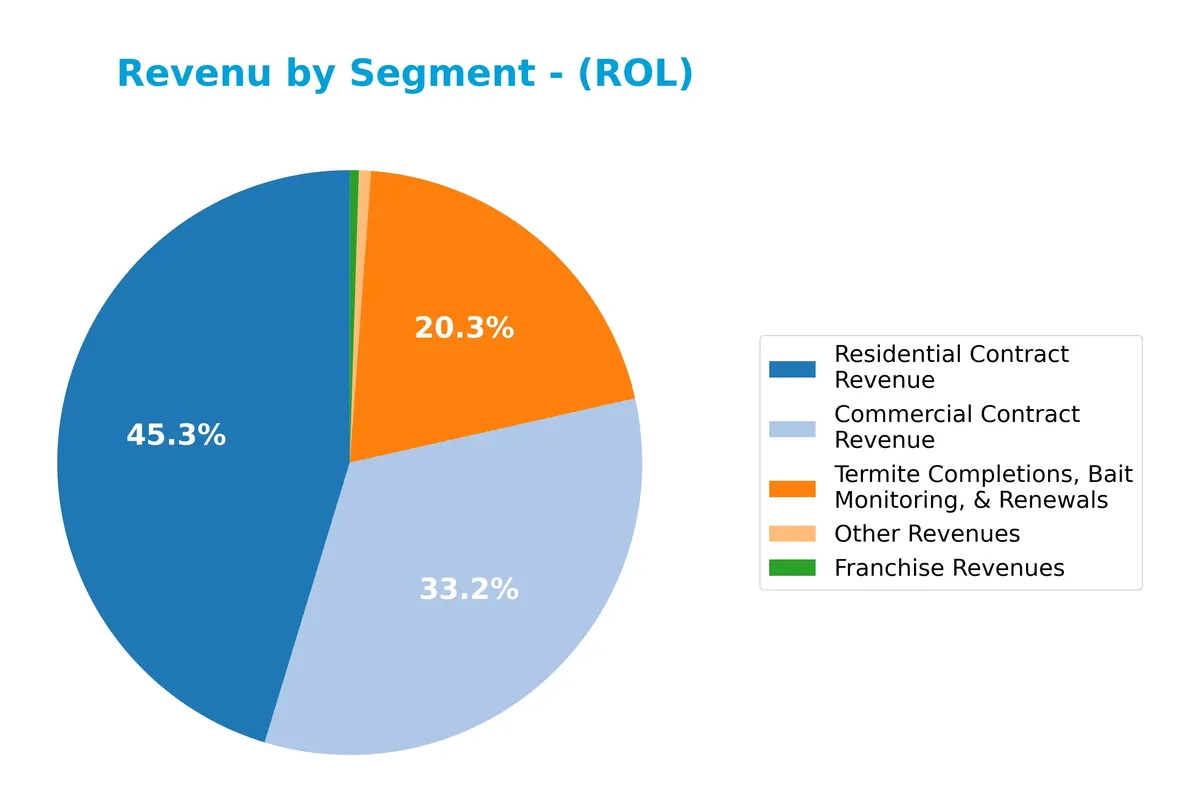
Residential Contract Revenue leads at 1.54B in 2024, followed by Commercial Contract Revenue at 1.13B. Termite Completions, Bait Monitoring, & Renewals contribute 688M, showing steady growth. Franchise and Other Revenues remain modest. The 2024 data shows acceleration in core contract revenues, emphasizing Rollins’s reliance on residential and commercial pest control services, with diversification risks mitigated by repeat termite service demand.
Key Products & Brands
Rollins, Inc. generates revenue through key pest control services and franchise operations as outlined below:
| Product | Description |
|---|---|
| Residential Contract Revenue | Pest control services protecting residential properties from rodents, insects, and wildlife. |
| Commercial Contract Revenue | Pest control solutions for workplaces in healthcare, foodservice, logistics, and other markets. |
| Termite Completions, Bait Monitoring, & Renewals | Traditional and baiting termite protection including monitoring and service renewals. |
| Franchise Revenues | Income from franchisee operations offering pest control services under Rollins’ brand. |
| Other Revenues | Ancillary services related to pest and wildlife control beyond core contract offerings. |
Rollins’ product mix balances residential and commercial pest control with specialized termite services. Franchise operations add a smaller but consistent revenue stream. This diversified portfolio supports steady cash flow in a defensive industry.
Main Competitors
The Consumer Cyclical sector includes 56 competitors, with the table below showing the top 10 leaders by market capitalization:
| Competitor | Market Cap. |
|---|---|
| Amazon.com, Inc. | 2.42T |
| Tesla, Inc. | 1.41T |
| The Home Depot, Inc. | 344B |
| Alibaba Group Holding Limited | 340B |
| McDonald’s Corporation | 217B |
| The TJX Companies, Inc. | 172B |
| Booking Holdings Inc. | 172B |
| PDD Holdings Inc. | 159B |
| Lowe’s Companies, Inc. | 138B |
| MercadoLibre, Inc. | 102B |
Rollins, Inc. ranks 31st among 56 competitors in the Consumer Cyclical sector. Its market cap stands at just 1.17% of Amazon’s, the sector leader. Rollins is positioned below both the average market cap of the top 10 ($547B) and the sector median ($38B). It trails its closest rival above by a 16.4% market cap gap, highlighting a significant scale difference.
Comparisons with competitors
Check out how we compare the company to its competitors:
Aucun article trouvé pour ces critères.
Does Rollins, Inc. have a competitive advantage?
Rollins, Inc. demonstrates a sustainable competitive advantage, supported by a very favorable moat. Its ROIC exceeds WACC by 13.6%, with a growing ROIC trend, indicating efficient capital use and value creation.
The company’s strong position in the US pest control market complements international growth. Continued innovation in pest control services and expanding franchise operations offer promising opportunities for future revenue expansion.
SWOT Analysis
This SWOT analysis highlights key internal and external factors shaping Rollins, Inc.’s strategic outlook.
Strengths
- strong ROIC well above WACC
- consistent revenue and net income growth
- diversified residential and commercial customer base
Weaknesses
- high valuation multiples (PE 55, PB 21)
- low liquidity ratios (current ratio 0.6)
- moderate debt levels with average debt-to-equity
Opportunities
- expanding international markets
- growing demand for pest control in healthcare and foodservice
- potential for service innovation and franchise growth
Threats
- competitive pressure in pest control sector
- sensitivity to economic cycles impacting discretionary spending
- regulatory risks in environmental and chemical usage
Rollins exhibits a durable competitive advantage with robust profitability. However, elevated valuation and liquidity concerns warrant caution. The company should leverage growth opportunities abroad while managing rising competition and regulatory challenges.
Stock Price Action Analysis
The weekly stock chart for Rollins, Inc. (ROL) illustrates price movements and key levels over the past 12 months:
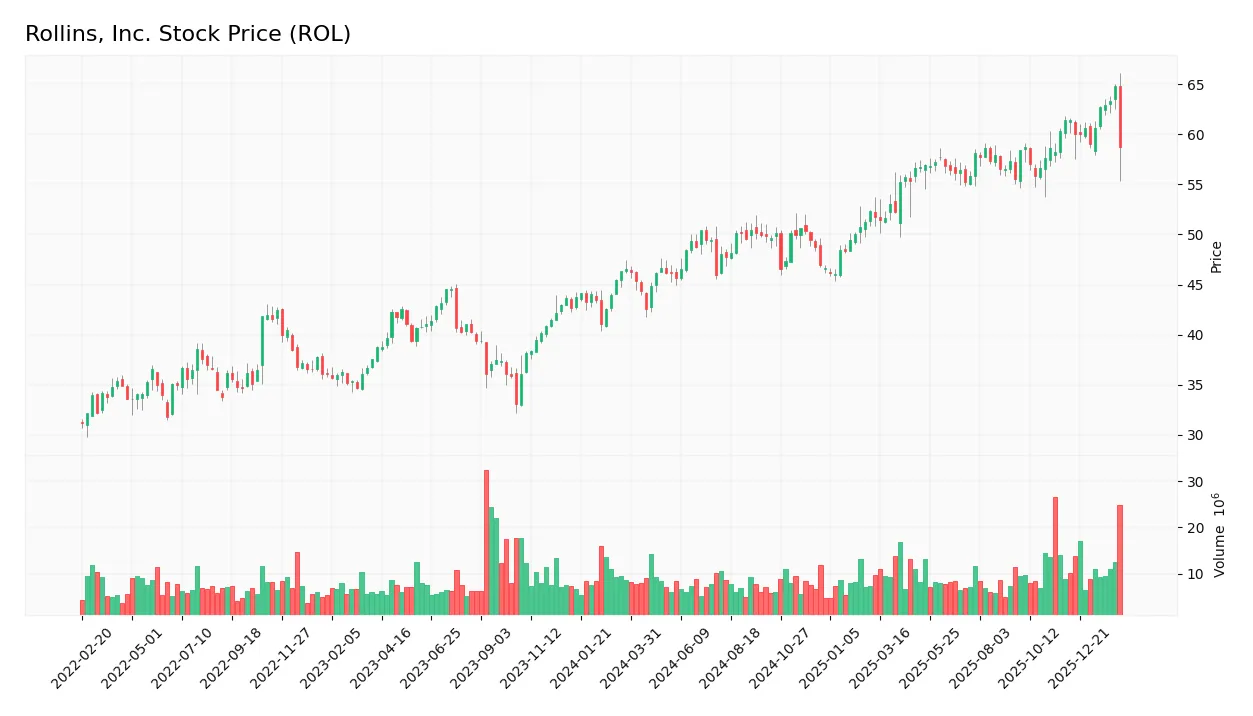
Trend Analysis
Over the past 12 months, ROL’s stock price increased by 26.11%, indicating a bullish trend. The highest price reached 64.84, the lowest 42.51. Despite the positive trend, price acceleration has decelerated. The price volatility is moderate with a standard deviation of 5.29%.
Volume Analysis
Trading volume has been increasing, with a total of 1.09B shares traded overall. Buyer volume represents 57.3% of total activity, indicating buyer-driven momentum. In the recent 2.5-month period, buyer dominance slightly strengthened to 59.78%, suggesting growing investor interest.
Target Prices
Analysts set a clear target consensus for Rollins, Inc., reflecting moderate upside potential.
| Target Low | Target High | Consensus |
|---|---|---|
| 55 | 72 | 64.63 |
The target range spans from $55 to $72, with a consensus near $65, indicating steady confidence in Rollins’ growth prospects.

Don’t Let Luck Decide Your Entry Point
Optimize your entry points with our advanced ProRealTime indicators. You’ll get efficient buy signals with precise price targets for maximum performance. Start outperforming now!
Analyst & Consumer Opinions
This section examines analyst ratings and consumer feedback to offer a comprehensive view of Rollins, Inc.’s market perception.
Stock Grades
Here is a snapshot of recent analyst grades for Rollins, Inc. from recognized financial institutions:
| Grading Company | Action | New Grade | Date |
|---|---|---|---|
| Wells Fargo | Downgrade | Equal Weight | 2026-02-12 |
| RBC Capital | Maintain | Outperform | 2026-02-12 |
| UBS | Maintain | Neutral | 2026-01-21 |
| Wells Fargo | Maintain | Overweight | 2026-01-14 |
| Morgan Stanley | Upgrade | Overweight | 2025-12-17 |
| Barclays | Upgrade | Overweight | 2025-12-05 |
| Canaccord Genuity | Maintain | Hold | 2025-10-31 |
| Wells Fargo | Maintain | Overweight | 2025-10-28 |
| UBS | Maintain | Neutral | 2025-07-25 |
| Barclays | Maintain | Equal Weight | 2025-07-25 |
The grades reveal a mixed but generally cautious stance on Rollins, with multiple upgrades noted in late 2025, followed by some recent downgrades and stable hold ratings. The consensus remains a Hold, reflecting balanced investor sentiment.
Consumer Opinions
Consumer sentiment around Rollins, Inc. reflects a mix of satisfaction with service quality and concerns over pricing.
| Positive Reviews | Negative Reviews |
|---|---|
| “Reliable pest control with quick response times.” | “Pricing feels higher compared to competitors.” |
| “Technicians are professional and knowledgeable.” | “Scheduling can be difficult during peak seasons.” |
| “Effective treatments that last longer than expected.” | “Customer service sometimes lacks follow-through.” |
Overall, customers praise Rollins for dependable, effective services and skilled technicians. However, recurring complaints about cost and scheduling challenges suggest areas for operational improvement.
Risk Analysis
The table below summarizes the key risks facing Rollins, Inc., categorized by likelihood and potential impact on investment performance:
| Category | Description | Probability | Impact |
|---|---|---|---|
| Valuation Risk | Elevated P/E (55.17) and P/B (21.14) ratios suggest overvaluation. | High | High |
| Liquidity Risk | Current and quick ratios at 0.6 highlight weak short-term liquidity. | Medium | Medium |
| Debt Risk | Moderate debt-to-assets ratio (33%) with neutral debt/equity (0.76). | Medium | Medium |
| Market Volatility | Beta of 0.79 indicates less sensitivity to market swings but still exposed. | Low | Medium |
| Operational Risk | Dependence on franchisee operations could affect service consistency. | Medium | Medium |
Rollins shows strong profitability and capital efficiency but carries valuation and liquidity risks that warrant caution. The inflated multiples reflect high investor expectations, while a current ratio below 1 signals potential short-term pressure. Its Altman Z-score of 11.9 confirms financial safety, mitigating bankruptcy concerns.
Should You Buy Rollins, Inc.?
Rollins, Inc. appears to be a profitable company with robust value creation and a durable competitive moat, as indicated by its growing ROIC well above WACC. Despite a manageable leverage profile, some valuation metrics suggest caution. Overall, it carries a moderate B rating.
Strength & Efficiency Pillars
Rollins, Inc. demonstrates strong operational efficiency with a net margin of 14.0% and a return on equity (ROE) of 38.32%. Its return on invested capital (ROIC) stands at 20.86%, comfortably above the weighted average cost of capital (WACC) of 7.22%, confirming the company as a clear value creator. The firm’s interest coverage ratio of 25.54 signals robust capacity to service debt. Consistent revenue growth of 55.14% over the period underscores solid top-line momentum.
Weaknesses and Drawbacks
Despite operational strengths, Rollins faces valuation headwinds. Its price-to-earnings (P/E) ratio of 55.17 and price-to-book (P/B) ratio of 21.14 signal a richly priced stock, raising concerns about downside risk if growth slows. The current ratio of 0.6 indicates tight liquidity, which could pressure short-term financial flexibility. Moderate debt levels (debt-to-equity of 0.76) warrant monitoring, but valuation metrics are the primary caution for investors.
Our Final Verdict about Rollins, Inc.
The company’s strong profitability and value creation profile may appear attractive for long-term exposure. However, elevated valuation multiples and liquidity constraints suggest that investors might prefer a cautious entry. The bullish overall trend with slightly buyer-dominant recent activity supports a positive outlook, but a measured approach for a better entry point could mitigate near-term risk.
Disclaimer: This content is for informational purposes only and does not constitute financial, investment, or other professional advice. Investing in financial markets involves a significant risk of loss, and past performance is not indicative of future results.
Additional Resources
- Bugs, Business, and Big Returns: A Deep Dive into Rollins, Inc. (ROL) – FinancialContent (Feb 12, 2026)
- ROLLINS INC SEC 10-K Report – TradingView (Feb 12, 2026)
- Rollins Stock Declines as Q4 Earnings and Revenues Miss Estimates – The Globe and Mail (Feb 12, 2026)
- Rollins, Inc.’s (NYSE:ROL) Stock’s On An Uptrend: Are Strong Financials Guiding The Market? – Yahoo Finance (Feb 08, 2026)
- ROLLINS, INC. REPORTS FOURTH QUARTER AND FULL YEAR 2025 FINANCIAL RESULTS – PR Newswire (Feb 11, 2026)
For more information about Rollins, Inc., please visit the official website: rollins.com