Home > Analyses > Industrials > Rockwell Automation, Inc.
Rockwell Automation, Inc. revolutionizes the industrial landscape by powering the automation and digital transformation that drive modern manufacturing and infrastructure. As a leader in industrial machinery, Rockwell’s cutting-edge hardware, software, and lifecycle services set the standard for innovation and reliability across diverse sectors—from automotive to renewable energy. With a robust market presence and a reputation for quality, the key question remains: does Rockwell’s current valuation reflect its growth potential in an evolving industrial era?

Table of contents
Business Model & Company Overview
Rockwell Automation, Inc., founded in 1903 and headquartered in Milwaukee, Wisconsin, stands as a dominant player in industrial automation and digital transformation. Its core mission integrates hardware, software, and services into a seamless ecosystem, addressing diverse markets from automotive to renewable energy. With 27K employees and a market cap near 47B USD, it leads innovation in machinery and control solutions worldwide.
The company’s revenue engine balances intelligent devices, control software, and lifecycle services, creating a resilient mix of product sales and recurring revenues. Operating through distributors and direct sales across the Americas, Europe, and Asia, Rockwell Automation leverages its broad footprint and deep expertise. Its competitive advantage lies in a robust portfolio that shapes the future of industrial efficiency and automation globally.
Financial Performance & Fundamental Metrics
In this section, I analyze Rockwell Automation, Inc.’s income statement, key financial ratios, and dividend payout policy to assess its financial health and stability.
Income Statement
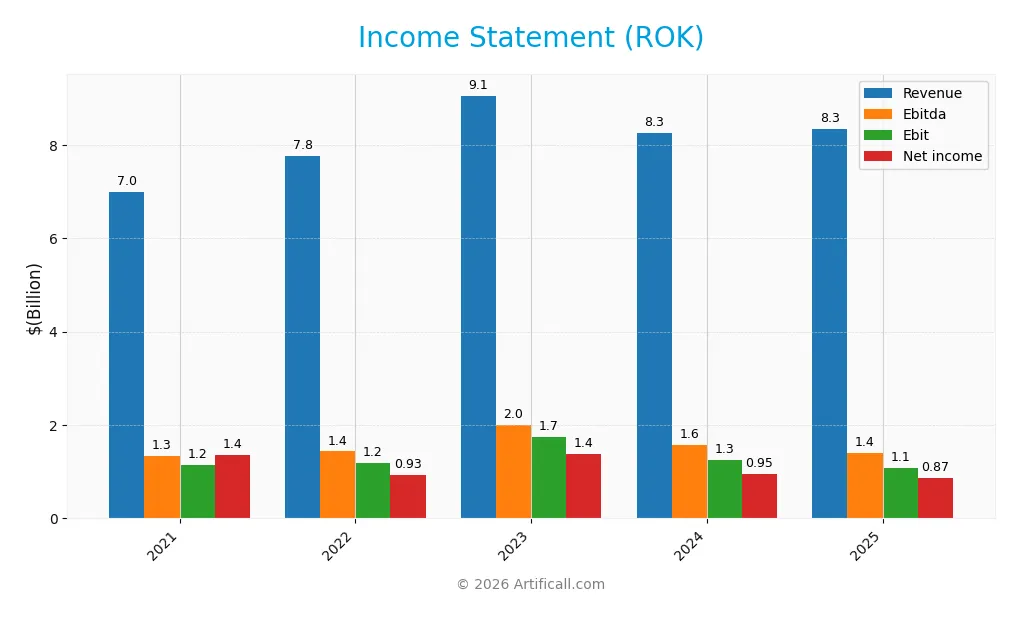
The following table presents Rockwell Automation, Inc.’s key income statement figures for fiscal years 2021 through 2025, reported in USD.
| 2021 | 2022 | 2023 | 2024 | 2025 | |
|---|---|---|---|---|---|
| Revenue | 7.0B | 7.8B | 9.1B | 8.3B | 8.3B |
| Cost of Revenue | 4.1B | 4.7B | 5.3B | 4.6B | 4.3B |
| Operating Expenses | 2.2B | 1.8B | 2.0B | 2.4B | 2.6B |
| Gross Profit | 2.9B | 3.1B | 3.7B | 3.7B | 4.0B |
| EBITDA | 1.3B | 1.4B | 2.0B | 1.6B | 1.4B |
| EBIT | 1.2B | 1.2B | 1.7B | 1.3B | 1.1B |
| Interest Expense | 92M | 120M | 132M | 151M | 156M |
| Net Income | 1.4B | 932M | 1.4B | 952M | 869M |
| EPS | 11.69 | 8.02 | 12.03 | 8.32 | 7.69 |
| Filing Date | 2021-11-09 | 2022-11-08 | 2023-11-08 | 2024-11-12 | 2025-11-12 |
Income Statement Evolution
From 2021 to 2025, Rockwell Automation, Inc. experienced a 19.22% increase in revenue, indicating overall sales growth. However, net income declined by 36.01% over the same period, signaling pressure on profitability. Gross margin improved favorably to 48.14%, while EBIT margin remained steady at 12.86%, reflecting some margin stability despite net income challenges.
Is the Income Statement Favorable?
In 2025, Rockwell Automation posted $8.34B revenue with a 10.42% net margin, both considered favorable metrics. Yet, the company showed a 0.97% revenue growth slowdown and a 14.17% decline in EBIT, indicating operational headwinds. The net margin and EPS also contracted year-over-year. Overall, the fundamental indicators suggest an unfavorable income statement performance for the most recent fiscal year.
Financial Ratios
The table below summarizes key financial ratios for Rockwell Automation, Inc. over the past five fiscal years, providing insights into profitability, valuation, liquidity, leverage, and efficiency:
| Ratios | 2021 | 2022 | 2023 | 2024 | 2025 |
|---|---|---|---|---|---|
| Net Margin | 19% | 12% | 15% | 12% | 10% |
| ROE | 57% | 34% | 39% | 27% | 24% |
| ROIC | 8% | 14% | 17% | 12% | 14% |
| P/E | 25.1 | 26.7 | 23.7 | 32.1 | 45.3 |
| P/B | 14.3 | 9.1 | 9.2 | 8.7 | 10.8 |
| Current Ratio | 1.02 | 1.01 | 1.46 | 1.08 | 1.14 |
| Quick Ratio | 0.76 | 0.72 | 1.04 | 0.72 | 0.77 |
| D/E | 1.83 | 1.53 | 0.94 | 1.17 | 1.00 |
| Debt-to-Assets | 41% | 39% | 30% | 36% | 33% |
| Interest Coverage | 7.9 | 11.2 | 12.8 | 8.4 | 9.1 |
| Asset Turnover | 0.65 | 0.72 | 0.80 | 0.74 | 0.74 |
| Fixed Asset Turnover | 7.3 | 8.6 | 8.8 | 6.9 | 7.0 |
| Dividend Yield | 1.46% | 2.08% | 1.65% | 1.87% | 1.50% |
Evolution of Financial Ratios
From 2021 to 2025, Rockwell Automation, Inc. showed a fluctuating but generally declining trend in profitability ratios such as net profit margin and ROE. The current ratio improved slightly from about 1.02 to 1.14, indicating more stable short-term liquidity. The debt-to-equity ratio decreased from roughly 1.83 in 2021 to around 1.00 in 2025, suggesting a moderate reduction in leverage and improved capital structure stability.
Are the Financial Ratios Favorable?
In 2025, profitability metrics like ROE (23.78%) and net margin (10.42%) are marked favorable, while the weighted average cost of capital (WACC) and valuation multiples such as P/E (45.33) and P/B (10.78) are unfavorable, indicating potential overvaluation. Liquidity ratios are mixed: the current ratio is neutral at 1.14, but the quick ratio is unfavorable at 0.77. Leverage ratios, including debt-to-equity at 1.0 and debt-to-assets at 32.51%, are neutral. Efficiency metrics present a favorable fixed asset turnover of 6.95 but a neutral asset turnover of 0.74. Overall, the global opinion on ratios is slightly favorable.
Shareholder Return Policy
Rockwell Automation, Inc. maintains a dividend payout ratio around 55-68% over recent years, with a dividend yield near 1.5-2.1%. Dividend per share has steadily increased from $4.29 in 2021 to $5.24 in 2025, supported by free cash flow coverage and moderate share repurchases.
This distribution approach balances returning capital to shareholders while preserving financial flexibility. The payout and buyback strategy appear aligned with sustainable long-term value creation, assuming continued cash flow generation and prudent capital management.
Score analysis
Here is a radar chart summarizing key financial scores for Rockwell Automation, Inc., providing a snapshot of its valuation and profitability metrics:
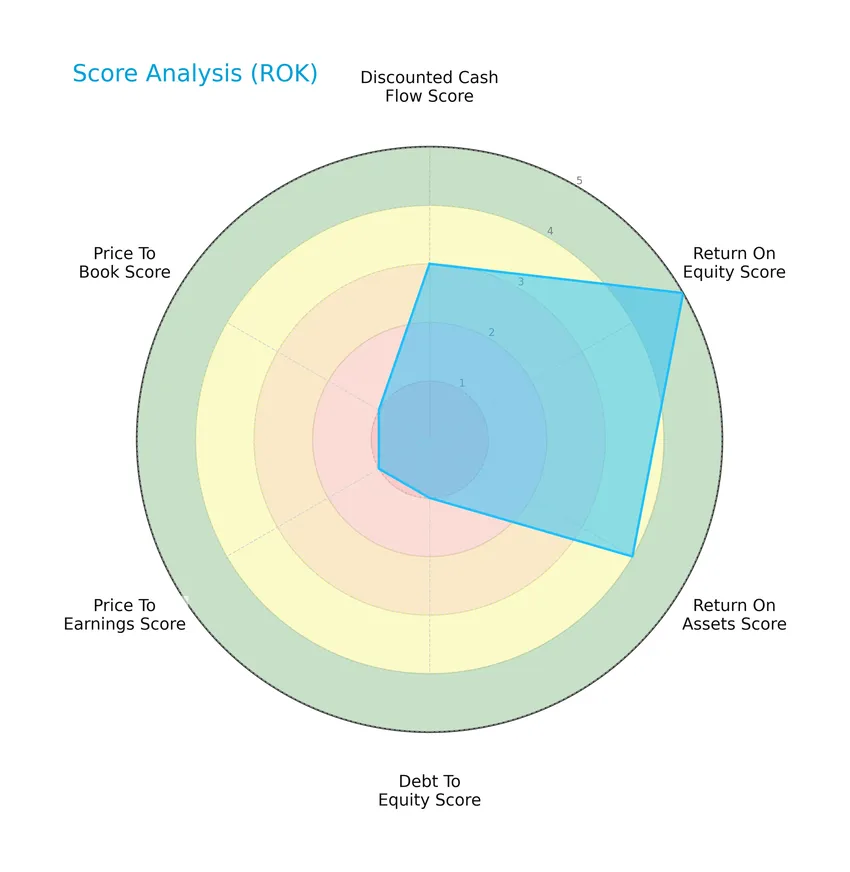
The company shows a very favorable return on equity score of 5 and a favorable return on assets score of 4, contrasted by very unfavorable valuations with low scores in debt to equity, price to earnings, and price to book at 1 each. The discounted cash flow score stands at a moderate 3.
Analysis of the company’s bankruptcy risk
The Altman Z-Score indicates that Rockwell Automation, Inc. is in the safe zone, suggesting a low risk of bankruptcy based on its financial ratios:

Is the company in good financial health?
The following Piotroski diagram illustrates the company’s strong financial health based on multiple accounting criteria:

With a Piotroski score of 8, Rockwell Automation, Inc. demonstrates very strong financial strength, signaling robust profitability, liquidity, and operational efficiency.
Competitive Landscape & Sector Positioning
This sector analysis will explore Rockwell Automation, Inc.’s strategic positioning, revenue by segment, key products, main competitors, and competitive advantages. I will also present a SWOT analysis to provide a comprehensive view. The goal is to determine whether Rockwell Automation holds a competitive advantage over its industry peers.
Strategic Positioning
Rockwell Automation, Inc. maintains a diversified product portfolio across three segments—Intelligent Devices, Software & Control, and Lifecycle Services—generating $3.8B, $2.4B, and $2.2B in revenue respectively for FY 2025. Geographically, it is heavily concentrated in North America with $5.3B revenue, while also serving EMEA, Asia Pacific, and Latin America markets.
Revenue by Segment
The pie chart illustrates Rockwell Automation, Inc.’s revenue distribution across its main product segments for the fiscal year 2025. It highlights the relative contribution of each segment to the company’s total sales.
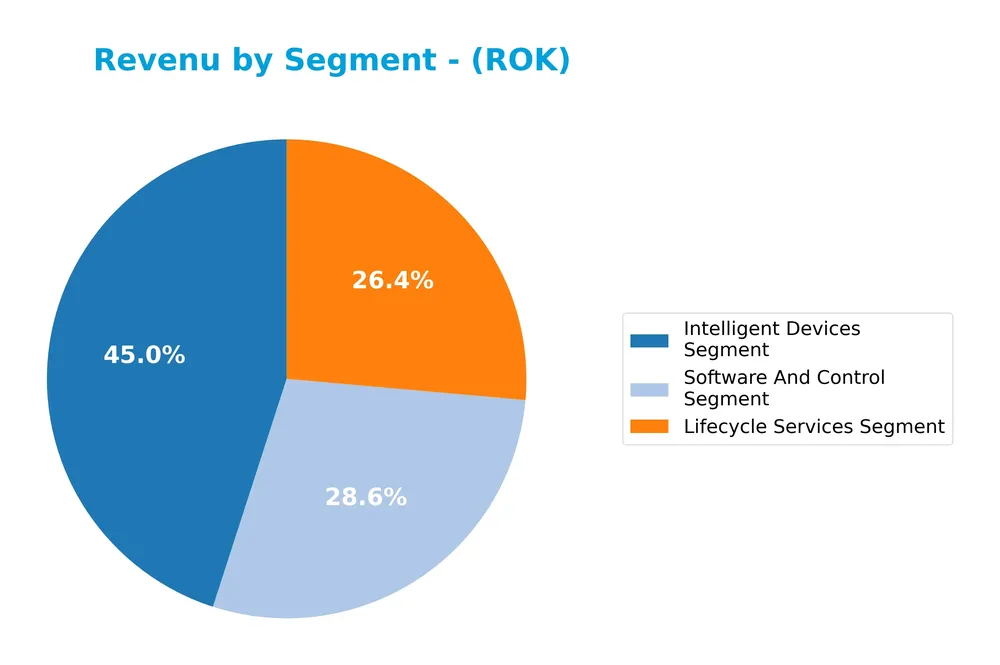
In 2025, the Intelligent Devices Segment led with $3.76B in revenue, followed by the Software and Control Segment at $2.38B and Lifecycle Services at $2.20B. Over recent years, Intelligent Devices consistently drive the business, though their revenue slightly declined from $4.10B in 2023. Software and Control showed steady growth, indicating increasing importance. Lifecycle Services also rose moderately, suggesting a balanced revenue mix without excessive concentration risk.
Key Products & Brands
The following table outlines Rockwell Automation’s main products and brand segments with their descriptions:
| Product | Description |
|---|---|
| Intelligent Devices Segment | Offers drives, motion, safety, sensing, industrial components, and configured-to-order products. |
| Software & Control Segment | Provides control and visualization software and hardware, information software, digital twin and simulation software, and network and security infrastructure solutions. |
| Lifecycle Services Segment | Delivers consulting, professional services and solutions, connected and maintenance services. |
Rockwell Automation’s portfolio spans hardware, software, and services that support industrial automation and digital transformation, serving diverse end markets globally.
Main Competitors
In the Industrials sector, 24 competitors are identified, with the table below listing the top 10 leaders by market capitalization:
| Competitor | Market Cap. |
|---|---|
| Eaton Corporation plc | 127.1B |
| Parker-Hannifin Corporation | 114.2B |
| Howmet Aerospace Inc. | 85.2B |
| Emerson Electric Co. | 76.3B |
| Illinois Tool Works Inc. | 73.0B |
| Cummins Inc. | 71.9B |
| AMETEK, Inc. | 48.3B |
| Roper Technologies, Inc. | 46.8B |
| Rockwell Automation, Inc. | 44.8B |
| Symbotic Inc. | 35.9B |
Rockwell Automation, Inc. ranks 9th among its peers with a market cap approximately 37% of the leader, Eaton Corporation plc. It sits below the average market cap of the top 10 competitors but remains above the sector median. The company is closely positioned to Roper Technologies, with a minimal market cap gap of about 0.44%.
Comparisons with competitors
Check out how we compare the company to its competitors:
Does ROK have a competitive advantage?
Rockwell Automation, Inc. demonstrates a durable competitive advantage, as indicated by a ROIC exceeding WACC by 3.23% and a 77% growth in ROIC over 2021-2025, signaling efficient capital use and value creation. Despite some unfavorable recent income trends, the company’s overall moat status is very favorable, reflecting increasing profitability and strong market positioning.
Looking ahead, Rockwell Automation’s focus on industrial automation and digital transformation across diverse global markets, including automotive, semiconductor, and renewable energy sectors, positions it well for growth. Its segmented offerings in intelligent devices, software & control, and lifecycle services highlight opportunities for innovation and expansion in emerging technologies and international markets.
SWOT Analysis
This SWOT analysis highlights Rockwell Automation, Inc.’s key internal strengths and weaknesses along with external opportunities and threats to guide investment decisions.
Strengths
- strong market position in industrial automation
- durable competitive advantage with growing ROIC
- favorable profitability metrics (net margin 10.42%, ROE 23.78%)
Weaknesses
- declining net income and EPS over 5 years
- high valuation multiples (PE 45.33, PB 10.78)
- moderate liquidity ratios (quick ratio 0.77)
Opportunities
- expanding digital transformation demand
- growth potential in emerging markets (Asia Pacific, Latin America)
- increasing adoption of Industry 4.0 technologies
Threats
- global supply chain disruptions
- intense competition in automation software and hardware
- macroeconomic uncertainty impacting industrial capital spending
Rockwell Automation demonstrates solid profitability and a durable competitive moat, but investors should be cautious about its high valuation and recent earnings decline. The company’s strategy should focus on leveraging digital transformation trends and geographic diversification while managing risks from competition and economic cycles.
Stock Price Action Analysis
The following weekly stock chart illustrates Rockwell Automation, Inc.’s price movements over the past 100 weeks, highlighting key volatility and trend changes:
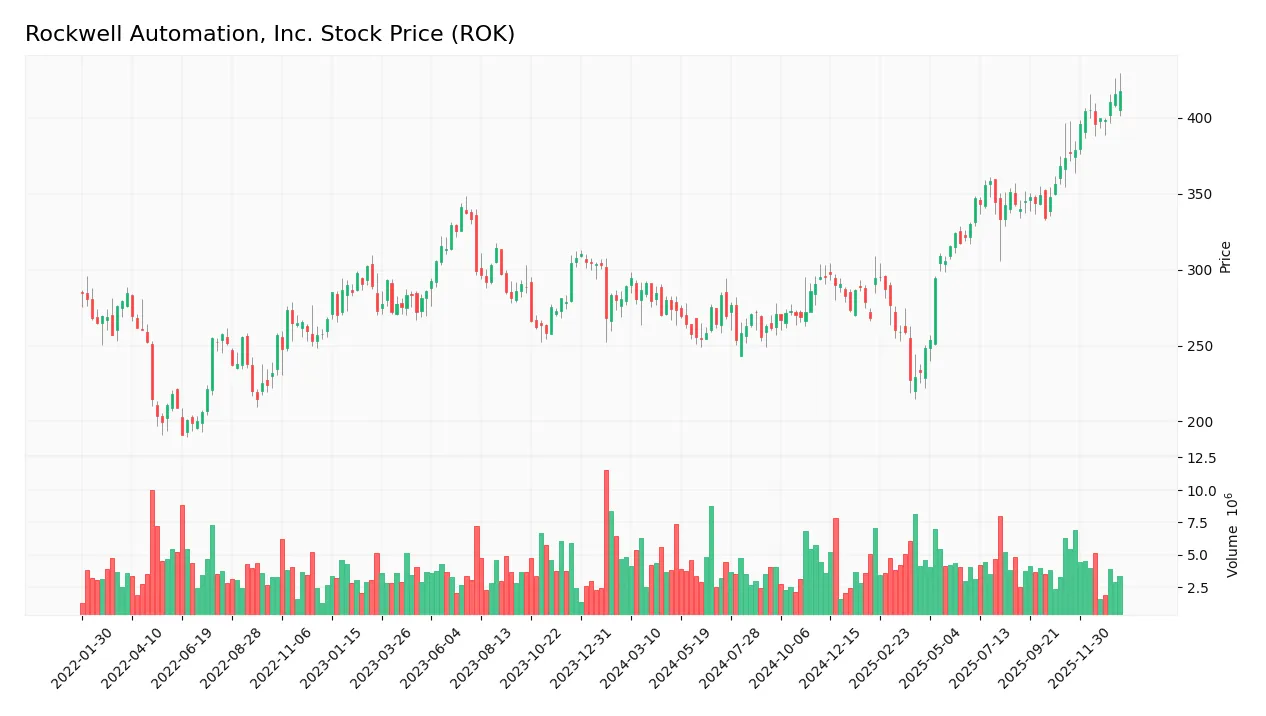
Trend Analysis
Over the past 100 weeks, Rockwell Automation’s stock price increased by 44.56%, indicating a bullish trend with acceleration. The price ranged from a low of 227.11 to a high of 417.84, accompanied by a high standard deviation of 47.29, reflecting notable volatility throughout the period.
Volume Analysis
Trading volume totaled approximately 515M shares, with buyers accounting for 57.56% but volume is decreasing overall. In the recent period from November 2025 to January 2026, buyer dominance strengthened to 85.95%, suggesting strong buying interest despite lower market participation levels.
Target Prices
The consensus target prices for Rockwell Automation, Inc. indicate a positive outlook from analysts.
| Target High | Target Low | Consensus |
|---|---|---|
| 470 | 380 | 421.57 |
Analysts expect Rockwell Automation’s stock to trade between 380 and 470, with a consensus target around 422, reflecting moderate upside potential.

Don’t Let Luck Decide Your Entry Point
Optimize your entry points with our advanced ProRealTime indicators. You’ll get efficient buy signals with precise price targets for maximum performance. Start outperforming now!
Analyst & Consumer Opinions
This section examines the latest analyst ratings and consumer feedback regarding Rockwell Automation, Inc. (ROK).
Stock Grades
Here is the latest overview of stock grades from recognized financial institutions for Rockwell Automation, Inc.:
| Grading Company | Action | New Grade | Date |
|---|---|---|---|
| Oppenheimer | Downgrade | Perform | 2026-01-20 |
| JP Morgan | Maintain | Neutral | 2026-01-16 |
| Morgan Stanley | Maintain | Overweight | 2026-01-13 |
| Barclays | Maintain | Overweight | 2026-01-07 |
| Wells Fargo | Maintain | Equal Weight | 2026-01-07 |
| Goldman Sachs | Upgrade | Neutral | 2025-12-16 |
| Jefferies | Maintain | Buy | 2025-12-10 |
| Citigroup | Maintain | Buy | 2025-12-08 |
| Barclays | Maintain | Overweight | 2025-12-04 |
| Baird | Maintain | Outperform | 2025-11-21 |
The grades generally reflect a cautious to neutral stance, with several firms maintaining overweight or buy ratings while Oppenheimer recently downgraded to perform. The consensus leans toward a hold position, indicating balanced investor sentiment.
Consumer Opinions
Consumers of Rockwell Automation, Inc. express a mix of satisfaction and constructive criticism, reflecting on the company’s product quality and customer service.
| Positive Reviews | Negative Reviews |
|---|---|
| “Rockwell’s automation solutions have significantly boosted our production efficiency.” | “The pricing is a bit high compared to competitors in the market.” |
| “Excellent technical support with quick response times.” | “Some software updates have caused compatibility issues.” |
| “Reliable and durable industrial equipment that lasts.” | “Installation process can be complex without expert help.” |
Overall, Rockwell Automation receives praise for its reliable products and responsive support, though customers occasionally note higher costs and technical challenges during upgrades or installations.
Risk Analysis
Below is a concise table summarizing the key risks associated with Rockwell Automation, Inc., highlighting their likelihood and potential impact on investment decisions:
| Category | Description | Probability | Impact |
|---|---|---|---|
| Market Valuation | High price-to-earnings (PE 45.33) and price-to-book (PB 10.78) ratios imply overvaluation risk | Medium | High |
| Financial Leverage | Debt-to-equity ratio of 1.0 indicates moderate leverage, but debt-related risks remain present | Medium | Medium |
| Liquidity | Quick ratio of 0.77 suggests potential short-term liquidity constraints | Medium | Medium |
| Market Volatility | Beta of 1.516 indicates higher sensitivity to market swings | High | Medium |
| Industry Cyclicality | Exposure to industrial machinery sector cyclicality and global economic conditions | Medium | Medium |
| Dividend Stability | Dividend yield at 1.5% is moderate but could be pressured by earnings volatility | Low | Low |
The most significant risks stem from Rockwell Automation’s elevated valuation metrics and its relatively high market volatility. Despite strong financial health indicated by a safe Altman Z-Score (5.6) and a very strong Piotroski Score (8), investors should remain cautious about the premium valuation and cyclical industry exposure.
Should You Buy Rockwell Automation, Inc.?
Rockwell Automation, Inc. appears to be delivering robust profitability supported by a durable competitive moat, as indicated by growing ROIC well above WACC. Despite a challenging leverage profile, the overall B- rating suggests a moderate investment appeal with strong operational efficiency.
Strength & Efficiency Pillars
Rockwell Automation, Inc. demonstrates robust profitability with a net margin of 10.42%, a return on equity (ROE) of 23.78%, and a return on invested capital (ROIC) of 13.71%. With a weighted average cost of capital (WACC) at 10.48%, the company clearly qualifies as a value creator, generating returns above its capital costs. Its Altman Z-score of 5.60 places it firmly in the safe zone, indicating strong financial health, while a Piotroski score of 8 signals very strong operational fundamentals. These metrics collectively underscore a durable competitive advantage and efficient capital deployment.
Weaknesses and Drawbacks
Despite these strengths, Rockwell Automation faces valuation concerns, with a steep price-to-earnings (P/E) ratio of 45.33 and a price-to-book (P/B) ratio of 10.78, reflecting a premium market valuation that could limit upside potential. The debt-to-equity ratio stands at 1.0, suggesting moderate leverage, and the quick ratio of 0.77 points to potential liquidity constraints. These factors, combined with a neutral current ratio of 1.14, imply moderate financial risk. The relatively high valuation multiples may expose the stock to volatility if earnings fail to meet elevated expectations.
Our Verdict about Rockwell Automation, Inc.
The company’s long-term fundamentals are favorable, supported by efficient profitability and financial strength. Coupled with a bullish overall stock trend and strong buyer dominance in the recent period (85.95%), the profile may appear attractive for long-term exposure. However, the premium valuation and moderate leverage could introduce short-term risks, suggesting that investors might consider a measured approach to entry timing.
Disclaimer: This content is for informational purposes only and does not constitute financial, investment, or other professional advice. Investing in financial markets involves a significant risk of loss, and past performance is not indicative of future results.
Additional Resources
- Looking Into Rockwell Automation Inc’s Recent Short Interest – Sahm (Jan 24, 2026)
- Rockwell Automation to Power Lucid’s EV Manufacturing Facility in Saudi Arabia with Advanced Software Solutions – PR Newswire (Jan 21, 2026)
- Rockwell Automation to Report First Quarter Fiscal 2026 Results – Business Wire (Jan 22, 2026)
- Rockwell Automation Recognized in Various 2025 Gartner Hype Cycle Reports | Corporate – EQS News (Jan 22, 2026)
- Rockwell Automation to Report First Quarter Fiscal 2026 Results – Chartmill (Jan 22, 2026)
For more information about Rockwell Automation, Inc., please visit the official website: rockwellautomation.com