Home > Analyses > Financial Services > Robinhood Markets, Inc.
Robinhood reshaped how millions access the financial markets, turning investing into a daily habit for retail traders. It dominates the fintech space with a user-friendly platform offering stocks, ETFs, options, crypto, and gold trading. Known for innovation and education tools, Robinhood blends simplicity with market influence. As competition intensifies, I ask: do its fundamentals still support its lofty valuation and growth prospects in 2026?

Table of contents
Business Model & Company Overview
Robinhood Markets, Inc. is a leading financial services platform headquartered in Menlo Park, California, founded in 2013. It dominates the U.S. capital markets by offering an integrated ecosystem that enables retail investors to access stocks, ETFs, options, gold, and cryptocurrencies. The platform also enriches user engagement through tailored educational content, real-time newsfeeds, and personalized trading alerts, creating a seamless investing experience.
The company’s revenue engine balances commission-free trading with premium subscription services and cash management solutions. It capitalizes on a broad user base across the Americas, with strategic footholds in global financial hubs. Robinhood’s ability to integrate diverse financial products and user education fortifies its competitive advantage, securing a durable economic moat as it shapes the future of retail investing.
Financial Performance & Fundamental Metrics
I will analyze Robinhood Markets, Inc.’s income statement, key financial ratios, and dividend payout policy to assess its overall financial health and investment appeal.
Income Statement
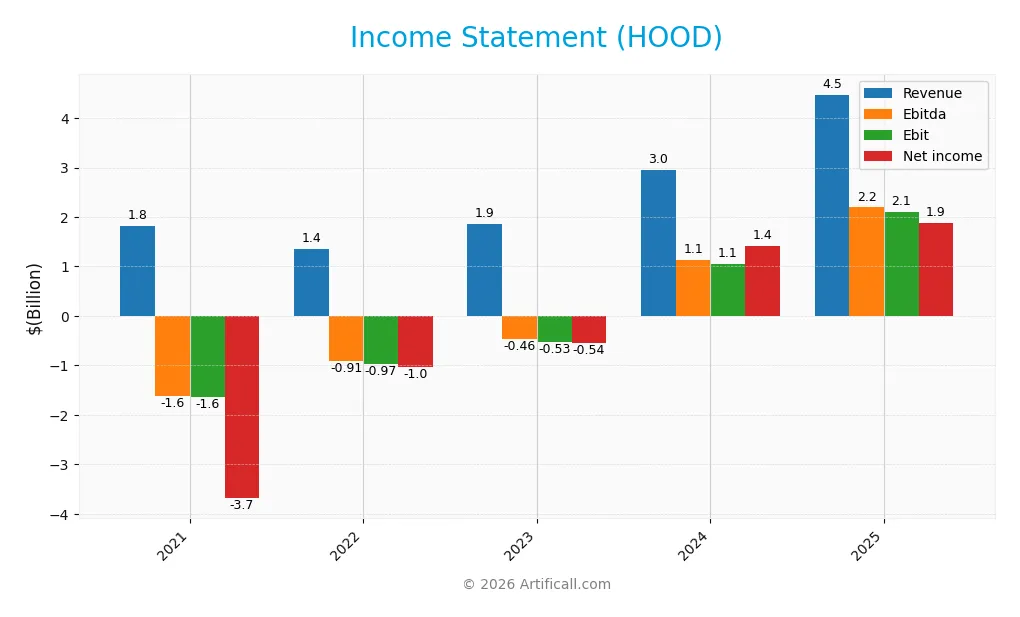
The following table summarizes Robinhood Markets, Inc.’s annual income statement figures from 2021 to 2025, reflecting its evolving profitability and cost structure.
| 2021 | 2022 | 2023 | 2024 | 2025 | |
|---|---|---|---|---|---|
| Revenue | 1.82B | 1.36B | 1.87B | 2.95B | 4.47B |
| Cost of Revenue | 509M | 588M | 459M | 504M | 1.19B |
| Operating Expenses | 2.95B | 1.74B | 1.94B | 1.39B | 1.19B |
| Gross Profit | 1.31B | 770M | 1.41B | 2.45B | 3.28B |
| EBITDA | -1.62B | -905M | -460M | 1.13B | 2.19B |
| EBIT | -1.64B | -966M | -531M | 1.06B | 2.11B |
| Interest Expense | 20M | 24M | 23M | 24M | 0 |
| Net Income | -3.69B | -1.03B | -541M | 1.41B | 1.88B |
| EPS | -4.27 | -1.17 | -0.61 | 1.60 | 2.12 |
| Filing Date | 2022-02-24 | 2023-02-27 | 2024-02-27 | 2025-02-18 | 2026-02-18 |
Income Statement Evolution
Robinhood’s revenue surged 146% from 2021 to 2025, with a sharp 52% rise in 2025 alone. Net income mirrored this growth, climbing 151% over the period, despite a slight 12% net margin dip in 2025. Gross and EBIT margins improved consistently, reaching 73% and 47%, respectively, signaling enhanced profitability and operational efficiency.
Is the Income Statement Favorable?
The 2025 income statement shows robust fundamentals. Revenue hit $4.47B, with net income of $1.88B and a strong net margin of 42.1%, though slightly down from the prior year. Operating expenses rose proportionally with revenue, supporting scalable growth. Interest expense was negligible, enhancing net interest income. Overall, the financials reflect a favorable position with solid profitability and margin control.
Financial Ratios
The table below presents key financial ratios for Robinhood Markets, Inc. over the past five fiscal years, illustrating profitability, leverage, liquidity, and valuation metrics:
| Ratios | 2021 | 2022 | 2023 | 2024 | 2025 |
|---|---|---|---|---|---|
| Net Margin | -203% | -76% | -29% | 48% | 42% |
| ROE | -51% | -15% | -8% | 18% | 21% |
| ROIC | -15% | -11% | -5% | 7% | 8% |
| P/E | -4.2x | -7.0x | -21.0x | 23.3x | 53.4x |
| P/B | 2.1x | 1.0x | 1.7x | 4.1x | 11.0x |
| Current Ratio | 1.56 | 1.41 | 1.58 | 1.39 | 1.00 |
| Quick Ratio | 1.56 | 1.41 | 1.58 | 1.39 | 1.00 |
| D/E | 0.50 | 0.26 | 0.53 | 0.94 | 1.68 |
| Debt-to-Assets | 18% | 8% | 20% | 28% | 40% |
| Interest Coverage | -81x | -40x | -23x | 44x | 0x |
| Asset Turnover | 0.09 | 0.06 | 0.11 | 0.11 | 0.12 |
| Fixed Asset Turnover | 12.4x | 9.3x | 15.5x | 21.2x | 29.0x |
| Dividend Yield | 0% | 0% | 0% | 0% | 0% |
Evolution of Financial Ratios
Over the 2021-2025 period, Robinhood’s Return on Equity (ROE) improved substantially, turning positive and reaching 20.58% in 2025. The Current Ratio declined steadily from about 1.56 to near 1.00, indicating reduced liquidity. Meanwhile, the Debt-to-Equity Ratio increased significantly, rising from 0.50 to 1.68, reflecting higher leverage. Profitability shifted from negative margins to a strong net profit margin above 42%.
Are the Financial Ratios Fovorable?
In 2025, Robinhood’s profitability shows strength with a favorable net margin of 42.1% and ROE at 20.58%. Liquidity ratios are mixed: the quick ratio is favorable at 1.0, but the current ratio is neutral. Leverage is a concern; the debt-to-equity ratio at 1.68 is unfavorable. Market valuation ratios including P/E (53.37) and P/B (10.98) are high and unfavorable. Overall, the ratios lean slightly unfavorable due to valuation and leverage risks.
Shareholder Return Policy
Robinhood Markets, Inc. does not pay dividends, reflecting its reinvestment strategy amid recent profitability. The company focuses on growth and capital allocation to strengthen operations rather than distributing cash to shareholders.
The absence of dividends aligns with its ongoing development phase, supported by share buybacks that manage equity dilution. This approach supports sustainable long-term value creation by prioritizing operational expansion over immediate shareholder payouts.
Score analysis
Here is a radar chart illustrating Robinhood Markets, Inc.’s key financial scores across multiple valuation and performance metrics:
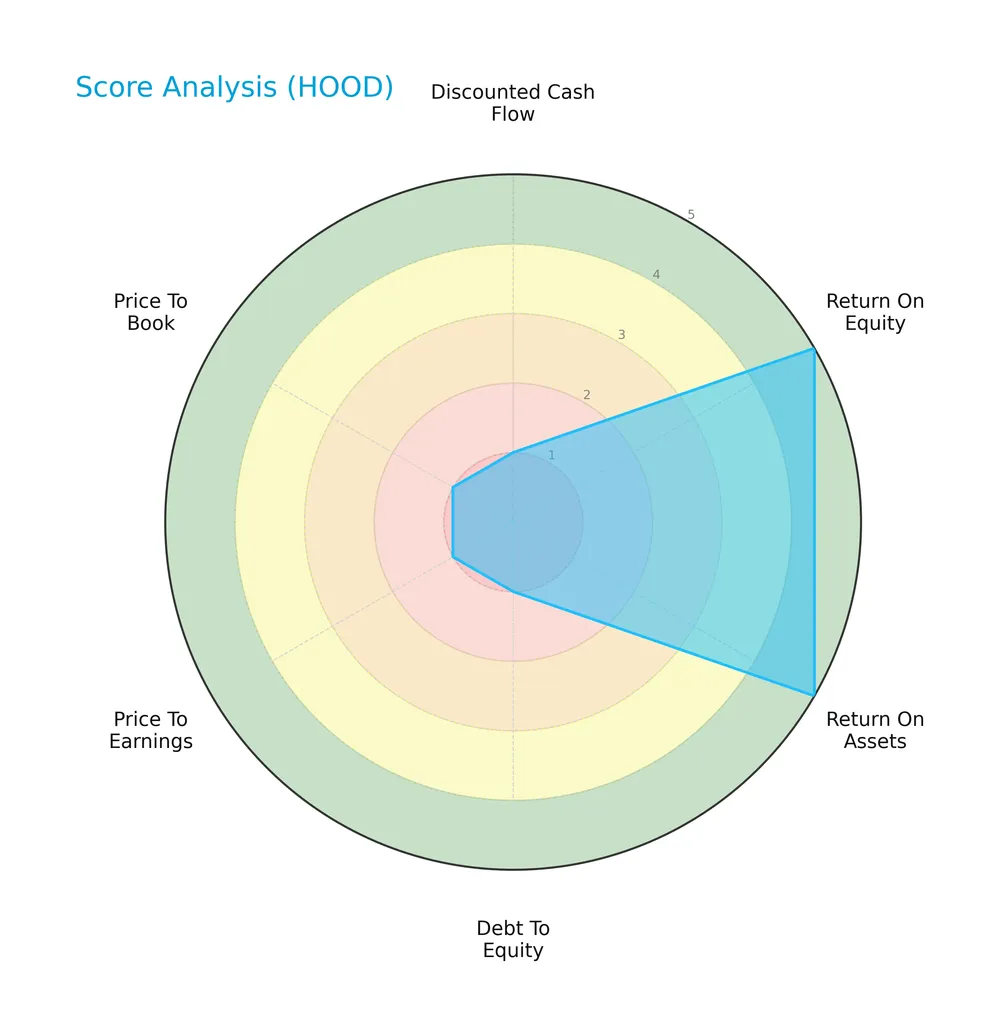
The company scores very favorably on return on equity and assets, indicating strong profitability. However, it rates very unfavorably on discounted cash flow, debt-to-equity, price-to-earnings, and price-to-book metrics, reflecting valuation and leverage concerns.
Analysis of the company’s bankruptcy risk
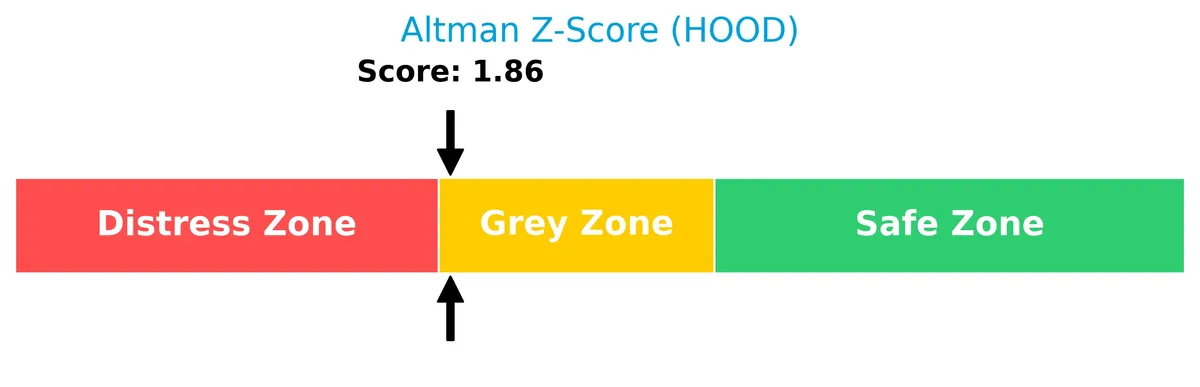
The Altman Z-Score places the company in the grey zone, signaling moderate bankruptcy risk and financial uncertainty:
Is the company in good financial health?
The Piotroski Score diagram below reflects Robinhood’s average financial health status:
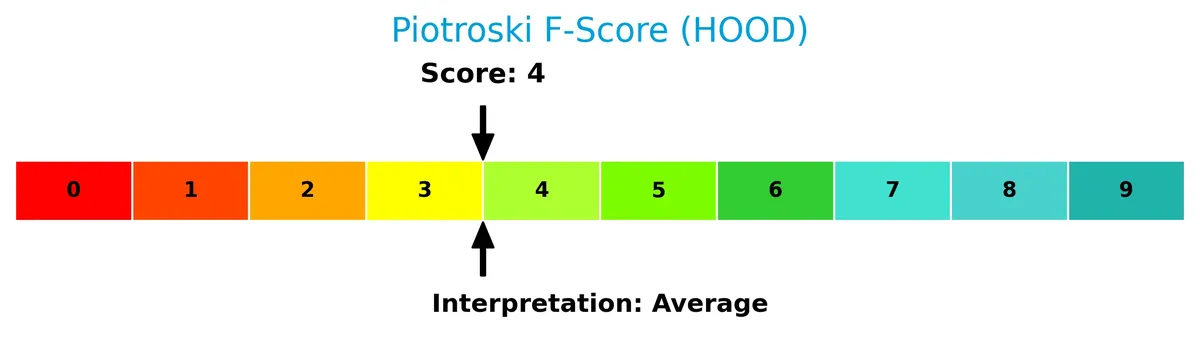
With a score of 4, the company shows mixed financial strength, neither clearly robust nor severely weak, suggesting moderate operational and financial performance.
Competitive Landscape & Sector Positioning
This analysis examines Robinhood Markets, Inc.’s position within the financial services sector. We will explore strategic positioning, revenue segments, key products, competitors, and strengths. I will assess whether Robinhood holds a competitive advantage over its peers.
Strategic Positioning
Robinhood concentrates its revenue primarily in transaction-based services, generating $2.63B in 2025, supplemented by growing gold subscriptions at $179M. Its product portfolio spans stocks, ETFs, options, gold, and cryptocurrencies, focusing solely on the U.S. market.
Revenue by Segment
This pie chart illustrates Robinhood Markets, Inc.’s revenue breakdown by product segment for the fiscal year 2025, highlighting the company’s diversified income streams.
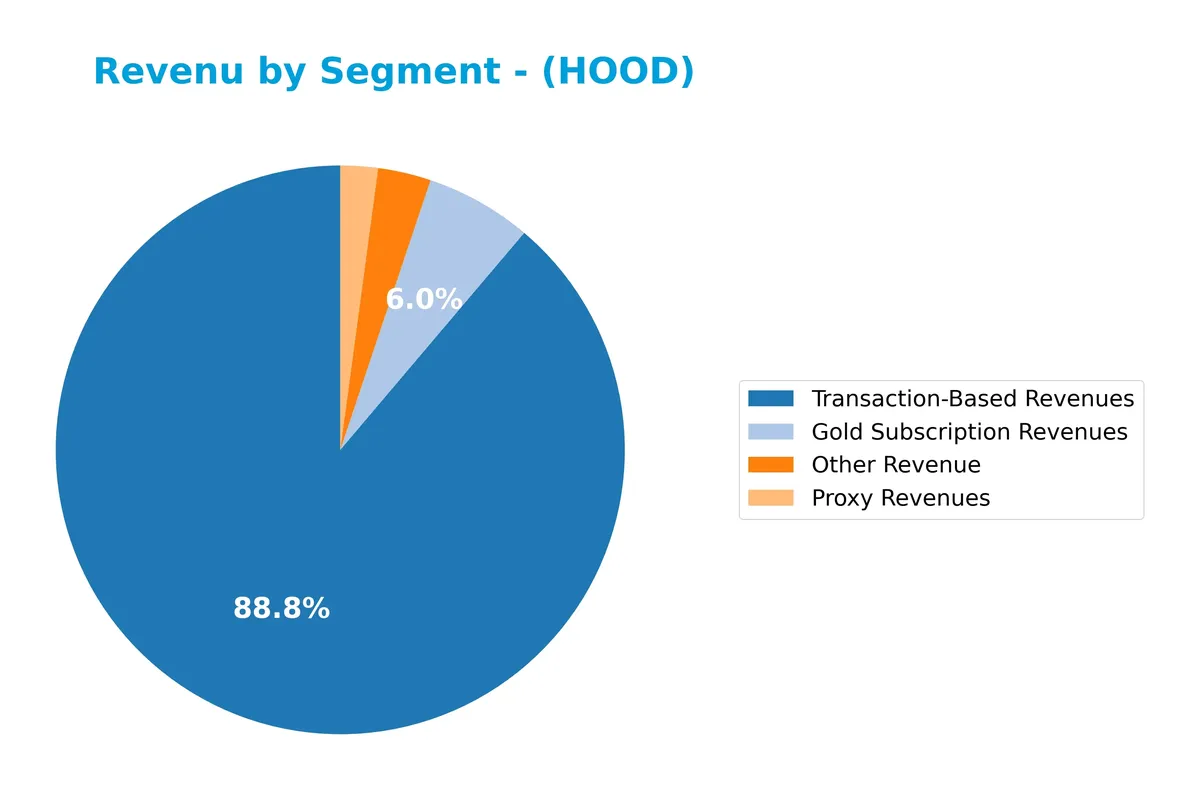
Transaction-Based Revenues dominate at $2.63B, nearly tripling since 2024, reflecting strong trading activity. Gold Subscription Revenues also grew robustly to $179M, indicating growing user engagement with premium services. Other Revenue ($89M) and Proxy Revenues ($63M) remain smaller but contribute to diversification. The 2025 surge signals accelerating monetization, though reliance on transaction fees underscores concentration risk amid market volatility.
Key Products & Brands
Robinhood Markets offers a diverse platform with key products and subscription services generating significant revenue:
| Product | Description |
|---|---|
| Transaction-Based Revenues | Fees from trades in stocks, ETFs, options, cryptocurrencies, and gold on its platform. |
| Gold Subscription Revenues | Premium subscription service providing enhanced trading tools and market data. |
| Proxy Revenues | Income related to securities proxy voting and related services. |
| Other Revenue | Miscellaneous income streams not classified under primary categories. |
| Financial Education Services | Learning resources including Snacks news digest, Learn articles, Newsfeeds from premium sources, and alerts for securities. |
Robinhood’s revenue heavily relies on transaction fees and growing subscription services. Its educational offerings support user engagement and retention within a competitive financial services sector.
Main Competitors
In total, 6 competitors operate in this sector, with the table listing the top 6 leaders by market capitalization:
| Competitor | Market Cap. |
|---|---|
| Morgan Stanley | 289B |
| The Goldman Sachs Group, Inc. | 287B |
| The Charles Schwab Corporation | 185B |
| Robinhood Markets, Inc. | 102B |
| Raymond James Financial, Inc. | 33B |
| Hut 8 Corp. | 5B |
Robinhood Markets ranks 4th among its competitors. Its market cap is 23% of the leader, Morgan Stanley. Robinhood is below both the average market cap of the top 10 competitors (150B) and the median market cap in the sector (143B). It holds a significant 173% market cap gap above its closest rival, Raymond James Financial.
Comparisons with competitors
Check out how we compare the company to its competitors:
Does HOOD have a competitive advantage?
Robinhood Markets, Inc. currently lacks a strong competitive advantage, as it is destroying value with ROIC below WACC. However, its profitability is improving, signaling potential operational progress.
Looking ahead, Robinhood’s platform diversification into stocks, ETFs, options, cryptocurrencies, and educational tools positions it to capture new market segments and expand customer engagement opportunities.
SWOT Analysis
This analysis highlights Robinhood Markets, Inc.’s internal capabilities and external environment to guide strategic decisions.
Strengths
- Strong revenue growth (51.6% last year)
- High gross margin (73.3%)
- Robust EBIT margin (47.1%)
Weaknesses
- High valuation multiples (PE 53.4, PB 11)
- Elevated debt-to-equity ratio (1.68)
- ROIC below WACC, indicating value destruction
Opportunities
- Expansion in crypto and alternative assets
- Growing user base with educational tools
- Potential to increase monetization through cash management
Threats
- Intense competition from established brokers
- Regulatory scrutiny in fintech sector
- Market volatility impacting trading volumes
Robinhood’s strengths in growth and margins provide a strong foundation. However, valuation and capital structure risks require caution. The company must leverage its platform innovation while managing competitive and regulatory challenges.
Stock Price Action Analysis
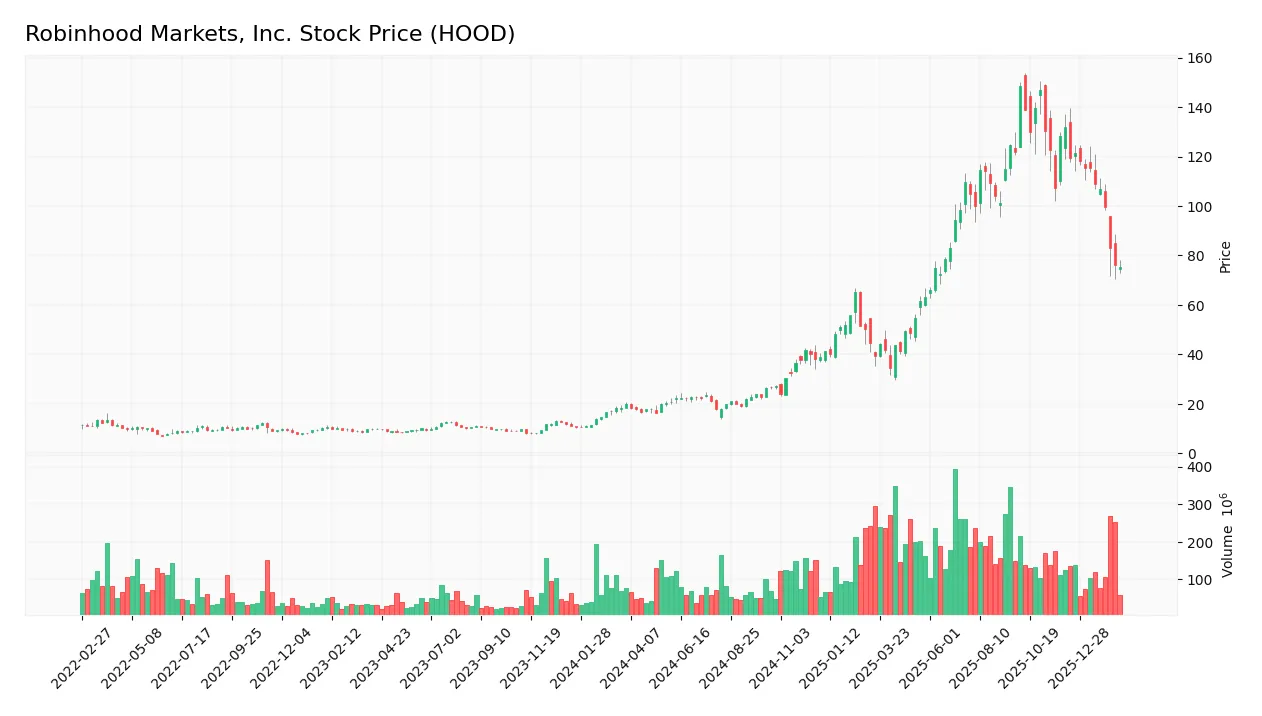
The weekly stock chart of Robinhood Markets, Inc. illustrates price fluctuations and trend shifts over the last 12 months:
Trend Analysis
Over the past year, HOOD’s stock price surged 274%, indicating a strong bullish trend despite deceleration. The price ranged from a low of 16.23 to a high of 148.67, with volatility marked by a 40.87 standard deviation. However, a recent three-month pullback of 43% signals short-term weakness.
Volume Analysis
In the last three months, trading volume decreased with sellers dominating at 76%, signaling bearish sentiment. Buyer volume lagged significantly at 366M versus sellers’ 1.15B. Overall volume is increasing, but recent activity suggests cautious investor participation and selling pressure.
Target Prices
Analysts set a moderate target consensus for Robinhood Markets, Inc., reflecting cautious optimism.
| Target Low | Target High | Consensus |
|---|---|---|
| 100 | 170 | 134.07 |
The target range signals potential upside from current levels, though the wide spread suggests varied analyst confidence.

Don’t Let Luck Decide Your Entry Point
Optimize your entry points with our advanced ProRealTime indicators. You’ll get efficient buy signals with precise price targets for maximum performance. Start outperforming now!
Analyst & Consumer Opinions
This section reviews the latest analyst ratings and consumer feedback regarding Robinhood Markets, Inc. (HOOD).
Stock Grades
Here are the latest verified grades from leading financial institutions for Robinhood Markets, Inc.:
| Grading Company | Action | New Grade | Date |
|---|---|---|---|
| Truist Securities | Maintain | Buy | 2026-02-12 |
| Needham | Maintain | Buy | 2026-02-11 |
| Barclays | Maintain | Overweight | 2026-02-11 |
| Citizens | Maintain | Market Outperform | 2026-02-11 |
| Cantor Fitzgerald | Maintain | Overweight | 2026-02-11 |
| Goldman Sachs | Maintain | Buy | 2026-02-11 |
| Piper Sandler | Maintain | Overweight | 2026-02-11 |
| Cantor Fitzgerald | Maintain | Overweight | 2026-02-09 |
| Keybanc | Maintain | Overweight | 2026-02-09 |
| Truist Securities | Maintain | Buy | 2026-02-06 |
The consensus strongly favors a Buy rating, with multiple firms maintaining positive outlooks. Overweight and Market Outperform ratings dominate, signaling steady confidence without recent upgrades or downgrades.
Consumer Opinions
Consumer sentiment around Robinhood Markets, Inc. reveals a mix of enthusiasm and caution, reflecting its disruptive impact on retail investing.
| Positive Reviews | Negative Reviews |
|---|---|
| User-friendly app that simplifies stock trading. | Frequent outages during peak trading hours. |
| Zero-commission model attracts new investors. | Customer support is slow and unresponsive. |
| Educational resources help beginners learn investing. | Concerns over platform reliability and security issues. |
Overall, users praise Robinhood’s accessibility and commission-free trades as major strengths. However, recurring complaints about technical glitches and customer service highlight areas needing urgent improvement.
Risk Analysis
Below is a summary table outlining key risks facing Robinhood Markets, Inc., including their probability and potential impact:
| Category | Description | Probability | Impact |
|---|---|---|---|
| Market Volatility | High beta of 2.44 indicates Robinhood’s stock price swings significantly. | High | High |
| Valuation Risk | Elevated P/E (53.37) and P/B (10.98) ratios suggest overvaluation risk. | Medium | High |
| Leverage Risk | Debt-to-Equity at 1.68 signals aggressive borrowing relative to equity. | Medium | Medium |
| Liquidity Risk | Current ratio at 1.0 is borderline, limiting cushion against short-term shocks. | Medium | Medium |
| Profitability | ROIC (7.55%) below WACC (13.06%) implies value destruction. | Medium | High |
| Bankruptcy Risk | Altman Z-Score of 1.86 places the company in the ‘grey zone’ for distress. | Low | High |
| Competitive Risk | Intense rivalry in financial services may pressure margins and growth. | Medium | Medium |
The market volatility risk dominates due to Robinhood’s high beta, exposing investors to sharp price swings amid economic cycles. The unfavorable valuation metrics heighten correction risk if growth slows. Meanwhile, ROIC below WACC signals capital inefficiency, a red flag historically associated with deteriorating shareholder returns. The grey-zone Altman Z-Score warrants monitoring for financial distress signs. Overall, I see valuation and operational efficiency risks as the most impactful threats in 2026.
Should You Buy Robinhood Markets, Inc.?
Robinhood Markets, Inc. appears to be improving profitability with growing ROIC despite shedding value relative to WACC. Its leverage profile remains substantial, while overall ratings suggest a cautiously favorable outlook tempered by valuation and debt concerns.
Strength & Efficiency Pillars
Robinhood Markets, Inc. exhibits strong operational profitability with a net margin of 42.1% and an ROE of 20.58%, signaling effective equity utilization. The company’s EBIT margin of 47.13% further highlights its operational efficiency. Despite a neutral ROIC at 7.55%, which falls below its WACC of 13.06%, Robinhood is currently a value destroyer rather than a creator. Still, the firm shows promising revenue growth of 51.58% over the last year, indicating robust top-line expansion amidst operational strength.
Weaknesses and Drawbacks
Robinhood is in the Altman Z-Score grey zone with a 1.86 reading, signaling moderate bankruptcy risk but no immediate distress. The valuation metrics raise concern: a high P/E of 53.37 and P/B of 10.98 mark an expensive premium, increasing downside risk if growth falters. Leverage is elevated with a debt-to-equity ratio of 1.68, coupled with a neutral current ratio of 1.0, suggesting tight liquidity. Recent seller dominance at 75.73% volume pressure may weigh on near-term price appreciation.
Our Final Verdict about Robinhood Markets, Inc.
Robinhood’s profile suggests a company with strong operational profitability and impressive growth but facing valuation and leverage headwinds. The grey zone Altman Z-Score advises caution, especially given recent market selling pressure. Despite its bullish long-term trend, the recent seller dominance and premium valuation suggest a wait-and-see approach before committing new capital. The profile may appear attractive for aggressive investors but remains too risky for conservative capital.
Disclaimer: This content is for informational purposes only and does not constitute financial, investment, or other professional advice. Investing in financial markets involves a significant risk of loss, and past performance is not indicative of future results.
Additional Resources
- Robinhood Markets Inc (HOOD)’s Earnings Surge: Gold Subscriptions Shine, Crypto Lags – Yahoo Finance (Feb 17, 2026)
- Robinhood offers private-company fund to everyday investors at $25 a share – Stock Titan (Feb 17, 2026)
- 1 Volatile Stock Worth Your Attention and 2 We Turn Down – Finviz (Feb 16, 2026)
- Robinhood Launches $1B Fund To Give Retail Investors Access To Space X, Stripe – Benzinga (Feb 18, 2026)
- Robinhood Ventures Fund I (RVI) Announces Launch of Initial Public Offering – markets.businessinsider.com (Feb 17, 2026)
For more information about Robinhood Markets, Inc., please visit the official website: robinhood.com