Home > Analyses > Healthcare > Revvity, Inc.
Revvity, Inc. drives critical advances in medical diagnostics and life sciences research, impacting millions of lives worldwide. Its cutting-edge instruments and software empower breakthroughs in genetic disorder detection, infectious disease testing, and environmental analysis. As a stalwart in healthcare innovation with a legacy dating back to 1937, Revvity balances robust scientific solutions and expanding market influence. The key question: does its current financial health and growth trajectory justify its premium valuation in 2026?

Table of contents
Business Model & Company Overview
Revvity, Inc., founded in 1937 and headquartered in Waltham, MA, commands a leading position in the Medical Diagnostics & Research sector. It delivers an integrated ecosystem of instruments, reagents, and software that drive breakthroughs in life sciences and diagnostics. Its two core segments—Discovery & Analytical Solutions and Diagnostics—work cohesively to support scientific research, environmental analysis, and early disease detection worldwide.
The company’s revenue engine balances hardware sales with software subscriptions and recurring service contracts. Revvity’s global footprint spans the Americas, Europe, and Asia, serving pharmaceutical firms, research institutions, and healthcare providers. This diversified model secures a robust cash flow and reinforces its economic moat, shaping the future of diagnostics through innovation and scale.
Financial Performance & Fundamental Metrics
I analyze Revvity, Inc.’s income statement, key financial ratios, and dividend payout policy to assess its core financial health and shareholder value creation.
Income Statement
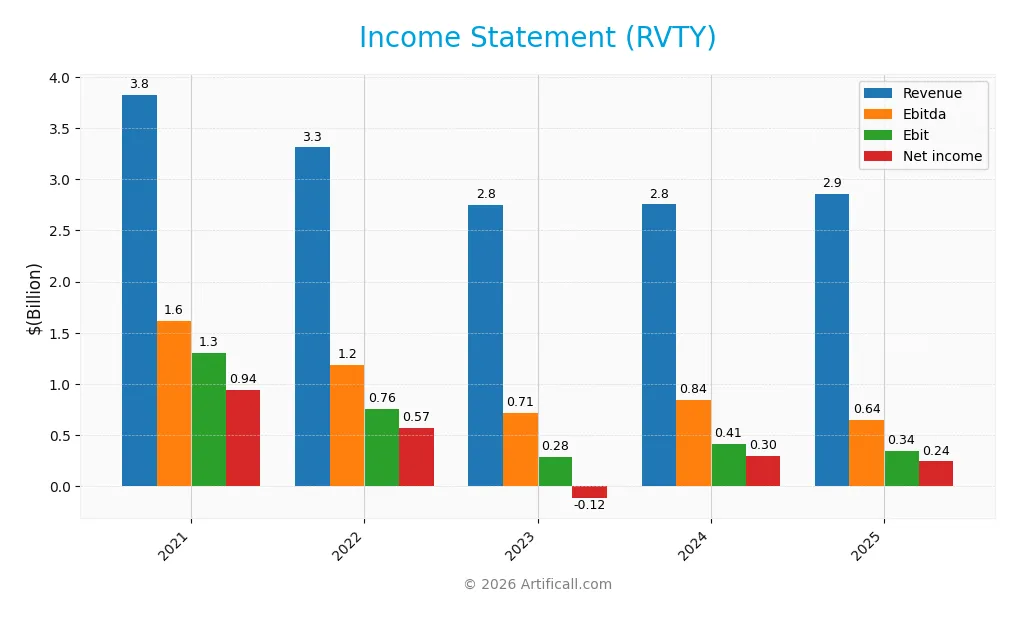
The table below summarizes Revvity, Inc.’s key income statement figures for fiscal years 2021 through 2025, reflecting revenue trends and profitability metrics.
| 2021 | 2022 | 2023 | 2024 | 2025 | |
|---|---|---|---|---|---|
| Revenue | 3.83B | 3.31B | 2.75B | 2.76B | 2.86B |
| Cost of Revenue | 1.55B | 1.55B | 1.43B | 1.43B | 1.34B |
| Operating Expenses | 942M | 980M | 923M | 912M | 1.16B |
| Gross Profit | 2.28B | 1.76B | 1.32B | 1.32B | 1.52B |
| EBITDA | 1.62B | 1.18B | 714M | 840M | 644M |
| EBIT | 1.31B | 756M | 282M | 412M | 341M |
| Interest Expense | 102M | 104M | 99M | 96M | 92M |
| Net Income | 943M | 569M | -118M | 296M | 242M |
| EPS | 8.12 | 4.51 | -0.95 | 2.41 | 2.08 |
| Filing Date | 2021-12-31 | 2022-12-31 | 2023-12-31 | 2025-02-25 | 2026-02-24 |
Income Statement Evolution
Revvity’s revenue declined by 25.4% from 2021 to 2025, with a slight 3.7% growth from 2024 to 2025. Gross profit improved by 14.6% year-over-year, boosting the gross margin to a favorable 53.1%. However, EBIT and net income margins contracted, with net margin falling 21.2% last year and 65.7% over the full period.
Is the Income Statement Favorable?
In 2025, Revvity reported a net income of $242M on $2.86B revenue, yielding an 8.5% net margin, considered favorable by industry standards. Despite stable interest expense and strong gross margin, EBIT declined 17.2% and operating expenses grew in line with revenue, dampening profitability. Overall, 57% of income statement metrics are unfavorable, reflecting structural challenges.
Financial Ratios
The following table summarizes key financial ratios for Revvity, Inc. over the past five fiscal years, providing insight into profitability, valuation, liquidity, leverage, and operational efficiency:
| Ratios | 2021 | 2022 | 2023 | 2024 | 2025 |
|---|---|---|---|---|---|
| Net Margin | 25% | 17% | -4% | 11% | 8% |
| ROE | 13% | 8% | -2% | 4% | 3% |
| ROIC | 7% | 5% | 3% | 3% | 3% |
| P/E | 25 | 31 | -115 | 46 | 45 |
| P/B | 3.3 | 2.4 | 1.7 | 1.8 | 1.5 |
| Current Ratio | 2.0 | 2.1 | 2.1 | 3.6 | 1.7 |
| Quick Ratio | 1.7 | 1.9 | 1.8 | 3.0 | 1.4 |
| D/E | 0.72 | 0.62 | 0.52 | 0.43 | 0.48 |
| Debt-to-Assets | 34% | 33% | 30% | 27% | 29% |
| Interest Coverage | 13.1 | 7.5 | 4.0 | 4.3 | 3.9 |
| Asset Turnover | 0.26 | 0.23 | 0.20 | 0.22 | 0.23 |
| Fixed Asset Turnover | 5.9 | 4.9 | 4.1 | 4.2 | 4.4 |
| Dividend Yield | 0.14% | 0.20% | 0.26% | 0.25% | 0.30% |
All figures are rounded for clarity. Negative net margin and ROE in 2023 highlight a challenging year. The elevated P/E in 2023 reflects earnings volatility. Liquidity peaked in 2024 but declined notably in 2025. Leverage ratios remain moderate, with interest coverage declining but still above 3x in 2025. Asset turnover ratios show stable operational efficiency. Dividend yield has grown steadily but remains below 0.5%.
Evolution of Financial Ratios
Return on Equity (ROE) declined from 13.2% in 2021 to 3.3% in 2025, reflecting weakened profitability. The Current Ratio showed volatility, peaking at 3.6 in 2024 before falling to 1.68 in 2025, indicating reduced liquidity. The Debt-to-Equity Ratio steadily improved from 0.72 in 2021 to 0.48 in 2025, signaling better leverage management.
Are the Financial Ratios Fovorable?
In 2025, profitability ratios like ROE (3.3%) and ROIC (2.8%) remain below the WACC (7.3%), marking unfavorable returns. Liquidity ratios are favorable, with a Current Ratio of 1.68 and Quick Ratio of 1.4. Leverage is well controlled, shown by a Debt-to-Equity of 0.48 and Debt-to-Assets at 28.9%. Asset turnover is weak at 0.23, and the high P/E of 45.5 suggests valuation risks. Overall, ratios are slightly favorable but reveal some profitability and efficiency concerns.
Shareholder Return Policy
Revvity, Inc. maintains a modest dividend payout ratio around 13.5%, with dividends per share stable near $0.29. Its annual dividend yield remains below 0.3%, reflecting a conservative cash return approach supported by free cash flow coverage above 5x.
The company also engages in share buybacks, complementing dividends to return capital. This balanced distribution strategy appears prudent, supporting sustainable shareholder value without risking overextension on payouts or repurchases amid moderate profitability.
Score analysis
The following radar chart illustrates Revvity, Inc.’s key financial scores and valuation metrics:
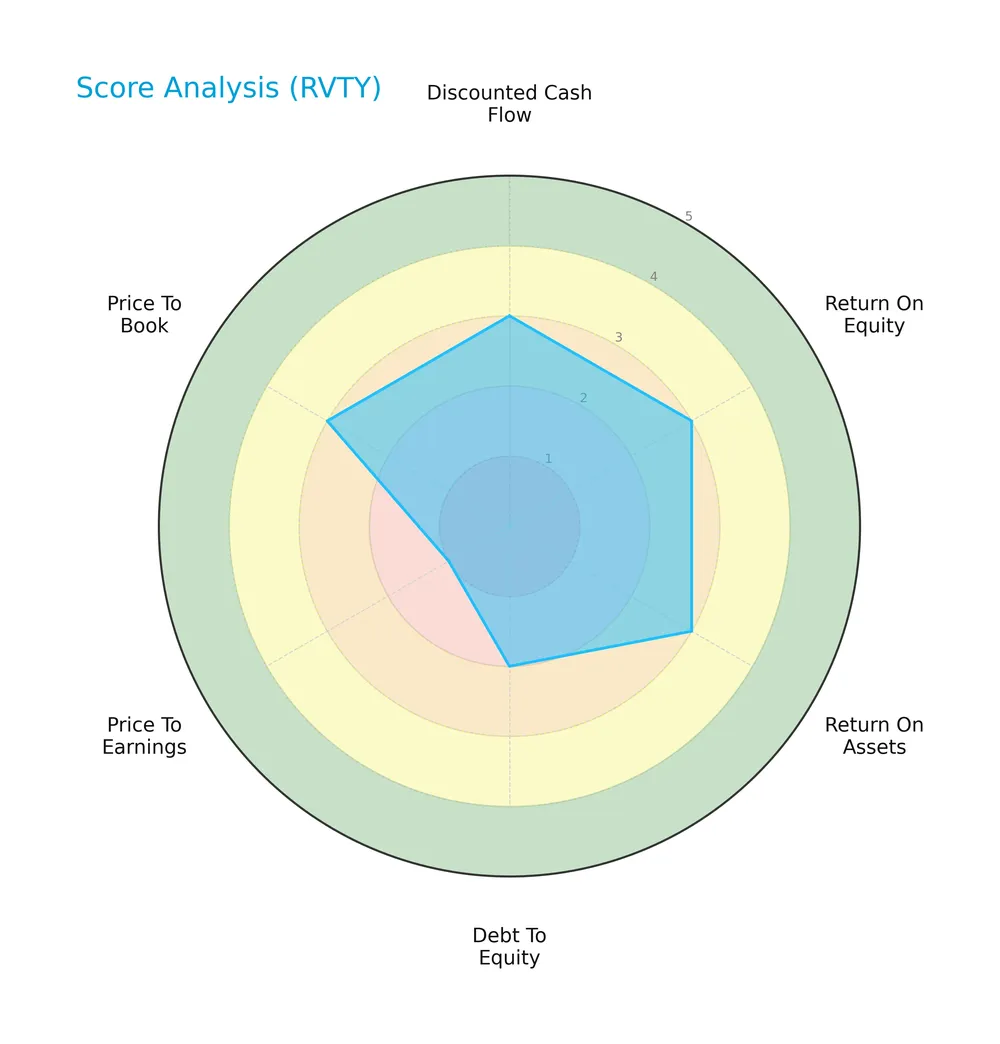
Revvity’s discounted cash flow and price-to-book scores are favorable at 4. Return on equity and assets score moderately at 3 each. Debt-to-equity and price-to-earnings scores lag, registering 2 and 1 respectively, indicating valuation and leverage concerns.
Analysis of the company’s bankruptcy risk
The Altman Z-Score places Revvity in the grey zone, signaling a moderate risk of financial distress:

Is the company in good financial health?
The Piotroski Score diagram highlights the company’s financial strength based on nine key criteria:

With a Piotroski Score of 7, Revvity demonstrates strong financial health, reflecting robust profitability and operational efficiency despite some leverage concerns.
Competitive Landscape & Sector Positioning
This sector analysis reviews Revvity, Inc.’s strategic positioning, revenue segments, key products, competitors, and competitive advantages. I will assess whether Revvity holds a competitive edge over its main rivals.
Strategic Positioning
Revvity, Inc. maintains a balanced product portfolio split between Diagnostics and Life Sciences, each generating roughly $1.4B in 2025. Its geographic exposure spans the US ($1.13B), China ($425M), Germany ($178M), UK ($127M), and other international markets ($2.73B), reflecting broad global diversification.
Revenue by Segment
The pie chart illustrates Revvity, Inc.’s revenue breakdown by segment for fiscal year 2025, highlighting the relative contributions of Diagnostics and Life Sciences.
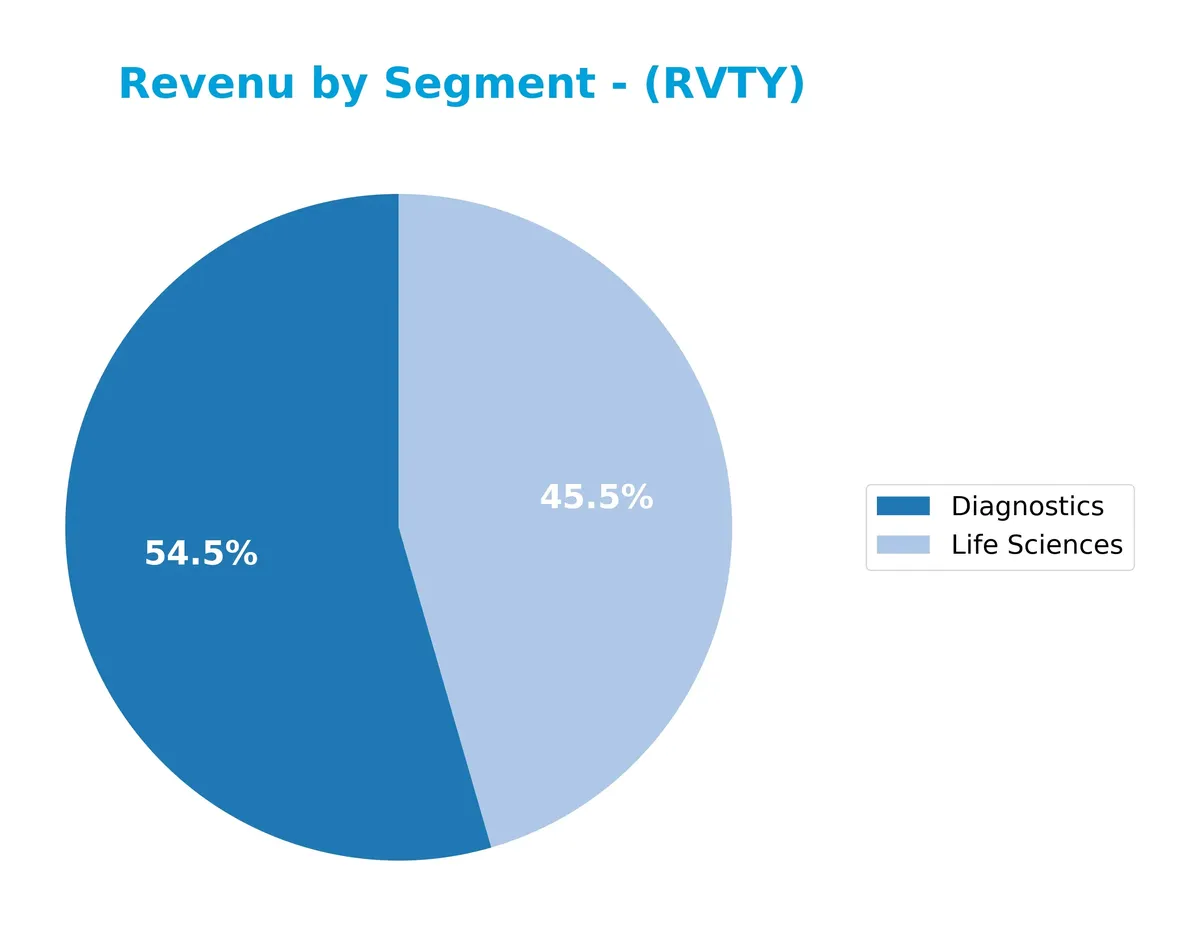
In 2025, Life Sciences revenue reached $1.43B, surpassing Diagnostics at $1.42B, signaling a shift from 2024 when Diagnostics led with $1.50B. Life Sciences grew substantially by $180M, while Diagnostics declined by $75M. This trend suggests a strategic pivot or market dynamics favoring Life Sciences, though the segments remain nearly balanced, implying moderate concentration risk.
Key Products & Brands
The table below outlines Revvity’s main products and brand segments with concise descriptions:
| Product | Description |
|---|---|
| Diagnostics | Instruments, reagents, assay platforms, and software for genetic disorder detection, infectious disease testing, and genomic workflows. |
| Life Sciences | Instruments, reagents, software, subscriptions, and imaging technologies supporting research breakthroughs and analytical services. |
Revvity operates through two primary segments: Diagnostics focuses on early detection and genomic technologies, while Life Sciences provides tools enabling research and industrial analysis. Both segments serve diverse markets including healthcare, pharma, agriculture, and industrial sectors.
Main Competitors
There are 11 competitors in the Healthcare Medical – Diagnostics & Research sector; here are the top 10 leaders by market capitalization:
| Competitor | Market Cap. |
|---|---|
| Thermo Fisher Scientific Inc. | 225B |
| Danaher Corporation | 165B |
| IDEXX Laboratories, Inc. | 53.5B |
| Agilent Technologies, Inc. | 39.1B |
| IQVIA Holdings Inc. | 38.4B |
| Mettler-Toledo International Inc. | 28.8B |
| Waters Corporation | 22.7B |
| Quest Diagnostics Incorporated | 19.4B |
| Revvity, Inc. | 11.6B |
| Charles River Laboratories International, Inc. | 10.0B |
Revvity ranks 9th among its 11 competitors, with a market cap just 5.05% of the sector leader, Thermo Fisher Scientific. It sits below both the average market cap of the top 10 (61.3B) and the sector median (28.8B). The company enjoys a 71.4% market cap gap over its nearest competitor above, reflecting a notable scale difference.
Comparisons with competitors
Check out how we compare the company to its competitors:
Does Revvity have a competitive advantage?
Revvity currently lacks a competitive advantage, as it is destroying value with a ROIC 4.4% below its WACC and a sharply declining profitability trend. Its income statement also shows unfavorable growth, signaling operational challenges.
Looking ahead, Revvity’s diversified diagnostics and life sciences portfolio offers opportunities in genomic workflows and early disease detection. Expansion into new markets and innovative products may improve its competitive positioning over time.
SWOT Analysis
This analysis highlights Revvity, Inc.’s core internal capabilities and external market factors shaping its strategic outlook.
Strengths
- diversified product portfolio
- strong presence in diagnostics and life sciences
- favorable gross margin of 53%
Weaknesses
- declining revenue and net income over 5 years
- ROIC below WACC indicating value destruction
- high P/E ratio signaling overvaluation risk
Opportunities
- growth in genomic and precision medicine markets
- expanding international revenue streams
- innovation in protein and DNA sequencing technologies
Threats
- intense competition in healthcare diagnostics
- regulatory risks in medical markets
- macroeconomic pressures impacting R&D spending
Revvity shows solid operational strengths but suffers from declining profitability and value destruction. Its strategy must focus on innovation and global expansion to offset financial headwinds and competitive pressures.
Stock Price Action Analysis
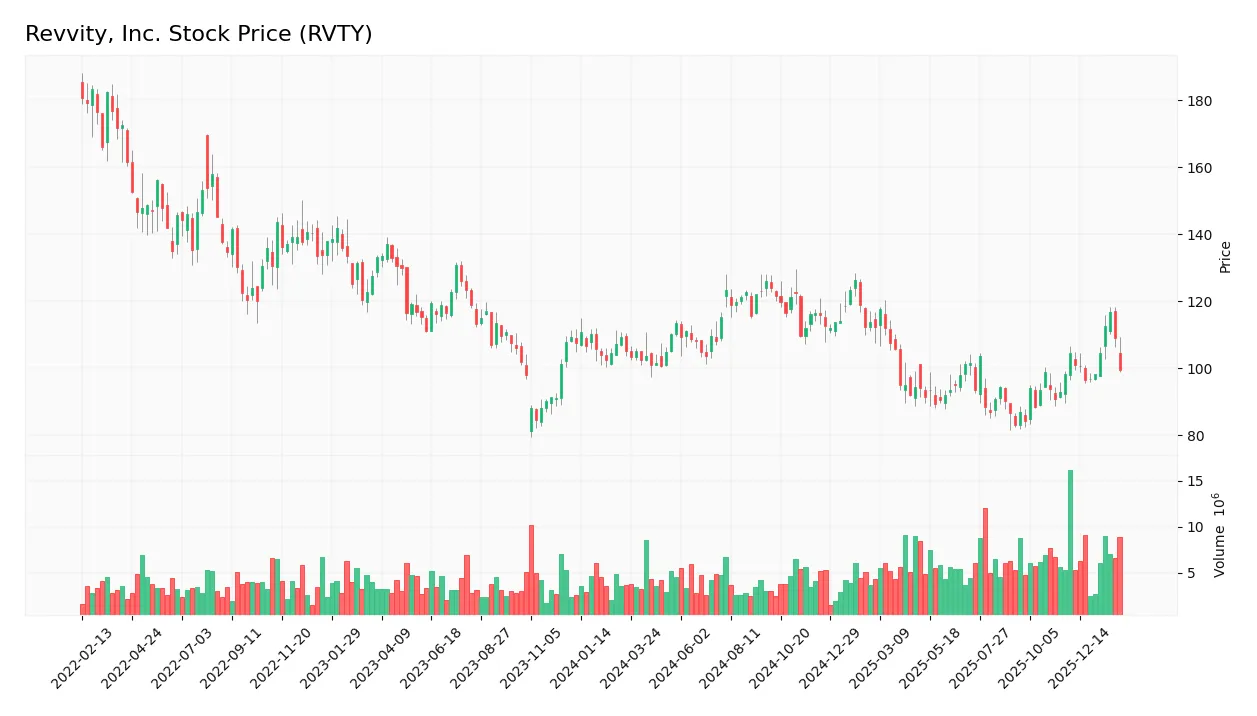
The weekly stock chart for Revvity, Inc. depicts price movements and volatility over the last 12 months in clear detail:
Trend Analysis
Over the past year, RVTY’s stock declined by 4.56%, indicating a bearish trend with accelerating downward momentum. The price ranged between 126.13 at its peak and 82.87 at its lowest, with notable volatility reflected in an 11.44 standard deviation.
Volume Analysis
Trading volume has increased overall, with buyers accounting for 53.62% historically. However, in the recent three months, volume shows slight seller dominance at 56.24%, suggesting cautious investor sentiment and a potential shift in market participation.
Target Prices
Analysts present a solid target consensus for Revvity, Inc., reflecting cautious optimism.
| Target Low | Target High | Consensus |
|---|---|---|
| 105 | 129 | 115.14 |
The target range signals moderate upside potential with a consensus price near 115. Analysts expect steady growth but remain mindful of sector volatility.

Don’t Let Luck Decide Your Entry Point
Optimize your entry points with our advanced ProRealTime indicators. You’ll get efficient buy signals with precise price targets for maximum performance. Start outperforming now!
Analyst & Consumer Opinions
This section examines analyst ratings and consumer feedback to provide a comprehensive view of Revvity, Inc.’s market perception.
Stock Grades
Here is the latest set of verified stock grades for Revvity, Inc. from reputable financial institutions:
| Grading Company | Action | New Grade | Date |
|---|---|---|---|
| Wells Fargo | Maintain | Equal Weight | 2026-02-03 |
| Jefferies | Maintain | Hold | 2026-02-03 |
| TD Cowen | Maintain | Buy | 2026-02-03 |
| Barclays | Maintain | Overweight | 2026-02-03 |
| JP Morgan | Maintain | Neutral | 2026-02-03 |
| Evercore ISI Group | Maintain | Outperform | 2026-02-03 |
| Barclays | Maintain | Overweight | 2025-12-15 |
| Wells Fargo | Maintain | Equal Weight | 2025-12-15 |
| Baird | Maintain | Outperform | 2025-10-28 |
| Barclays | Maintain | Overweight | 2025-10-28 |
The consensus among top-tier analysts shows a steady preference for holding or buying Revvity shares, with no recent downgrades. Barclays and Evercore consistently rate it favorably, while Wells Fargo and Jefferies remain more cautious.
Consumer Opinions
Revvity, Inc. sparks a mix of enthusiasm and critique among its customer base, reflecting its evolving market position.
| Positive Reviews | Negative Reviews |
|---|---|
| “Innovative product lineup with reliable performance.” | “Customer service response times are slow.” |
| “Strong commitment to quality and consistent updates.” | “Pricing feels a bit steep compared to competitors.” |
| “User-friendly interface enhances overall experience.” | “Occasional glitches disrupt workflow efficiency.” |
Overall, consumers praise Revvity’s innovation and quality but frequently cite service delays and pricing as pain points. This feedback highlights solid product fundamentals overshadowed by operational execution challenges.
Risk Analysis
The following table summarizes key risks facing Revvity, Inc., covering likelihood and potential impact:
| Category | Description | Probability | Impact |
|---|---|---|---|
| Financial Health | Altman Z-Score in grey zone signals moderate bankruptcy risk amid uneven profitability metrics. | Medium | High |
| Valuation Risk | Elevated P/E ratio (45.5) suggests potential overvaluation compared to healthcare sector norms. | High | Medium |
| Profitability | Low ROE (3.33%) and ROIC (2.82%) below WACC (7.25%) indicate weak capital returns. | High | High |
| Leverage | Moderate debt levels (D/E 0.48) and interest coverage (3.7x) could constrain financial flexibility. | Medium | Medium |
| Market Volatility | Beta near 1.09 exposes shares to sector and macroeconomic swings in diagnostics and research. | High | Medium |
The most pressing risks are Revvity’s low returns on invested capital paired with a high valuation multiple. This combination raises concerns about sustainable growth and margin pressure in the competitive Diagnostics & Research sector. The Altman Z-Score’s grey zone status adds caution on financial stability, despite a strong Piotroski Score. Investors should weigh these risks carefully against sector benchmarks and economic cycles.
Should You Buy Revvity, Inc.?
Revvity, Inc. appears to show declining profitability and a very unfavorable competitive moat, suggesting value erosion. Despite a moderate overall rating of B and a manageable leverage profile, its operational efficiency could be seen as under pressure in a challenging environment.
Strength & Efficiency Pillars
Revvity, Inc. maintains operational efficiency with a solid gross margin of 53.08% and an EBIT margin of 11.95%. Its net margin stands at 8.46%, reflecting consistent profitability despite recent pressures. However, the return on equity (3.33%) and return on invested capital (2.82%) lag behind the weighted average cost of capital (7.25%), indicating the company is currently not a value creator. While the current and quick ratios (1.68 and 1.40) support liquidity strength, the overall financial health shows mixed signals.
Weaknesses and Drawbacks
The company faces notable valuation and leverage concerns. Its price-to-earnings ratio of 45.49 signals a premium valuation, which may limit upside amid earnings pressure. Although the debt-to-equity ratio is moderate at 0.48, the asset turnover ratio (0.23) is unfavorable, suggesting inefficient asset use. Importantly, the Altman Z-Score of 1.80 places Revvity in the grey zone, highlighting a moderate risk of financial distress. Recent market activity shows slight seller dominance at 43.76%, adding near-term headwinds.
Our Final Verdict about Revvity, Inc.
Despite operational profitability and a strong Piotroski score of 7, the Altman Z-Score in the grey zone and high valuation metrics make Revvity’s profile cautiously speculative. The company might appear attractive for investors who tolerate moderate risk, but the moderate solvency risk and recent bearish price trend suggest a wait-and-see approach for better entry points.
Disclaimer: This content is for informational purposes only and does not constitute financial, investment, or other professional advice. Investing in financial markets involves a significant risk of loss, and past performance is not indicative of future results.
Additional Resources
- Decoding Revvity Inc (RVTY): A Strategic SWOT Insight – GuruFocus (Feb 25, 2026)
- Do Wall Street Analysts Like Revvity Stock? – Yahoo Finance (Feb 23, 2026)
- Revvity: Close To A Buy, Not Quite There (NYSE:RVTY) – Seeking Alpha (Feb 03, 2026)
- Revvity Unveils SLAS2026 Platforms As Valuation Gap Attracts Attention – Sahm (Feb 12, 2026)
- Revvity to Present at Upcoming Investor Conferences – Business Wire (Feb 17, 2026)
For more information about Revvity, Inc., please visit the official website: perkinelmer.com