Home > Analyses > Healthcare > ResMed Inc.
ResMed Inc. transforms how millions breathe and sleep, delivering cutting-edge medical devices and cloud-based solutions that improve respiratory health worldwide. As a pioneer in sleep and respiratory care, ResMed’s innovative products—from ventilation devices to remote monitoring platforms—have set industry standards for quality and patient engagement. With a strong global presence and a reputation for technological leadership, the key question is whether ResMed’s current fundamentals support its valuation and future growth in an evolving healthcare landscape.
Table of contents
Business Model & Company Overview
ResMed Inc., founded in 1989 and headquartered in San Diego, California, stands as a global leader in the Medical – Instruments & Supplies industry. The company has built a cohesive ecosystem combining medical devices and cloud-based software, primarily targeting respiratory and sleep disorders. Its integrated product range spans ventilation devices, diagnostic tools, mask systems, and digital health applications, uniting clinical innovation with patient-centric care across 140 countries.
The company’s revenue engine balances hardware sales with a growing portfolio of recurring software services, including remote monitoring and patient management platforms like AirView and myAir. This strategic mix fuels ResMed’s presence in major markets across the Americas, Europe, and Asia, delivering value through both product innovation and subscription-based solutions. ResMed’s robust competitive advantage lies in its integrated technology ecosystem, which continues to shape the future of respiratory healthcare worldwide.
Financial Performance & Fundamental Metrics
I will analyze ResMed Inc.’s income statement, key financial ratios, and dividend payout policy to provide a clear view of its fundamental health and profitability.
Income Statement
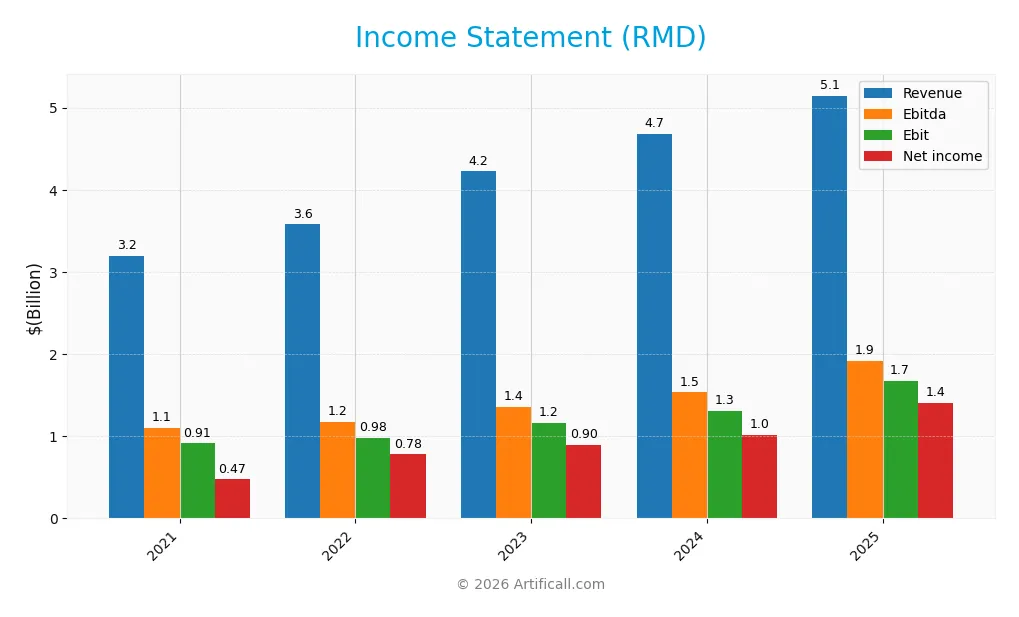
The table below summarizes ResMed Inc.’s key income statement figures for the fiscal years 2021 through 2025, expressed in USD.
| 2021 | 2022 | 2023 | 2024 | 2025 | |
|---|---|---|---|---|---|
| Revenue | 3.20B | 3.58B | 4.22B | 4.69B | 5.15B |
| Cost of Revenue | 1.36B | 1.55B | 1.87B | 2.03B | 2.09B |
| Operating Expenses | 935M | 1.02B | 1.22B | 1.34B | 1.37B |
| Gross Profit | 1.84B | 2.02B | 2.36B | 2.66B | 3.05B |
| EBITDA | 1.10B | 1.18B | 1.36B | 1.53B | 1.91B |
| EBIT | 912M | 983M | 1.16B | 1.31B | 1.68B |
| Interest Expense | 24M | 22M | 47M | 46M | 13M |
| Net Income | 475M | 779M | 898M | 1.02B | 1.40B |
| EPS | 3.27 | 5.34 | 6.12 | 6.94 | 9.55 |
| Filing Date | 2021-08-17 | 2022-08-12 | 2023-08-11 | 2024-08-09 | 2025-08-08 |
Income Statement Evolution
From 2021 to 2025, ResMed Inc. (RMD) experienced consistent revenue growth, increasing by 61% overall, with a notable 9.8% rise in the latest year. Net income surged even more sharply, nearly tripling over the period, supported by a 24.9% increase in net margin last year. Gross and EBIT margins remained robust at 59.4% and 32.6% respectively, reflecting stable profitability and efficient cost control.
Is the Income Statement Favorable?
The 2025 income statement reveals strong fundamentals: revenue reached $5.15B, with net income at $1.4B and an EPS of $9.55. Margins are favorable, including a 27.2% net margin and a low 0.25% interest expense ratio, indicating efficient financing costs. Growth rates across revenue, EBIT, and EPS are all positive, confirming a healthy operational and financial performance for the fiscal year.
Financial Ratios
The following table presents key financial ratios for ResMed Inc. (RMD) over the fiscal years 2021 to 2025, illustrating profitability, valuation, liquidity, solvency, and efficiency metrics:
| Ratios | 2021 | 2022 | 2023 | 2024 | 2025 |
|---|---|---|---|---|---|
| Net Margin | 15% | 22% | 21% | 22% | 27% |
| ROE | 16% | 23% | 22% | 21% | 23% |
| ROIC | 13% | 18% | 15% | 18% | 20% |
| P/E | 75.5 | 39.3 | 35.7 | 26.9 | 27.0 |
| P/B | 12.4 | 9.1 | 7.8 | 5.7 | 6.3 |
| Current Ratio | 1.7 | 2.8 | 3.1 | 2.6 | 3.4 |
| Quick Ratio | 1.2 | 1.7 | 1.8 | 1.7 | 2.5 |
| D/E | 0.28 | 0.27 | 0.38 | 0.18 | 0.14 |
| Debt-to-Assets | 17% | 18% | 23% | 13% | 10% |
| Interest Coverage | 38 | 45 | 24 | 29 | 134 |
| Asset Turnover | 0.68 | 0.70 | 0.63 | 0.68 | 0.63 |
| Fixed Asset Turnover | 5.4 | 5.7 | 6.3 | 6.7 | 7.2 |
| Dividend Yield | 0.6% | 0.8% | 0.8% | 1.0% | 0.8% |
Evolution of Financial Ratios
From 2021 to 2025, ResMed Inc.’s Return on Equity (ROE) showed a consistent upward trend, rising from 16.44% to 23.47%, indicating improving profitability. The Current Ratio fluctuated, starting at 1.73 in 2021, peaking around 3.44 in 2025, reflecting varying liquidity levels. The Debt-to-Equity ratio steadily decreased from 0.28 to 0.14, suggesting reduced financial leverage and enhanced balance sheet stability.
Are the Financial Ratios Favorable?
In 2025, ResMed’s profitability ratios such as net margin (27.22%) and ROE (23.47%) were favorable, signaling strong earnings efficiency. Liquidity ratios showed mixed signals: the quick ratio was favorable at 2.53, while the current ratio was unfavorable at 3.44, possibly indicating excess current assets. Leverage ratios, including debt-to-equity (0.14) and debt-to-assets (10.42%), were favorable, indicating low debt levels. Market valuation ratios like P/E (27.02) and P/B (6.34) were unfavorable, and efficiency was neutral with an asset turnover of 0.63. Overall, 64.29% of the ratios were favorable, leading to a generally favorable financial profile.
Shareholder Return Policy
ResMed Inc. maintains a consistent dividend payout ratio around 22-48%, with dividends per share rising steadily from $1.56 in 2021 to $2.12 in 2025. The annual dividend yield remains below 1%, supported by strong free cash flow coverage near 95%, indicating a sustainable distribution policy.
The company also engages in share buybacks, complementing dividend payments to return capital to shareholders. This balanced approach, combining moderate dividends and buybacks with solid cash flow and profitability metrics, suggests a shareholder return strategy aligned with sustainable long-term value creation.
Score analysis
The following radar chart displays ResMed Inc.’s key financial scores across valuation, profitability, and leverage metrics:
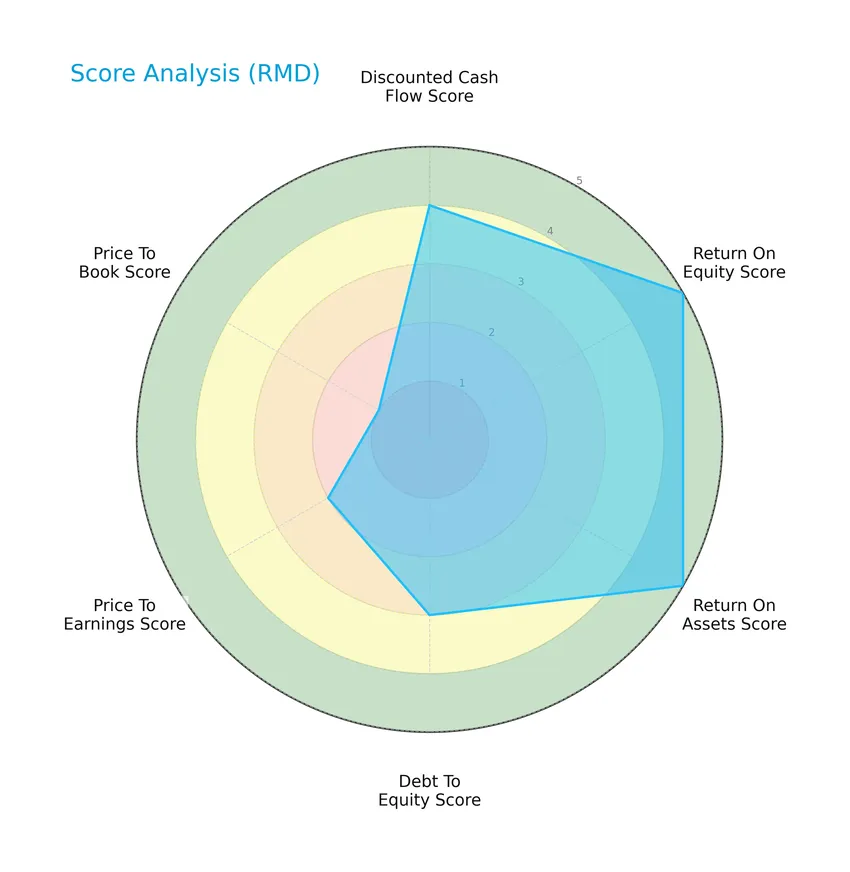
ResMed shows very favorable profitability scores with a 5 in both return on equity and return on assets. The discounted cash flow score is favorable at 4. However, leverage and valuation metrics present mixed signals: a moderate debt-to-equity score of 3, a moderate price-to-earnings score of 2, and a very unfavorable price-to-book score of 1.
Analysis of the company’s bankruptcy risk
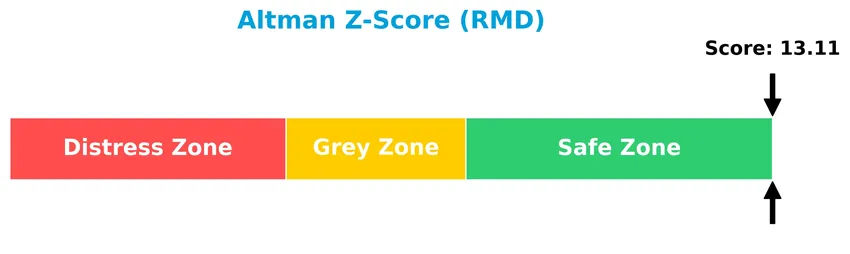
The Altman Z-Score places ResMed well within the safe zone, indicating a very low risk of bankruptcy based on its financial ratios:
Is the company in good financial health?
The Piotroski Score diagram highlights ResMed’s financial strength and operational efficiency:

With a Piotroski Score of 7, ResMed demonstrates strong financial health, suggesting good profitability, liquidity, and operational efficiency, though not at the maximum level of financial robustness.
Competitive Landscape & Sector Positioning
This sector analysis will examine ResMed Inc.’s strategic positioning, revenue by segment, key products, main competitors, competitive advantages, and SWOT profile. I will assess whether ResMed holds a competitive advantage over its industry peers.
Strategic Positioning
ResMed Inc. maintains a diversified product portfolio focused on Sleep and Respiratory Care and Software as a Service, generating $4.1B and $584M respectively in 2024. Geographically, it operates globally with significant revenue from the US at $3B, reflecting broad market exposure across approximately 140 countries.
Revenue by Segment
This pie chart displays ResMed Inc.’s revenue distribution by product segments for the fiscal year 2024, highlighting the company’s main business areas.
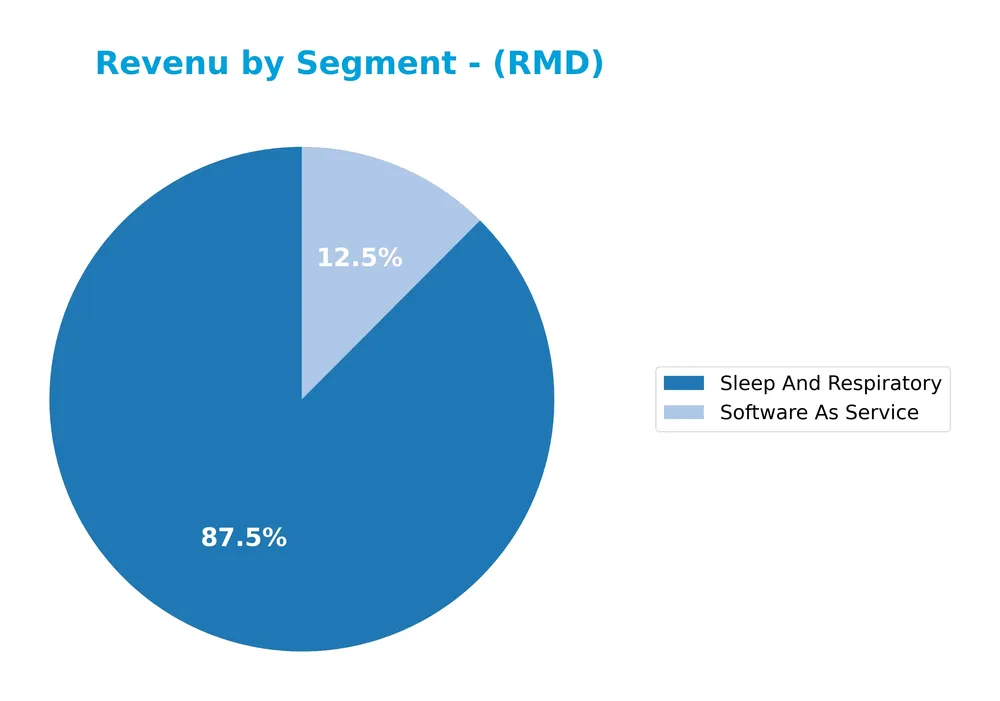
In 2024, ResMed’s revenue is strongly driven by the Sleep And Respiratory segment, which generated $4.1B, showing consistent growth over recent years. The Software As Service segment, at $584M, is also expanding steadily, reflecting the company’s strategic shift towards digital health solutions. Earlier segments like Devices And Masks have been phased out in the latest reports, indicating a consolidation and focus on higher-margin, innovation-led segments.
Key Products & Brands
The table below summarizes ResMed Inc.’s key products and brands along with their descriptions:
| Product | Description |
|---|---|
| Sleep and Respiratory Care | Devices and solutions for respiratory disorders, including ventilation devices, diagnostic products, mask systems, headgear, dental devices, and accessories for hospital and home use. |
| Software as a Service (SaaS) | Cloud-based software applications such as AirView for remote patient monitoring, myAir therapy management app, U-Sleep compliance monitoring, and business management software Brightree, MatrixCare, and HEALTHCAREfirst for healthcare providers. |
ResMed Inc. operates primarily in two segments: Sleep and Respiratory Care, with an extensive portfolio of medical devices and masks, and Software as a Service, offering cloud-based solutions to improve patient outcomes and healthcare management.
Main Competitors
There are 8 competitors in the Healthcare sector for ResMed Inc., with the following top 10 leaders by market capitalization:
| Competitor | Market Cap. |
|---|---|
| Intuitive Surgical, Inc. | 201B |
| Becton, Dickinson and Company | 56B |
| ResMed Inc. | 36B |
| West Pharmaceutical Services, Inc. | 20B |
| Hologic, Inc. | 16.6B |
| The Cooper Companies, Inc. | 16.1B |
| Baxter International Inc. | 10B |
| AptarGroup, Inc. | 8.1B |
ResMed Inc. ranks 3rd among its 8 competitors, with a market cap at 18.35% of the leader, Intuitive Surgical. It stands below the average market cap of the top 10 competitors (45.4B) but above the sector median (18.3B). The company maintains a significant 52.21% gap to the next competitor above, underscoring a solid mid-tier position in the medical instruments and supplies industry.
Comparisons with competitors
Check out how we compare the company to its competitors:
Does RMD have a competitive advantage?
ResMed Inc. presents a clear competitive advantage, demonstrating a very favorable economic moat with a ROIC 11.7% above its WACC and a strong upward trend in profitability over 2021-2025. This indicates efficient capital use, value creation, and a durable competitive position in the medical instruments and software sector.
Looking ahead, ResMed’s future outlook includes expanding its cloud-based software applications and innovative respiratory care products, targeting healthcare providers globally. Continued growth in software as a service and remote patient monitoring solutions offers further market opportunities.
SWOT Analysis
This SWOT analysis highlights ResMed Inc.’s key strategic factors to aid investors in evaluating its potential and risks.
Strengths
- strong revenue growth +61% over 5 years
- high profitability with 27.2% net margin
- durable competitive advantage with growing ROIC
- diversified product portfolio in sleep and respiratory care
- global presence in 140 countries
Weaknesses
- high P/E of 27.0 may limit valuation upside
- price-to-book ratio at 6.34 suggests premium pricing
- dividend yield is low at 0.82%
- current ratio below ideal at 3.44
- reliance on US market for significant revenue share
Opportunities
- expanding cloud-based software and remote monitoring solutions
- growing global demand for sleep apnea and respiratory care devices
- potential for further penetration in emerging markets
- innovation in AI-driven patient management applications
Threats
- regulatory changes in healthcare and device approvals
- competition from established and emerging medical device firms
- potential supply chain disruptions
- pricing pressure from healthcare payers and insurers
ResMed’s strong financial performance and competitive moat position it well for sustainable growth, though valuation and market risks warrant cautious investment. Strategic focus on innovation and geographic expansion can enhance future value creation.
Stock Price Action Analysis
The weekly stock price chart for ResMed Inc. (RMD) over the past 12 months shows notable price movement and volatility:
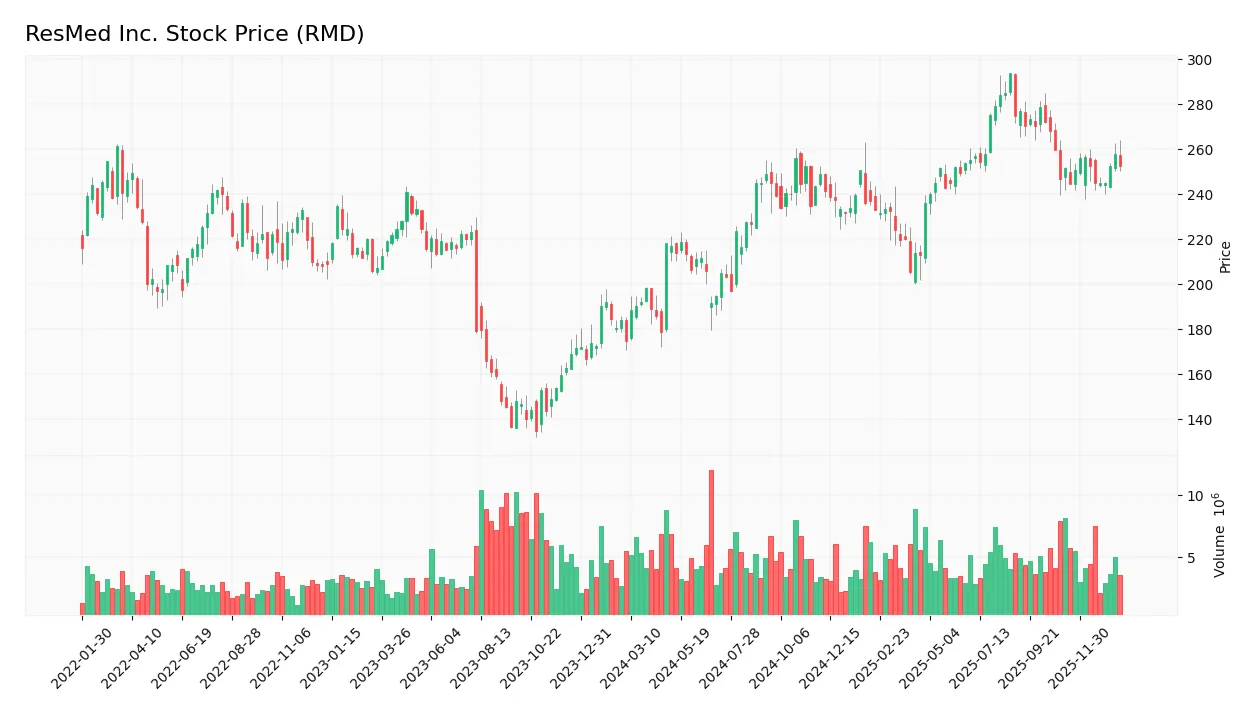
Trend Analysis
Over the past 12 months, ResMed’s stock price increased by 44.54%, indicating a bullish trend. The highest price reached 293.73, with a low of 174.61. Despite the strong upward move, the trend shows signs of deceleration and a high standard deviation of 25.62, reflecting considerable volatility.
Volume Analysis
Trading volume over the last three months is decreasing, with buyer volume at 32.4M and seller volume at 23.3M, reflecting a slightly buyer-dominant market at 58.1%. This suggests moderate investor confidence but reduced overall market participation.
Target Prices
The consensus target prices for ResMed Inc. (RMD) indicate moderate growth expectations.
| Target High | Target Low | Consensus |
|---|---|---|
| 345 | 260 | 294 |
Analysts generally expect the stock to trade between 260 and 345, with a consensus target around 294, reflecting a cautiously optimistic outlook.

Don’t Let Luck Decide Your Entry Point
Optimize your entry points with our advanced ProRealTime indicators. You’ll get efficient buy signals with precise price targets for maximum performance. Start outperforming now!
Analyst & Consumer Opinions
This section examines recent analyst grades and consumer feedback concerning ResMed Inc. (RMD) performance and reputation.
Stock Grades
Here is a summary of recent verified analyst grades for ResMed Inc. from recognized financial institutions:
| Grading Company | Action | New Grade | Date |
|---|---|---|---|
| Stifel | Maintain | Hold | 2025-12-18 |
| Baird | Downgrade | Neutral | 2025-12-16 |
| Baird | Maintain | Outperform | 2025-11-03 |
| RBC Capital | Maintain | Outperform | 2025-10-31 |
| Keybanc | Maintain | Overweight | 2025-10-31 |
| Mizuho | Maintain | Outperform | 2025-10-31 |
| Morgan Stanley | Maintain | Overweight | 2025-10-21 |
| UBS | Maintain | Buy | 2025-08-01 |
| Mizuho | Maintain | Outperform | 2025-08-01 |
| Keybanc | Maintain | Overweight | 2025-08-01 |
Overall, the analyst ratings for ResMed show a stable to slightly cautious stance, with most firms maintaining Outperform, Overweight, or Buy grades, though Baird’s recent downgrade to Neutral is a notable moderation. The consensus remains positive with a “Buy” rating based on 16 buys versus 13 holds and 5 sells.
Consumer Opinions
Consumers have expressed a mixed but generally favorable sentiment towards ResMed Inc., reflecting its strong market presence and product reliability.
| Positive Reviews | Negative Reviews |
|---|---|
| “ResMed’s devices have significantly improved my sleep quality.” | “Customer service response times can be slow.” |
| “The technology is reliable and easy to use.” | “Some products feel overpriced compared to competitors.” |
| “Excellent build quality and durable equipment.” | “Occasional software glitches in the mobile app.” |
| “Helpful instructional materials and support.” | “Limited availability of certain replacement parts.” |
Overall, consumers appreciate ResMed’s product effectiveness and durability, but common concerns include customer service delays and pricing issues, which investors should consider when evaluating the company’s market reputation.
Risk Analysis
Below is a summary table outlining key risks associated with investing in ResMed Inc., including their likelihood and potential impact:
| Category | Description | Probability | Impact |
|---|---|---|---|
| Valuation Risk | Elevated P/E (27.02) and high P/B (6.34) ratios suggest the stock may be overvalued. | Medium | High |
| Market Volatility | Beta of 0.876 indicates moderate sensitivity to market fluctuations affecting stock price. | Medium | Medium |
| Competitive Risk | Intense competition in medical devices and software for respiratory care could pressure margins. | Medium | Medium |
| Regulatory Risk | Healthcare regulations and reimbursement changes may impact sales and profitability. | Medium | High |
| Technological Risk | Rapid innovation demands continuous R&D investment; failure to innovate could reduce market share. | Medium | Medium |
| Operational Risk | Supply chain disruptions or manufacturing delays can affect product availability. | Low | Medium |
| Product Liability | Potential legal exposure from device failures or adverse patient outcomes. | Low | High |
The most significant risks for ResMed are valuation concerns due to elevated price multiples and regulatory changes impacting healthcare markets. Despite a strong Altman Z-score (13.11, safe zone) and solid Piotroski score (7, strong), investors should monitor market conditions and regulatory updates closely to manage downside risks effectively.
Should You Buy ResMed Inc.?
ResMed Inc. appears to be exhibiting robust profitability with a durable competitive moat supported by a very favorable growing ROIC trend. While the leverage profile seems manageable, valuation metrics suggest moderate caution, resulting in an overall A- rating that could be seen as favorable for investors.
Strength & Efficiency Pillars
ResMed Inc. (RMD) exhibits robust profitability with a net margin of 27.22% and a return on equity (ROE) of 23.47%, underscoring efficient capital use. Its return on invested capital (ROIC) stands at 19.56%, significantly above the weighted average cost of capital (WACC) at 7.86%, confirming that the company is a clear value creator. Financial health is solid, evidenced by an Altman Z-Score of 13.11, well within the safe zone, and a strong Piotroski score of 7, signaling sound fundamentals and low bankruptcy risk. These factors collectively indicate durable operational efficiency and competitive advantage.
Weaknesses and Drawbacks
Despite its strengths, ResMed’s valuation metrics present cautionary signals. The price-to-earnings (P/E) ratio is elevated at 27.02, suggesting a premium valuation that may limit upside. More concerning is the price-to-book (P/B) ratio of 6.34, marked as very unfavorable, indicating that the stock price far exceeds book value and may be overvalued relative to its net assets. The current ratio is at 3.44, flagged unfavorable, potentially reflecting inefficient asset utilization or excess liquidity. Dividend yield is low at 0.82%, which might deter income-focused investors. These factors introduce valuation risk and warrant careful consideration.
Our Verdict about ResMed Inc.
ResMed’s long-term fundamental profile is favorable, highlighted by strong profitability, value creation, and financial stability. The bullish overall stock trend, coupled with a slightly buyer-dominant recent period (58.1% buyer volume), suggests sustained investor interest. Given the premium valuation and moderate financial leverage, the profile might appear attractive for long-term exposure but could also suggest a need for cautious entry timing to optimize risk-reward balance.
Disclaimer: This content is for informational purposes only and does not constitute financial, investment, or other professional advice. Investing in financial markets involves a significant risk of loss, and past performance is not indicative of future results.
Additional Resources
- ResMed Inc.’s (NYSE:RMD) Stock Has Fared Decently: Is the Market Following Strong Financials? – Yahoo Finance (Jan 24, 2026)
- Wealth Enhancement Advisory Services LLC Raises Stake in ResMed Inc. $RMD – MarketBeat (Jan 24, 2026)
- ResMed (RMD) Earnings Expected to Grow: What to Know Ahead of Next Week’s Release – Finviz (Jan 22, 2026)
- Vest Financial LLC Makes New Investment in ResMed Inc. $RMD – MarketBeat (Jan 22, 2026)
- Universal Beteiligungs und Servicegesellschaft mbH Buys 6,991 Shares of ResMed Inc. $RMD – MarketBeat (Jan 23, 2026)
For more information about ResMed Inc., please visit the official website: resmed.com