Home > Analyses > Financial Services > Regions Financial Corporation
Regions Financial Corporation powers everyday financial decisions for millions across the South, Midwest, and Texas. Its comprehensive banking services—from commercial loans to wealth management—cement its role as a regional powerhouse. Known for robust client relationships and steady innovation, Regions blends traditional banking with modern financial solutions. As 2026 unfolds, I examine whether its solid footprint and diversified segments support sustainable growth and justify current market valuations.

Table of contents
Business Model & Company Overview
Regions Financial Corporation, founded in 1971 and headquartered in Birmingham, Alabama, stands as a dominant regional bank with a cohesive ecosystem spanning Corporate Bank, Consumer Bank, and Wealth Management. Its 1,300 offices and 2,000 ATMs serve the South, Midwest, and Texas, offering integrated banking and advisory services that meet both individual and corporate needs.
The company’s revenue engine balances commercial loans, consumer credit, and wealth management fees across the Americas. This diversified model extends through deposits, mortgage lending, and investment products, anchored by a strategic footprint in key U.S. markets. Regions’ competitive advantage lies in its broad service mix and deep regional presence, defining its role in shaping the future of regional banking.
Financial Performance & Fundamental Metrics
I analyze Regions Financial Corporation’s income statement, key financial ratios, and dividend payout policy to assess its core financial health and shareholder value.
Income Statement
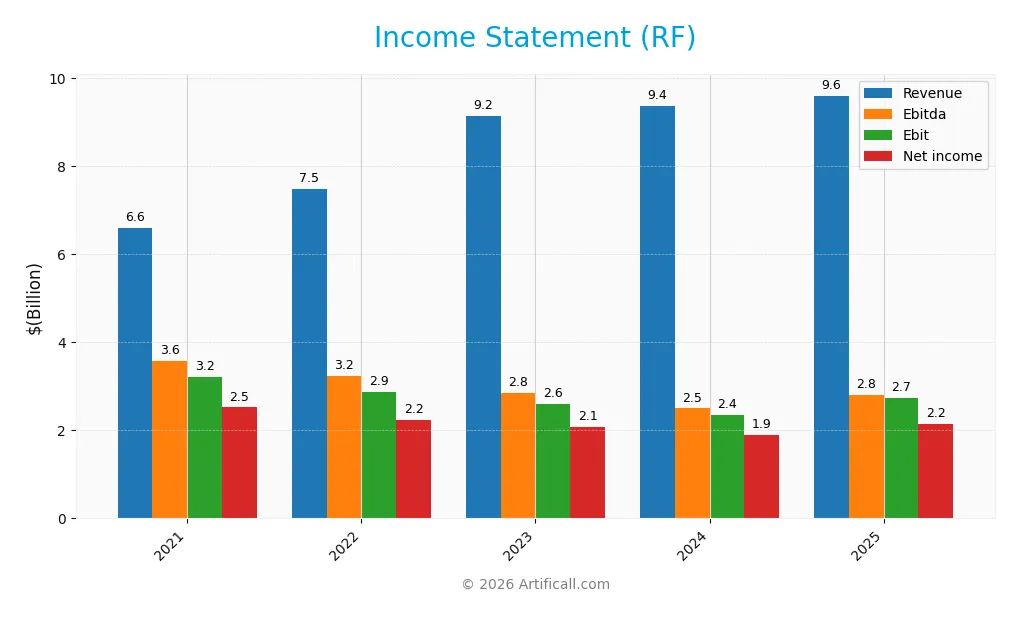
The table below presents Regions Financial Corporation’s key income statement figures for fiscal years 2021 through 2025, reflecting revenue, expenses, profits, and earnings per share.
| 2021 | 2022 | 2023 | 2024 | 2025 | |
|---|---|---|---|---|---|
| Revenue | 6.6B | 7.5B | 9.2B | 9.4B | 9.6B |
| Cost of Revenue | -357M | 587M | 2.1B | 2.8B | 2.4B |
| Operating Expenses | 3.7B | 4.0B | 4.4B | 4.2B | 4.4B |
| Gross Profit | 7.0B | 6.9B | 7.0B | 6.6B | 7.2B |
| EBITDA | 3.6B | 3.2B | 2.8B | 2.5B | 2.8B |
| EBIT | 3.2B | 2.9B | 2.6B | 2.4B | 2.7B |
| Interest Expense | 167M | 316M | 1.6B | 2.3B | 2.1B |
| Net Income | 2.5B | 2.2B | 2.1B | 1.9B | 2.2B |
| EPS | 2.51 | 2.30 | 2.11 | 1.94 | 2.31 |
| Filing Date | 2022-02-24 | 2023-02-24 | 2024-02-23 | 2025-02-21 | 2026-02-24 |
Income Statement Evolution
Regions Financial Corporation’s revenue rose steadily by 45.5% from 2021 to 2025, but growth slowed to 2.5% in the last year. Gross profit increased by 8.7% in 2025, reflecting improved cost control. EBIT expanded 16.5%, supporting a higher net margin of 22.4%, despite a notable decline in net margin and EPS over the full period.
Is the Income Statement Favorable?
In 2025, fundamentals appear generally favorable. The gross margin stands strong at 74.6%, and EBIT margin at 28.6%, both healthy for the financial sector. However, a 21.7% interest expense ratio raises caution. Net income grew 11.1%, and EPS surged 18.7%, indicating operational efficiency gains despite slower revenue growth.
Financial Ratios
The table below summarizes key financial ratios for Regions Financial Corporation (RF) over the last five fiscal years, providing a snapshot of profitability, valuation, liquidity, leverage, and efficiency:
| Ratios | 2021 | 2022 | 2023 | 2024 | 2025 |
|---|---|---|---|---|---|
| Net Margin | 38% | 30% | 23% | 20% | 22% |
| ROE | 14% | 14% | 12% | 11% | 11% |
| ROIC | 11% | 10% | 8% | 6% | 14% |
| P/E | 8.3x | 9.0x | 8.7x | 11.4x | 11.0x |
| P/B | 1.14x | 1.26x | 1.04x | 1.21x | 1.25x |
| Current Ratio | 0.42 | 0.30 | 0.28 | 0.27 | 0.30 |
| Quick Ratio | 0.42 | 0.30 | 0.28 | 0.27 | 0.30 |
| D/E | 0.13 | 0.14 | 0.13 | 0.36 | 0.26 |
| Debt-to-Assets | 1.5% | 1.5% | 1.5% | 4.1% | 3.1% |
| Interest Coverage | 19.3x | 9.1x | 1.7x | 1.0x | 1.3x |
| Asset Turnover | 0.04 | 0.05 | 0.06 | 0.06 | 0.06 |
| Fixed Asset Turnover | 3.6x | 4.4x | 5.6x | 5.6x | 5.8x |
| Dividend Yield | 3.4% | 3.8% | 4.9% | 4.6% | 3.8% |
Evolution of Financial Ratios
Regions Financial Corporation’s Return on Equity (ROE) showed moderate stability, ending at 11.3% in 2025. The Current Ratio remained consistently low around 0.3, indicating persistent liquidity constraints. Debt-to-Equity Ratio improved, declining to 0.26, signaling a more conservative leverage stance. Profitability margins, including net margin, held steady with slight improvement, reflecting controlled expense management.
Are the Financial Ratios Favorable?
The 2025 ratios reveal a generally favorable financial profile. Profitability metrics such as net margin (22.4%) and ROIC (13.8%) outperform the weighted average cost of capital (12.6%), indicating value creation. Liquidity ratios (current and quick at 0.3) are unfavorable, posing potential short-term risk. Leverage is well-managed with a debt-to-equity ratio at 0.26. Market valuation ratios like P/E (11.0) and P/B (1.25) are attractive, supporting a positive overall assessment.
Shareholder Return Policy
Regions Financial Corporation maintains a dividend payout ratio near 42%, with dividends per share rising steadily to $1.04 in 2025. The 3.8% annual dividend yield is supported by free cash flow coverage, while share buybacks also contribute to shareholder returns.
This balance of dividends and buybacks reflects a disciplined distribution approach, supporting sustainable long-term value creation. Dividend increases align with net income growth, limiting risks of over-distribution or excessive buybacks.
Score analysis
The following radar chart illustrates key financial scores evaluating Regions Financial Corporation’s valuation and profitability metrics:
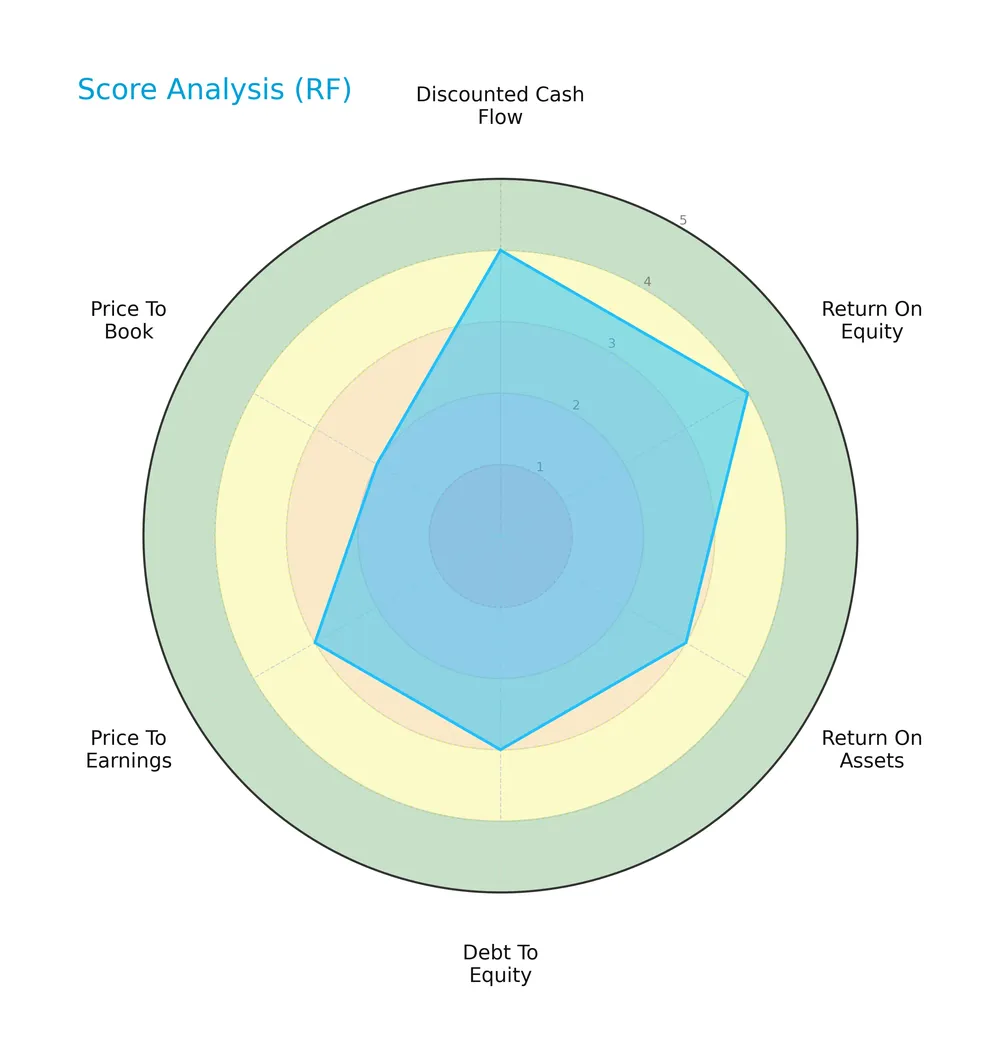
Regions Financial shows favorable scores in discounted cash flow and return on equity at 4 each. Return on assets, debt to equity, and price to earnings scores hold moderate values of 3. Price to book lags with an unfavorable score of 2.
Analysis of the company’s bankruptcy risk
Regions Financial’s Altman Z-Score places it in the distress zone, signaling a significant risk of financial distress and potential bankruptcy:

Is the company in good financial health?
The Piotroski F-Score diagram highlights the company’s strong financial health based on nine key criteria:

With a perfect Piotroski Score of 9, Regions Financial demonstrates very strong financial fundamentals, suggesting robust profitability, liquidity, and operational efficiency.
Competitive Landscape & Sector Positioning
This section examines Regions Financial Corporation’s strategic positioning, revenue streams, and key products within the regional banking sector. I will assess its main competitors and evaluate whether Regions holds a competitive advantage in its market environment.
Strategic Positioning
Regions Financial Corporation focuses on a diversified banking model across Consumer Bank, Corporate Bank, and Wealth Management segments. It operates predominantly in the US South, Midwest, and Texas, balancing retail and commercial services with growing wealth management revenues, reflecting a broad but regionally concentrated footprint.
Revenue by Segment
This pie chart displays Regions Financial Corporation’s revenue distribution across key segments for the fiscal year 2023.
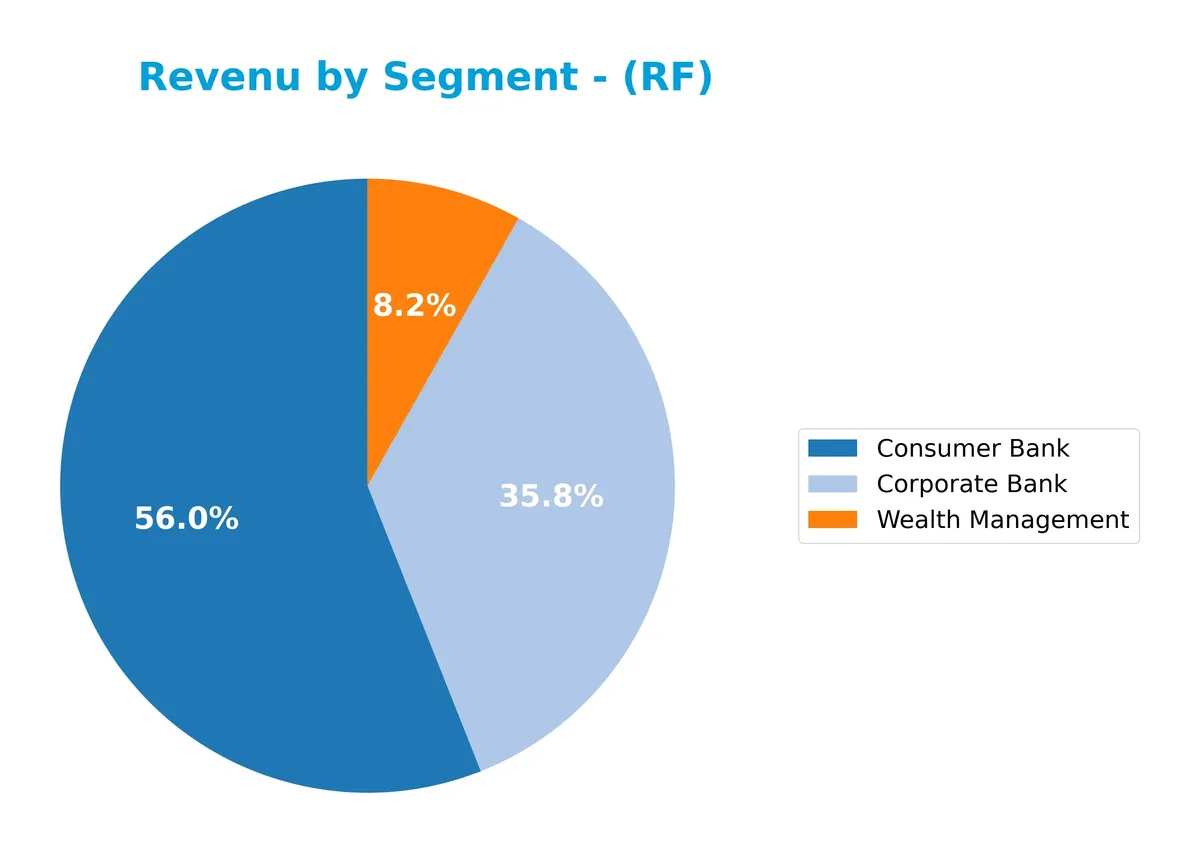
Consumer Bank leads with $3.1B, followed by Corporate Bank at $2B, and Wealth Management at $457M. The Consumer Bank segment shows strong growth, reflecting a sustained focus on retail banking. Corporate Bank revenue also edges higher, confirming steady commercial client demand. Wealth Management grows modestly, maintaining its role as a niche but stable contributor. The revenue concentration remains balanced, reducing single-segment risk.
Key Products & Brands
Regions Financial Corporation generates revenue through diverse banking and financial service segments:
| Product | Description |
|---|---|
| Consumer Bank | Offers residential mortgages, home equity loans, consumer credit cards, other consumer loans, and deposits. |
| Corporate Bank | Provides commercial lending, equipment leasing, securities underwriting, loan syndication, and advisory services. |
| Wealth Management | Delivers credit products, retirement and savings solutions, trust and investment management, and estate planning. |
Regions relies heavily on its Consumer Bank segment, which leads revenue generation, supported by robust Corporate Bank and Wealth Management services. This diversified approach addresses both individual and corporate client needs.
Main Competitors
There are 9 competitors in total, with the table below showing the top 9 leaders by market capitalization:
| Competitor | Market Cap. |
|---|---|
| U.S. Bancorp | 83.8B |
| The PNC Financial Services Group, Inc. | 82.9B |
| Truist Financial Corporation | 64.6B |
| Fifth Third Bancorp | 31.5B |
| M&T Bank Corporation | 31.4B |
| Huntington Bancshares Incorporated | 25.5B |
| Citizens Financial Group, Inc. | 25.5B |
| Regions Financial Corporation | 24.9B |
| KeyCorp | 22.9B |
Regions Financial Corporation ranks 8th among its peers with a market cap at 29.75% of the leader, U.S. Bancorp. It sits below both the average market cap of the top 10 (43.7B) and the sector median (31.4B). The company maintains a narrow 2.28% gap above its closest competitor, Citizens Financial Group, underscoring its tight competitive positioning in regional banks.
Comparisons with competitors
Check out how we compare the company to its competitors:
Does RF have a competitive advantage?
Regions Financial Corporation does not currently demonstrate a clear competitive advantage, as its ROIC remains below WACC, indicating value shedding despite a growing profitability trend. The company’s income statement shows a favorable gross margin of 74.64% and net margin of 22.44%, but interest expense at 21.67% signals cost pressures.
Looking ahead, Regions benefits from diversified operations across Corporate Bank, Consumer Bank, and Wealth Management segments, supporting steady revenue growth of 2.51% in 2025. Expansion opportunities exist in its Southern, Midwest, and Texas markets through new banking products and wealth management services.
SWOT Analysis
This SWOT analysis highlights Regions Financial Corporation’s key internal and external factors to guide strategic decisions.
Strengths
- strong gross margin at 74.64%
- favorable EBIT margin of 28.55%
- very strong Piotroski Score of 9
Weaknesses
- low current ratio at 0.3 signals liquidity risk
- interest coverage at 1.32 is weak
- net income declined over the period
Opportunities
- expanding revenue with 45.5% growth since 2021
- growing ROIC trend indicates improving profitability
- dividend yield attractive at 3.85%
Threats
- high interest expense ratio at 21.67%
- pressure from rising WACC at 12.58%
- economic downturn risks impacting regional banks
Regions Financial shows solid profitability and operational strengths but faces liquidity and leverage challenges. Strategic focus should enhance liquidity buffers while leveraging growth in revenue and ROIC to build a durable competitive position.
Stock Price Action Analysis
The weekly chart below illustrates Regions Financial Corporation’s stock price movements and volatility over the last 12 months:
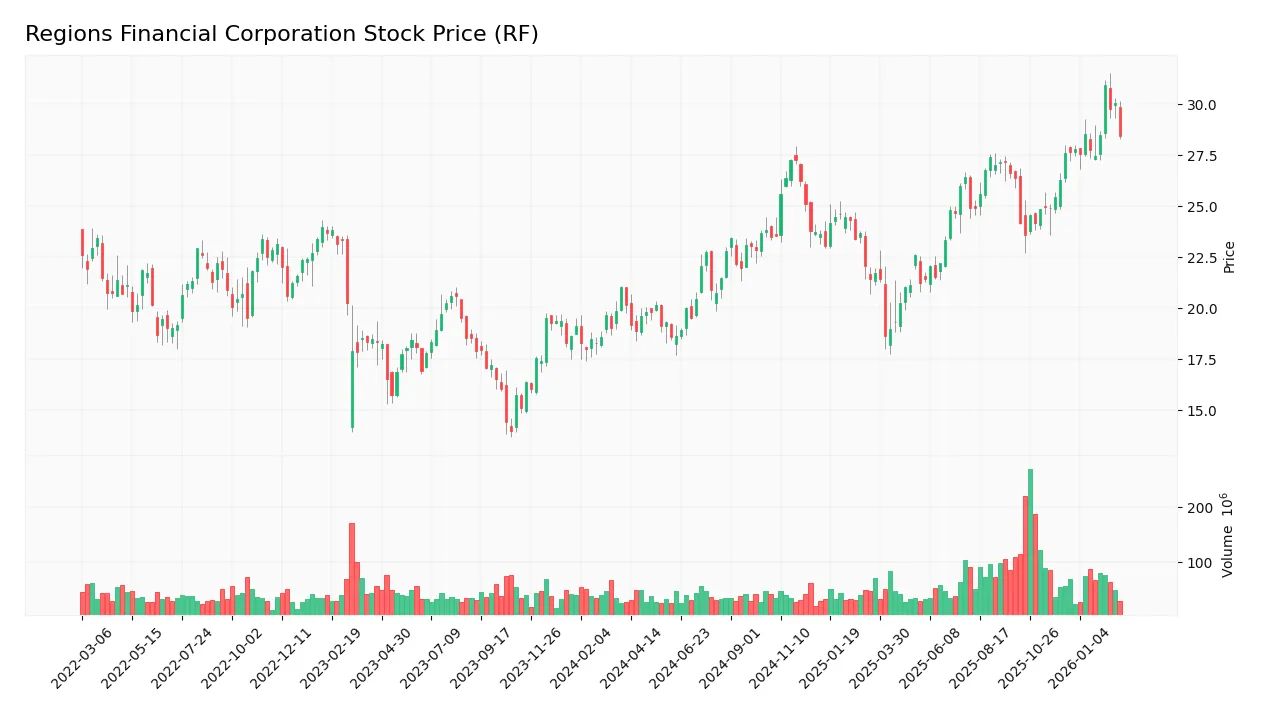
Trend Analysis
Over the past year, RF’s stock price surged 41.14%, confirming a bullish trend with accelerating momentum. The price ranged between 18.6 and 30.93, with volatility at a standard deviation of 2.97. In the recent three-month span, the price gained 3.04%, maintaining a mild upward slope and lower volatility of 1.09.
Volume Analysis
Trading volume for RF is increasing, with a total volume of 6.35B shares and buyers controlling 55.53%. In the recent period, buyer dominance strengthened to 60.87%, reflecting buyer-driven activity and growing investor confidence over the last three months.
Target Prices
Analysts present a moderately bullish consensus on Regions Financial Corporation.
| Target Low | Target High | Consensus |
|---|---|---|
| 27 | 32 | 29.9 |
The target range suggests steady upside potential, reflecting confidence in the bank’s recovery and growth prospects amid evolving interest rate environments.

Don’t Let Luck Decide Your Entry Point
Optimize your entry points with our advanced ProRealTime indicators. You’ll get efficient buy signals with precise price targets for maximum performance. Start outperforming now!
Analyst & Consumer Opinions
I will analyze Regions Financial Corporation’s grades and consumer feedback to provide a balanced view of its market perception.
Stock Grades
Here is the latest summary of stock grades from recognized financial institutions for Regions Financial Corporation:
| Grading Company | Action | New Grade | Date |
|---|---|---|---|
| JP Morgan | Maintain | Neutral | 2026-02-09 |
| Wells Fargo | Maintain | Underweight | 2026-01-20 |
| Keefe, Bruyette & Woods | Downgrade | Market Perform | 2026-01-20 |
| Piper Sandler | Maintain | Neutral | 2026-01-20 |
| Wells Fargo | Downgrade | Underweight | 2026-01-16 |
| Evercore ISI Group | Downgrade | Underperform | 2026-01-06 |
| Barclays | Maintain | Underweight | 2026-01-05 |
| Truist Securities | Maintain | Hold | 2025-12-22 |
| Keefe, Bruyette & Woods | Maintain | Outperform | 2025-12-17 |
| Truist Securities | Maintain | Hold | 2025-10-20 |
The overall trend shows a cautious stance with several downgrades and a cluster of maintained neutral to underweight ratings. Notably, Keefe, Bruyette & Woods recently lowered its grade from Outperform to Market Perform, indicating tempered optimism.
Consumer Opinions
Consumers express mixed feelings about Regions Financial Corporation, reflecting varied experiences across service and digital platforms.
| Positive Reviews | Negative Reviews |
|---|---|
| Responsive customer service with helpful staff | Long wait times during peak hours |
| Convenient mobile app with useful features | Occasional glitches in online banking |
| Competitive loan rates and flexible terms | Limited branch availability in some areas |
| Transparent fee structure and clear communication | Some customers report issues with dispute resolution |
Overall, customers appreciate Regions Financial’s service quality and digital tools. However, recurring complaints about wait times and app reliability suggest room for operational improvements.
Risk Analysis
Below is a summary table outlining key risks for Regions Financial Corporation (RF) in 2026:
| Category | Description | Probability | Impact |
|---|---|---|---|
| Liquidity Risk | Very low current and quick ratios (0.3) signal weak short-term liquidity | High | High |
| Financial Distress | Altman Z-score in distress zone (-0.38) indicates bankruptcy risk | Moderate | Very High |
| Interest Coverage | Low interest coverage ratio (1.32) raises concerns over debt costs | Moderate | Medium |
| Asset Efficiency | Low asset turnover (0.06) suggests poor utilization of assets | Moderate | Medium |
| Market Volatility | Beta near 1.03 implies stock moves roughly with the market | High | Medium |
Liquidity challenges pose the most immediate threat, potentially constraining operational flexibility. The distressed Altman Z-score is alarming, signaling heightened bankruptcy risk despite a very strong Piotroski score. I remain cautious given these conflicting signals and advise close monitoring.
Should You Buy Regions Financial Corporation?
Regions Financial Corporation appears to be improving profitability with growing ROIC but shows signs of shedding value relative to WACC. Despite a manageable leverage profile, the company’s liquidity metrics raise caution. Its B+ rating suggests a very favorable, yet moderately balanced, investment profile.
Strength & Efficiency Pillars
Regions Financial Corporation delivers solid operational margins, with a gross margin of 74.64% and net margin at 22.44%, underscoring efficient cost management. The return on invested capital (ROIC) stands at 13.79%, exceeding the weighted average cost of capital (WACC) of 12.58%, signaling that the company remains a value creator despite a slight margin pressure from interest expenses. While the return on equity (ROE) is moderate at 11.32%, the firm shows a positive ROIC growth trend of over 30%, indicating improving profitability over time. These metrics reflect a company gradually enhancing its operational efficiency.
Weaknesses and Drawbacks
Regions Financial is currently in the distress zone, with an Altman Z-Score of -0.38, indicating a high bankruptcy risk that overshadows other financial strengths. This solvency red flag takes precedence over its favorable margins and ROIC. Additionally, liquidity ratios are critically weak, with a current ratio of 0.3 and quick ratio equally low, suggesting potential short-term cash flow challenges. Interest coverage is marginal at 1.32, highlighting vulnerability to debt servicing costs. Although the price-to-earnings (11.0) and price-to-book (1.25) ratios appear reasonable, the financial distress and liquidity concerns impose significant risk for investors.
Our Final Verdict about Regions Financial Corporation
Despite operational efficiency and a strong Piotroski score of 9 indicating robust underlying fundamentals, the company’s Altman Z-Score of -0.38 places it in the distress zone. This solvency risk makes the equity highly speculative and too risky for conservative capital. Investors might consider waiting for clearer signs of financial stabilization before committing capital, as the current profile suggests elevated risk despite improving profitability metrics.
Disclaimer: This content is for informational purposes only and does not constitute financial, investment, or other professional advice. Investing in financial markets involves a significant risk of loss, and past performance is not indicative of future results.
Additional Resources
- Regions Financial (RF): Buy, Sell, or Hold Post Q4 Earnings? – Finviz (Feb 25, 2026)
- REGIONS FINANCIAL CORP SEC 10-K Report – TradingView (Feb 24, 2026)
- Decoding Regions Financial Corp (RF): A Strategic SWOT Insight – GuruFocus (Feb 25, 2026)
- Here’s What the Street Thinks About Regions Financial Corporation (RF) – Yahoo Finance (Feb 20, 2026)
- A Look At Regions Financial (RF) Valuation As Analyst Upgrades Follow Missed Estimates And Dividend Growth – simplywall.st (Feb 24, 2026)
For more information about Regions Financial Corporation, please visit the official website: regions.com