Home > Analyses > Healthcare > Regeneron Pharmaceuticals, Inc.
Regeneron Pharmaceuticals transforms lives through breakthrough therapies that tackle some of the most challenging diseases. As a biotech powerhouse, Regeneron commands a robust portfolio, including EYLEA for eye disorders and Dupixent for inflammatory conditions, underpinned by relentless innovation. Its strategic collaborations amplify its research capabilities, reinforcing industry leadership. Yet, as the biotech sector evolves, I ask: do Regeneron’s fundamentals sustain its premium valuation and promise for future growth?

Table of contents
Business Model & Company Overview
Regeneron Pharmaceuticals, Inc., founded in 1988 and based in Tarrytown, NY, dominates the biotechnology sector with a mission to discover and develop innovative medicines. Its portfolio forms a robust ecosystem addressing eye diseases, inflammatory conditions, cancers, and rare illnesses. This integrated approach positions Regeneron as a leader in therapeutic innovation with a global footprint.
The company generates value through a balanced mix of patented biologics and cutting-edge treatments, including injections like EYLEA and Dupixent. Its strategic collaborations with global pharma giants amplify its reach across the Americas, Europe, and Asia. Regeneron’s strong economic moat lies in its proprietary drug pipeline and deep scientific expertise, shaping the future of biopharmaceuticals.
Financial Performance & Fundamental Metrics
I analyze Regeneron Pharmaceuticals’ income statement, key financial ratios, and dividend payout policy to assess its core financial health and shareholder returns.
Income Statement
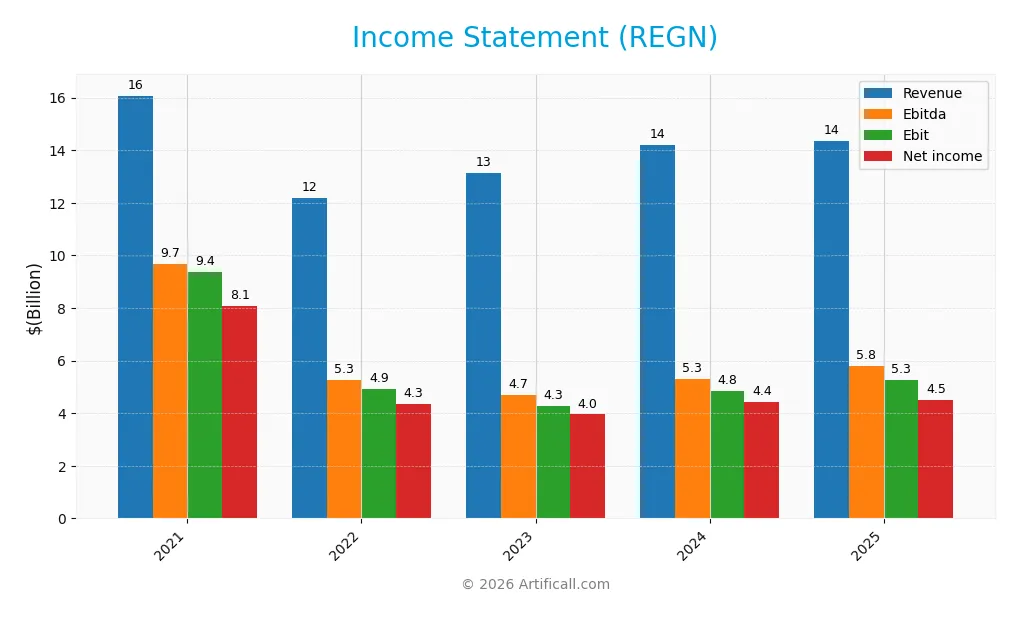
The table below summarizes Regeneron Pharmaceuticals, Inc.’s key income statement figures for fiscal years 2021 through 2025, reported in USD.
| 2021 | 2022 | 2023 | 2024 | 2025 | |
|---|---|---|---|---|---|
| Revenue | 16.1B | 12.2B | 13.1B | 14.2B | 14.3B |
| Cost of Revenue | 2.7B | 1.7B | 2.2B | 2.0B | 2.0B |
| Operating Expenses | 4.4B | 5.1B | 6.5B | 8.2B | 8.7B |
| Gross Profit | 13.3B | 10.5B | 10.9B | 12.2B | 12.4B |
| EBITDA | 9.7B | 5.3B | 4.7B | 5.3B | 5.8B |
| EBIT | 9.4B | 4.9B | 4.3B | 4.8B | 5.3B |
| Interest Expense | 57M | 59M | 73M | 55M | 44M |
| Net Income | 8.1B | 4.3B | 4.0B | 4.4B | 4.5B |
| EPS | 76.4 | 40.5 | 37.1 | 40.9 | 43.1 |
| Filing Date | 2022-02-07 | 2023-02-06 | 2024-02-05 | 2025-02-05 | 2026-02-04 |
Income Statement Evolution
Regeneron’s revenue edged up slightly by 1% in 2025, slowing after notable declines over 2021-2025. Net income grew modestly by 2%, yet margins remain strong. Gross margin held steady near 86%, while EBIT margin improved to 36.8%, reflecting disciplined cost control despite moderate revenue growth.
Is the Income Statement Favorable?
In 2025, fundamentals appear generally neutral. The firm maintains a robust net margin of 31.4% and a favorable EBIT margin, signaling operational efficiency. However, revenue growth under 1% and stagnant gross profit growth temper optimism. Interest expense remains low at 0.31% of revenue, supporting stable profitability amid a challenging growth environment.
Financial Ratios
The table below summarizes key financial ratios for Regeneron Pharmaceuticals, Inc. from 2021 to 2025, highlighting profitability, valuation, liquidity, leverage, and efficiency metrics:
| Ratios | 2021 | 2022 | 2023 | 2024 | 2025 |
|---|---|---|---|---|---|
| Net Margin | 50.2% | 35.6% | 30.1% | 31.1% | 31.4% |
| ROE | 43.0% | 19.1% | 15.2% | 15.0% | 14.4% |
| ROIC | 34.9% | 18.4% | 13.8% | 10.9% | 9.2% |
| P/E | 8.3 | 17.8 | 23.7 | 17.4 | 17.9 |
| P/B | 3.56 | 3.41 | 3.61 | 2.62 | 2.58 |
| Current Ratio | 3.56 | 5.06 | 5.69 | 4.73 | 4.77 |
| Quick Ratio | 3.07 | 4.29 | 4.94 | 3.95 | 4.22 |
| D/E | 0.14 | 0.12 | 0.10 | 0.09 | 0.09 |
| Debt-to-Assets | 10.6% | 9.2% | 8.2% | 7.2% | 6.7% |
| Interest Coverage | 156.1x | 90.7x | 59.6x | 72.3x | 84.3x |
| Asset Turnover | 0.63 | 0.42 | 0.40 | 0.38 | 0.35 |
| Fixed Asset Turnover | 4.62 | 3.23 | 3.16 | 3.09 | 2.80 |
| Dividend Yield | 0.0% | 0.0% | 0.0% | 0.0% | 0.46% |
Evolution of Financial Ratios
Return on Equity (ROE) showed moderate stability, easing from 19.14% in 2022 to 14.41% in 2025. The Current Ratio remained elevated, fluctuating around 4.7 to 5.7, signaling strong liquidity but potential inefficiency. Debt-to-Equity steadily declined from 0.14 in 2021 to 0.09 in 2025, reflecting reduced financial leverage and risk.
Are the Financial Ratios Fovorable?
Profitability margins remain favorable with a 31.41% net margin, while ROE and ROIC align neutrally relative to sector norms. Liquidity ratios present mixed signals: a high Current Ratio is unfavorable, but the Quick Ratio is favorable. Debt levels are low and well-covered by interest earnings. Asset turnover is below ideal, and dividend yield is minimal, suggesting cautious efficiency and return to shareholders. Overall, ratios lean slightly favorable.
Shareholder Return Policy
Regeneron Pharmaceuticals initiated dividend payments in 2025, with a payout ratio near 8.2% and a yield of 0.46%. The dividend per share rose to $3.54, supported by strong free cash flow and moderate capital expenditures. The company also engages in share buybacks, enhancing shareholder returns.
This measured distribution approach balances income with reinvestment capacity. The low payout ratio and coverage by free cash flow suggest sustainability. Share buybacks complement dividends, potentially supporting long-term shareholder value without compromising financial flexibility.
Score analysis
Here is a comprehensive view of Regeneron Pharmaceuticals’ key valuation and financial health metrics:
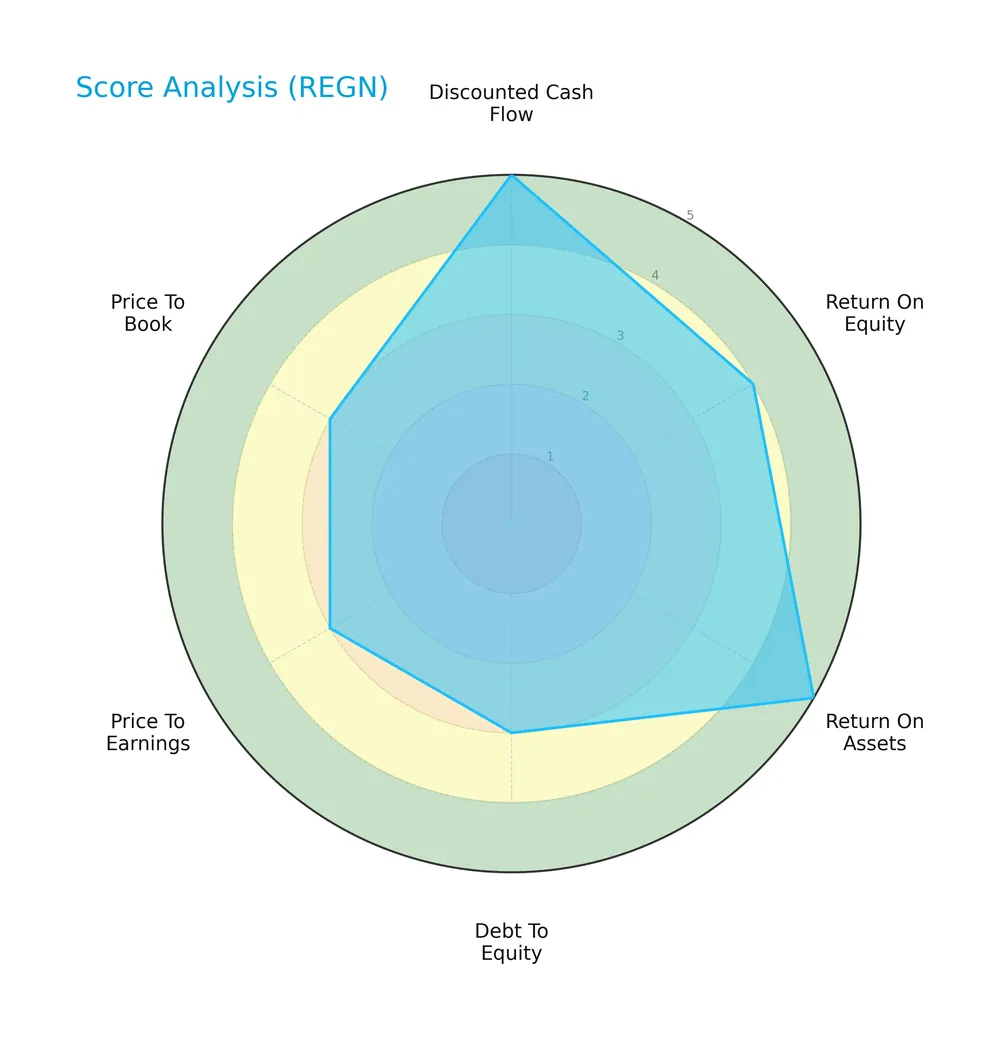
The company scores very favorably on discounted cash flow and return on assets, indicating strong operational efficiency. Return on equity is favorable. Debt-to-equity, price-to-earnings, and price-to-book ratios show moderate ratings, suggesting balanced leverage and valuation levels.
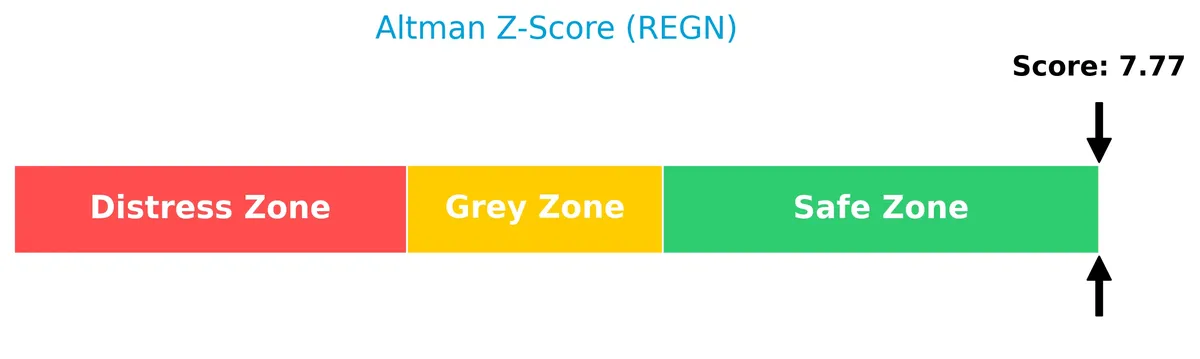
Analysis of the company’s bankruptcy risk
Regeneron’s Altman Z-Score places it well within the safe zone, signaling low risk of bankruptcy and strong financial stability:
Is the company in good financial health?
The Piotroski Score diagram shows an average financial health status for the company:
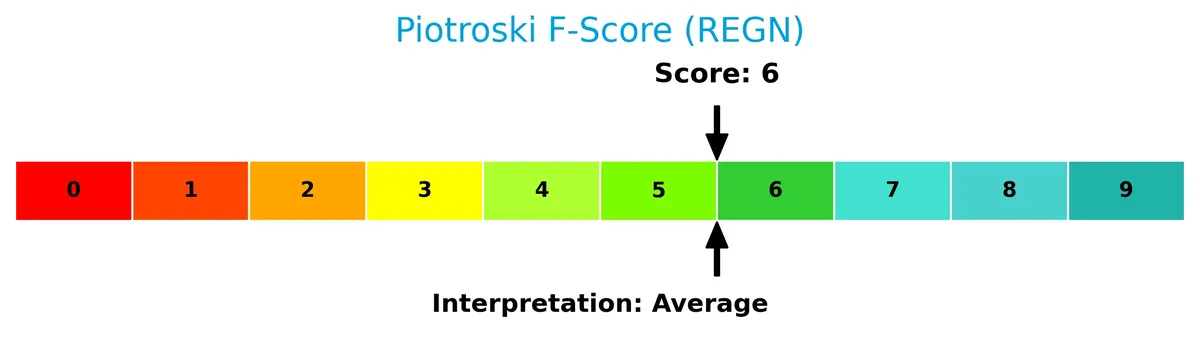
With a Piotroski Score of 6, Regeneron demonstrates moderate financial strength, reflecting decent profitability and efficiency but room for improvement in some areas.
Competitive Landscape & Sector Positioning
This analysis explores Regeneron Pharmaceuticals’ strategic positioning, revenue streams, and competitor dynamics. I will assess whether Regeneron holds a competitive advantage within the biotechnology sector.
Strategic Positioning
Regeneron Pharmaceuticals concentrates its revenue primarily on biopharmaceutical products, with collaboration agreements contributing significantly. Its geographic exposure is heavily US-centric, generating over 4.3B domestically versus 0.5B internationally, reflecting a focused yet collaborative growth approach.
Revenue by Segment
The pie chart displays Regeneron Pharmaceuticals’ revenue breakdown by segment for the fiscal year 2025, highlighting the company’s income sources and their relative importance.
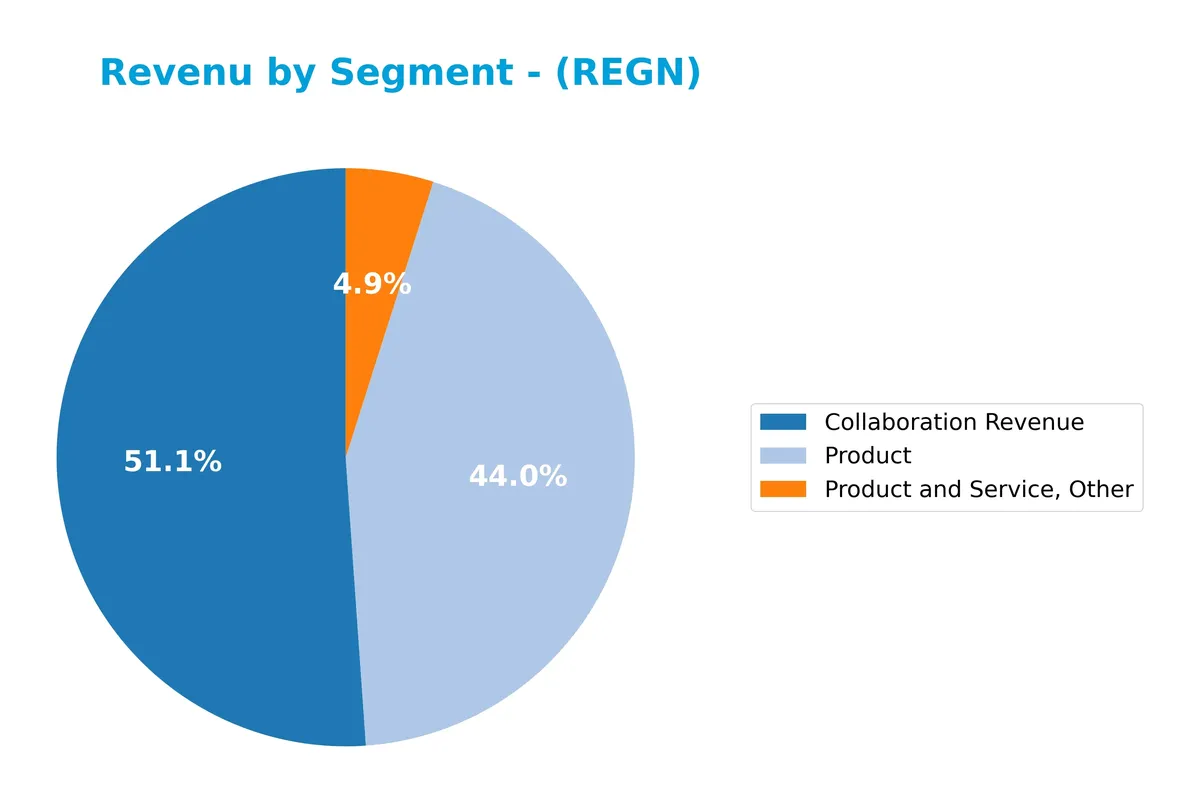
In 2025, Collaboration Revenue reached 7.3B, surpassing Product sales at 6.3B, signaling a shift toward partnership-driven growth. The Product and Service, Other segment contributed 700M, a modest share. Collaboration deals now drive a larger portion of revenues, reflecting Regeneron’s strategic emphasis on alliances. This dynamic contrasts with prior years when Product sales dominated, indicating evolving concentration risks and opportunities.
Key Products & Brands
The table below outlines Regeneron Pharmaceuticals’ primary products and their descriptions:
| Product | Description |
|---|---|
| EYLEA Injection | Treats wet age-related macular degeneration, diabetic macular edema, myopic choroidal neovascularization, and retinal vein occlusion. |
| Dupixent Injection | Used for atopic dermatitis and asthma in adults and pediatric patients. |
| Libtayo Injection | Treats metastatic or locally advanced cutaneous squamous cell carcinoma. |
| Praluent Injection | Manages heterozygous familial hypercholesterolemia and clinical atherosclerotic cardiovascular disease in adults. |
| REGEN-COV | Therapeutic for COVID-19 infection. |
| Kevzara Solution | Treats rheumatoid arthritis in adults. |
| Inmazeb Injection | Used for infection caused by Zaire ebolavirus. |
| ARCALYST Injection | Treats cryopyrin-associated periodic syndromes, including familial cold auto-inflammatory syndrome and Muckle-Wells syndrome. |
| ZALTRAP Injection | Administered intravenously to treat metastatic colorectal cancer. |
Regeneron focuses on innovative medicines across eye diseases, immunology, oncology, infectious diseases, and rare conditions. Its portfolio combines established therapies with expanding collaborations.
Main Competitors
The sector includes 5 competitors, with the table below listing the top 10 leaders by market capitalization:
| Competitor | Market Cap. |
|---|---|
| Vertex Pharmaceuticals Incorporated | 116B |
| Regeneron Pharmaceuticals, Inc. | 80B |
| Incyte Corporation | 20B |
| Moderna, Inc. | 12B |
| Bio-Techne Corporation | 9.4B |
Regeneron ranks 2nd among its competitors, holding 68% of the market cap of the leader, Vertex. It stands above both the average market cap of the top 10 (47.5B) and the sector median (19.9B). The company enjoys a significant 46.5% market cap lead over its next closest rival, Incyte.
Comparisons with competitors
Check out how we compare the company to its competitors:
Does REGN have a competitive advantage?
Regeneron Pharmaceuticals presents a competitive advantage, evidenced by its ROIC exceeding WACC by 3.5%, indicating value creation despite declining profitability. Its gross margin of 86% and net margin of 31% confirm strong operational efficiency in biotech.
Looking ahead, Regeneron’s diverse product portfolio targets eye diseases, inflammatory, infectious, and rare conditions, supported by partnerships with major pharma firms. This pipeline and global reach offer potential growth avenues amid evolving healthcare needs.
SWOT Analysis
This SWOT analysis highlights Regeneron Pharmaceuticals’ internal capabilities and external challenges to inform strategic decisions.
Strengths
- strong gross margin at 86%
- robust EBIT margin near 37%
- low debt and high interest coverage
Weaknesses
- declining ROIC trend
- weak overall revenue growth over 5 years
- unfavorable current ratio signals liquidity caution
Opportunities
- new product development pipeline
- expanding global market presence
- strategic collaborations with big pharma
Threats
- intense biotech competition
- regulatory risks in drug approvals
- patent expirations impacting revenues
Regeneron shows solid profitability and a strong balance sheet but faces growth headwinds and liquidity signal concerns. Strategic focus must balance innovation and operational efficiency amid competitive and regulatory pressures.
Stock Price Action Analysis
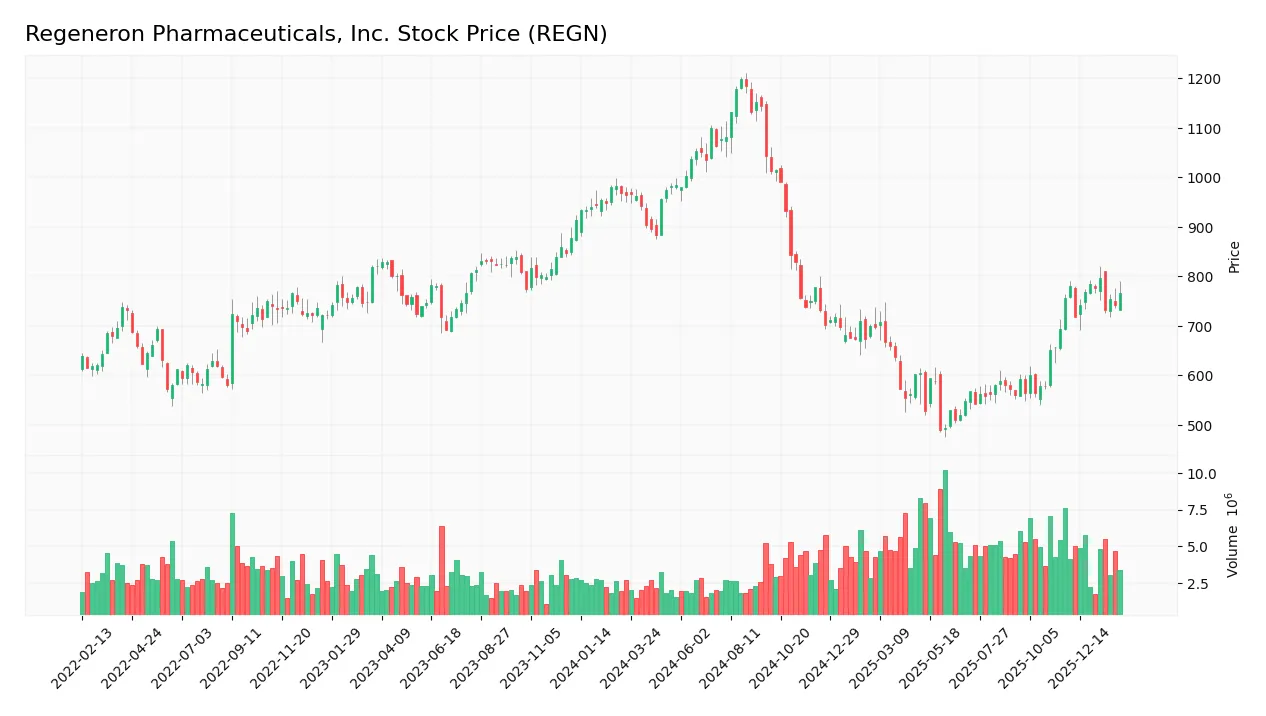
The weekly stock chart below illustrates Regeneron Pharmaceuticals, Inc.’s price movements over the past 12 months, highlighting key volatility and trend shifts:
Trend Analysis
Over the past 12 months, REGN’s stock price declined by 20.51%, indicating a bearish trend with accelerating downward momentum. The stock ranged between a high of 1199.12 and a low of 490.28, reflecting significant volatility with a standard deviation of 199.21.
Volume Analysis
Trading volume has increased overall, with buyers accounting for 52.23% of total activity. In the recent three-month period, buyer dominance rose to 68%, signaling stronger buying interest and increased market participation. This buyer-driven volume suggests improving investor sentiment.
Target Prices
Analysts present a bullish consensus on Regeneron Pharmaceuticals, reflecting strong growth expectations.
| Target Low | Target High | Consensus |
|---|---|---|
| 700 | 1,057 | 851.06 |
The target range spans from 700 to 1,057, with a consensus near 851, indicating confidence in Regeneron’s long-term value creation.

Don’t Let Luck Decide Your Entry Point
Optimize your entry points with our advanced ProRealTime indicators. You’ll get efficient buy signals with precise price targets for maximum performance. Start outperforming now!
Analyst & Consumer Opinions
This section examines Regeneron Pharmaceuticals, Inc.’s analyst grades and consumer feedback to provide balanced insights.
Stock Grades
Here are the latest verified grades from leading financial institutions for Regeneron Pharmaceuticals, Inc.:
| Grading Company | Action | New Grade | Date |
|---|---|---|---|
| JP Morgan | Maintain | Overweight | 2026-02-02 |
| Cantor Fitzgerald | Maintain | Overweight | 2026-02-02 |
| Wells Fargo | Maintain | Equal Weight | 2026-02-02 |
| Morgan Stanley | Maintain | Equal Weight | 2026-02-02 |
| Oppenheimer | Maintain | Outperform | 2026-02-02 |
| Truist Securities | Maintain | Buy | 2026-02-02 |
| Evercore ISI Group | Maintain | Outperform | 2026-01-22 |
| Truist Securities | Maintain | Buy | 2026-01-08 |
| B of A Securities | Upgrade | Buy | 2026-01-07 |
| Morgan Stanley | Maintain | Equal Weight | 2025-12-12 |
The consensus reflects a solid buy sentiment, with several upgrades and consistent maintenance of overweight or outperform ratings. The grades indicate confidence in Regeneron’s outlook across top-tier firms.
Consumer Opinions
Regeneron Pharmaceuticals sparks strong reactions from its user base, reflecting both its innovation prowess and areas needing improvement.
| Positive Reviews | Negative Reviews |
|---|---|
| “Cutting-edge treatments with noticeable results.” | “High medication costs limit accessibility.” |
| “Responsive customer support and clear communication.” | “Side effects took longer to subside than expected.” |
| “Consistent product quality and reliability.” | “Complex insurance processes cause delays.” |
Overall, consumers praise Regeneron for its innovative therapies and quality. However, cost and insurance hurdles remain consistent concerns, potentially limiting broader patient access.
Risk Analysis
Below is a table summarizing key risks facing Regeneron Pharmaceuticals, Inc., ranked by likelihood and potential impact:
| Category | Description | Probability | Impact |
|---|---|---|---|
| Regulatory Risk | Changes in drug approval processes or patent litigations could delay product launches. | Medium | High |
| Competition Risk | Intense competition from biotech peers and generics may erode market share and pricing power. | High | Medium |
| R&D Risk | Failure or delay in clinical trials could impair pipeline and future revenues. | Medium | High |
| Market Volatility | Stock price sensitivity is low (beta 0.41), but biotech sector swings can affect valuation. | Medium | Medium |
| Operational Risk | Supply chain disruptions or manufacturing issues could impact product availability. | Low | Medium |
| Financial Risk | Strong liquidity (current ratio 4.77) yet asset turnover is low (0.35), potentially signaling inefficient asset use. | Low | Low |
The most significant risks stem from regulatory hurdles and R&D outcomes. These directly affect Regeneron’s ability to sustain growth amid fierce competition. The company’s strong balance sheet and low debt provide a buffer, but investors should monitor clinical trial progress closely.
Should You Buy Regeneron Pharmaceuticals, Inc.?
Regeneron appears to be a profitable company with a slightly favorable moat, indicating value creation despite declining returns on invested capital. Its leverage profile seems manageable, and the overall rating of A suggests a very favorable investment profile, balanced by moderate valuation risks.
Strength & Efficiency Pillars
Regeneron Pharmaceuticals, Inc. demonstrates robust profitability with a net margin of 31.41% and a return on equity of 14.41%. Its return on invested capital (ROIC) stands at 9.16%, comfortably above its weighted average cost of capital (WACC) of 5.62%, marking it clearly as a value creator. The company’s Altman Z-Score of 7.77 confirms strong financial health, safely in the “safe zone.” A Piotroski score of 6 indicates average but stable financial strength. These metrics reflect disciplined capital allocation and operational efficiency.
Weaknesses and Drawbacks
Despite strengths, Regeneron faces some headwinds. The current ratio of 4.77 signals potentially excessive liquidity, which could imply inefficient asset use. Asset turnover is low at 0.35, suggesting underutilization of assets to generate revenue. Valuation multiples are moderate, with a price-to-earnings ratio of 17.92 and price-to-book at 2.58, which might reflect fair but not compelling valuation. Dividend yield is weak at 0.46%, limiting income appeal. The overall stock trend remains bearish, with a 20.51% price decline, although recent buyer dominance suggests some recovery.
Our Verdict about Regeneron Pharmaceuticals, Inc.
Regeneron presents a fundamentally favorable long-term profile as a value creator with solid profitability and financial stability. The recent bullish buyer dominance, coupled with a moderate uptick in price, suggests emerging investor interest. This profile might appear attractive for investors seeking exposure to a financially sound biotech firm, but the ongoing bearish trend advises caution. A measured, patient approach could be prudent to capture potential upside while managing risk.
Disclaimer: This content is for informational purposes only and does not constitute financial, investment, or other professional advice. Investing in financial markets involves a significant risk of loss, and past performance is not indicative of future results.
Additional Resources
- Bronte Capital Management Pty Ltd. Trims Stock Holdings in Regeneron Pharmaceuticals, Inc. $REGN – MarketBeat (Feb 05, 2026)
- Regeneron Pharmaceuticals, Inc. (REGN): A Bull Case Theory – Finviz (Feb 04, 2026)
- Regeneron Pharmaceuticals, Inc. (REGN) Posts Q4 Earnings Beat, EPS Shines – Yahoo Finance (Jan 31, 2026)
- Decoding Regeneron Pharmaceuticals Inc (REGN): A Strategic SWOT Insight – GuruFocus (Feb 05, 2026)
- REGENERON PHARMACEUTICALS, INC. SEC 10-K Report – TradingView (Feb 04, 2026)
For more information about Regeneron Pharmaceuticals, Inc., please visit the official website: regeneron.com