Home > Analyses > Real Estate > Regency Centers Corporation
Regency Centers Corporation transforms everyday shopping into vibrant community experiences. As a leading REIT in retail, it owns and manages premier shopping centers anchored by top grocers and service providers. Known for its strategic locations and tenant quality, Regency blends innovation with stable income generation. As market dynamics shift, I question whether Regency’s solid fundamentals continue to warrant its premium valuation and growth prospects in 2026.

Table of contents
Business Model & Company Overview
Regency Centers Corporation, founded in 1993 and headquartered in Jacksonville, FL, dominates as a preeminent national owner and operator of shopping centers. Its portfolio thrives on a cohesive ecosystem of grocers, restaurants, service providers, and premier retailers. These properties serve affluent, densely populated trade areas, forging strong community connections and delivering consistent consumer traffic.
The company’s revenue engine balances rental income from retail tenants across the Americas, including key urban markets. As a self-managed, fully integrated REIT and S&P 500 member, Regency leverages recurring leases to generate stable cash flows. Its competitive advantage lies in owning high-quality centers that anchor vibrant neighborhoods, securing long-term economic moats and shaping the retail real estate landscape.
Financial Performance & Fundamental Metrics
I will analyze Regency Centers Corporation’s income statement, financial ratios, and dividend payout policy to assess its core financial health and shareholder value.
Income Statement
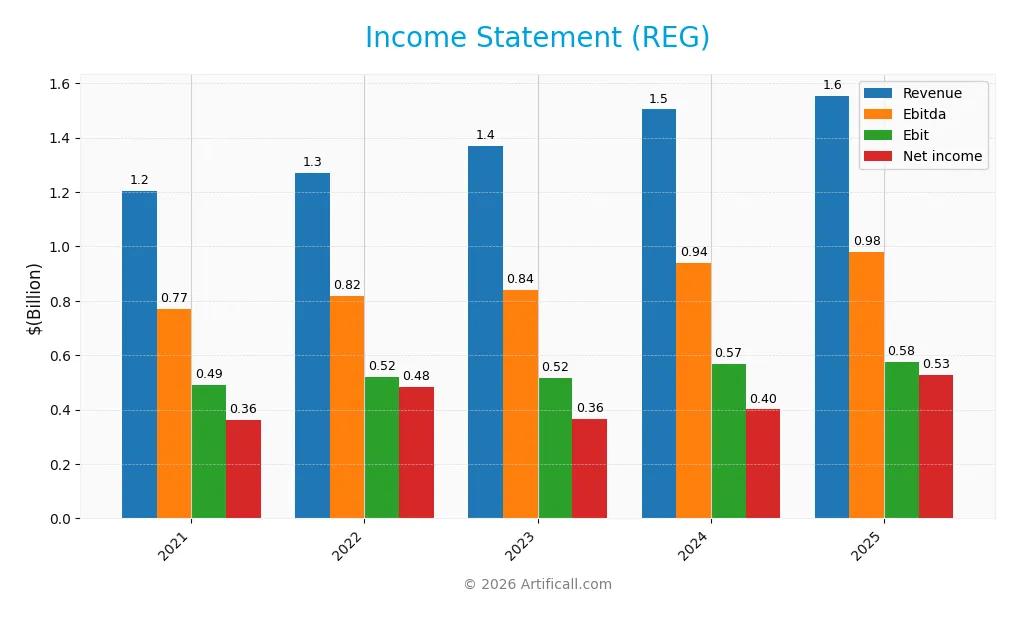
Below is the Regency Centers Corporation income statement summary for fiscal years 2021 through 2025, outlining key financial performance metrics.
| 2021 | 2022 | 2023 | 2024 | 2025 | |
|---|---|---|---|---|---|
| Revenue | 1.20B | 1.27B | 1.37B | 1.50B | 1.55B |
| Cost of Revenue | 327M | 346M | 395M | 433M | 860M |
| Operating Expenses | 78M | 80M | 98M | 101M | 119M |
| Gross Profit | 877M | 925M | 975M | 1.07B | 694M |
| EBITDA | 771M | 818M | 840M | 940M | 981M |
| EBIT | 491M | 519M | 516M | 568M | 576M |
| Interest Expense | 145M | 146M | 156M | 189M | 59M |
| Net Income | 361M | 483M | 365M | 400M | 527M |
| EPS | 2.12 | 2.82 | 2.04 | 2.12 | 2.79 |
| Filing Date | 2022-02-17 | 2023-02-17 | 2024-02-16 | 2025-02-14 | 2026-02-13 |
Income Statement Evolution
Regency Centers Corporation’s revenue rose 29.1% from 2021 to 2025, with a modest 3.4% increase in the last year. Despite a 35.1% drop in gross profit growth in 2025, net income climbed 45.9% over five years and surged 27.4% last year. Margins improved overall, with the net margin increasing 13.1% across the period.
Is the Income Statement Favorable?
The 2025 income statement shows favorable fundamentals. Gross margin stands at 44.7%, and net margin is a strong 33.9%. EBIT margin of 37.0% and interest expense at 3.8% indicate efficient cost management. Earnings per share grew 33.7% year-over-year, reflecting robust profitability despite mixed revenue growth signals.
Financial Ratios
The following table presents key financial ratios for Regency Centers Corporation across recent fiscal years, facilitating year-over-year comparison:
| Ratios | 2021 | 2022 | 2023 | 2024 | 2025 |
|---|---|---|---|---|---|
| Net Margin | 30.0% | 38.0% | 26.6% | 26.6% | 33.9% |
| ROE | 6.0% | 7.9% | 5.2% | 6.0% | 7.6% |
| ROIC | 7.6% | 8.0% | 7.3% | 8.0% | 178.5% |
| P/E | 35.5 | 22.2 | 32.8 | 35.0 | 24.8 |
| P/B | 2.13 | 1.76 | 1.70 | 2.09 | 1.89 |
| Current Ratio | 0.85 | 0.81 | 0.64 | 0.73 | 0.33 |
| Quick Ratio | 0.85 | 0.81 | 0.64 | 0.73 | 0.33 |
| D/E | 0.71 | 0.70 | 0.68 | 0.75 | 0.86 |
| Debt-to-Assets | 39.8% | 39.5% | 38.6% | 40.5% | 45.7% |
| Interest Coverage | 5.50 | 5.78 | 5.63 | 5.13 | 9.82 |
| Asset Turnover | 0.11 | 0.12 | 0.11 | 0.12 | 0.12 |
| Fixed Asset Turnover | 4.21 | 4.52 | 4.09 | 4.55 | 4.92 |
| Dividend Yield | 3.14% | 3.99% | 3.81% | 3.59% | 0.01% |
Evolution of Financial Ratios
Return on Equity (ROE) declined from 7.92% in 2022 to 7.64% in 2025, signaling slower growth in shareholder profitability. The Current Ratio steadily dropped from 0.81 in 2022 to a low 0.33 in 2025, indicating weakening liquidity. Conversely, the Debt-to-Equity Ratio increased moderately, stabilizing near 0.86, reflecting a cautious rise in leverage.
Are the Financial Ratios Favorable?
In 2025, profitability metrics show mixed signals: net margin is favorable at 33.94%, but a low ROE of 7.64% is unfavorable relative to typical S&P 500 averages above 12%. Liquidity ratios are weak, with both current and quick ratios at 0.33. Leverage is neutral, with a debt-to-equity ratio of 0.86 and a solid interest coverage ratio near 9.8. Asset turnover is low at 0.12, while fixed asset turnover remains favorable at 4.92. Dividend yield at 0.01% is notably unfavorable. Overall, ratios present a neutral profile with balanced favorable and unfavorable factors.
Shareholder Return Policy
Regency Centers Corporation maintains a very low dividend payout ratio of 0.26% in 2025, with a dividend per share of $0.0073 and an annual yield near 0.01%. The company engages in share buybacks, supporting shareholder returns alongside minimal dividend distributions.
The payout ratio’s sharp decline from previous years suggests a conservative approach, likely preserving free cash flow given zero capital expenditures. This restrained distribution aligns with prudent capital allocation, potentially sustaining long-term shareholder value amid the firm’s operational and financial metrics.
Score analysis
The following radar chart presents Regency Centers Corporation’s key financial scores for a quick comparative view:
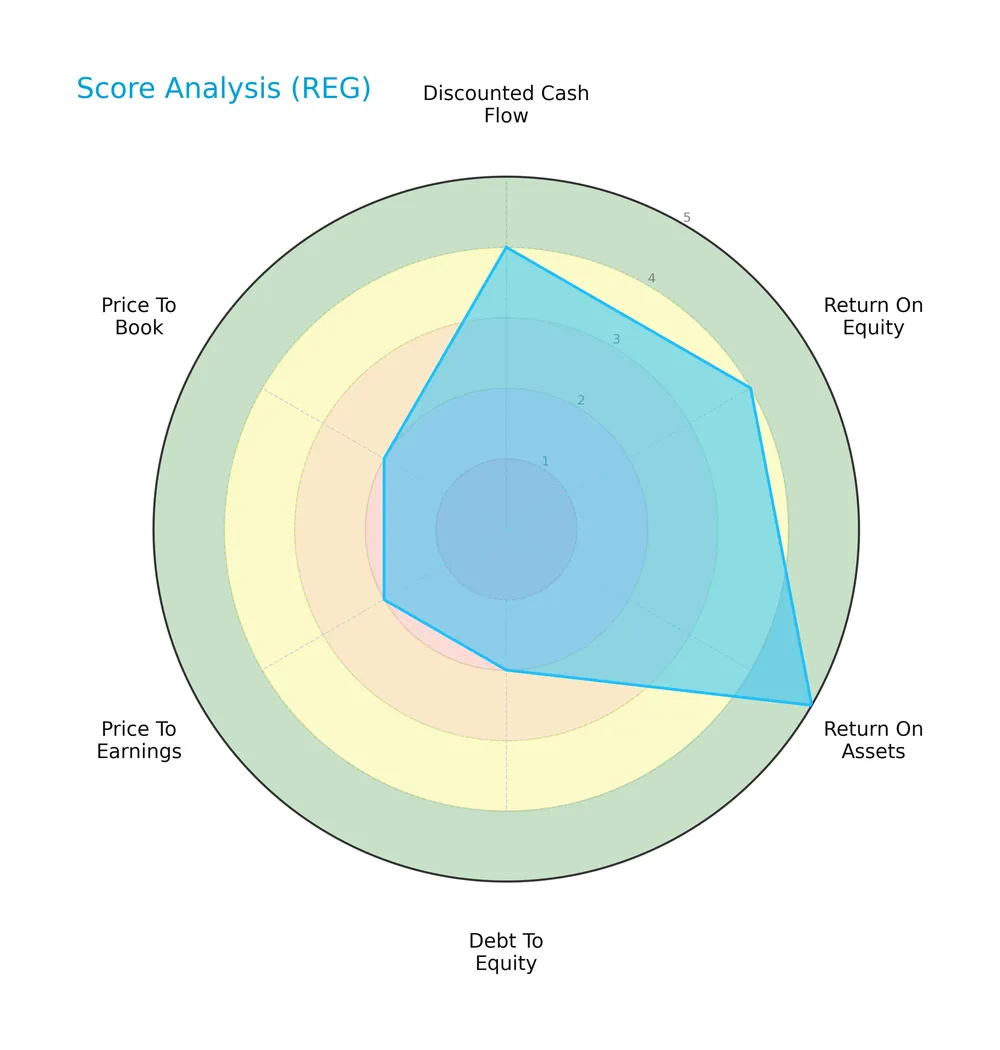
Regency scores well on discounted cash flow, return on equity, and return on assets, reflecting solid profitability and valuation fundamentals. However, debt-to-equity, price-to-earnings, and price-to-book ratios are weaker, indicating some financial leverage and valuation concerns.
Analysis of the company’s bankruptcy risk
Regency Centers Corporation’s Altman Z-Score places it in the distress zone, signaling a higher risk of financial distress and possible bankruptcy:

Is the company in good financial health?
The Piotroski Score diagram outlines Regency Centers Corporation’s financial strength based on nine fundamental criteria:

With a Piotroski Score of 5, Regency demonstrates average financial health, suggesting moderate operational efficiency and profitability but room for improvement relative to stronger peers.
Competitive Landscape & Sector Positioning
This section examines Regency Centers Corporation’s sector positioning, revenue streams, product mix, and main competitors. I will assess whether Regency holds a competitive advantage within the retail REIT industry.
Strategic Positioning
Regency Centers focuses on retail REIT operations within affluent, densely populated U.S. markets. Its revenue streams concentrate on property management (14M in 2023) and asset-related services, reflecting a specialized, vertically integrated model rather than broad diversification across sectors or geographies.
Revenue by Segment
The pie chart illustrates Regency Centers Corporation’s revenue distribution by segment for the fiscal year 2023, providing insight into the company’s income sources and operational focus.
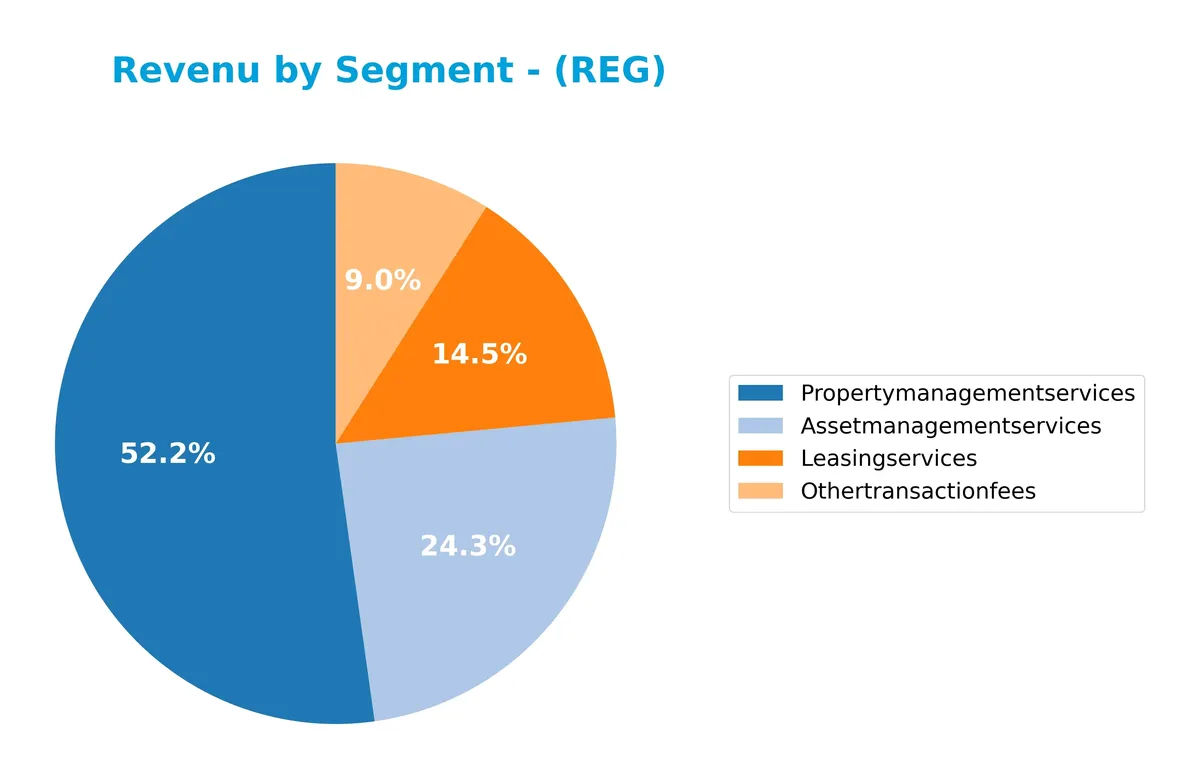
In 2023, property management services dominated with $14.1M, followed by asset management services at $6.5M. Leasing services and other transaction fees contributed $3.9M and $2.4M, respectively. Compared to prior years, property management remains the core driver, showing steady strength. Other segments show slight declines or flat trends, suggesting a concentrated revenue base with moderate risk from segment dependency.
Key Products & Brands
Regency Centers Corporation generates revenue from a variety of real estate services focused on retail properties:
| Product | Description |
|---|---|
| Property Management Services | Managing and operating shopping centers, generating the largest portion of the company’s revenue. |
| Asset Management Services | Overseeing investment assets and maximizing returns for stakeholders. |
| Leasing Services | Facilitating tenant leasing agreements across the retail portfolio. |
| Other Transaction Fees | Income from miscellaneous fees related to property transactions and services. |
Regency Centers relies heavily on property management as its core revenue driver, complemented by asset and leasing services. Other transaction fees contribute a smaller, yet notable, portion of the total income.
Main Competitors
Regency Centers Corporation competes with a total of 5 key players, here are the top 10 leaders by market capitalization:
| Competitor | Market Cap. |
|---|---|
| Simon Property Group, Inc. | 60B |
| Realty Income Corporation | 53B |
| Kimco Realty Corporation | 13.6B |
| Regency Centers Corporation | 12.3B |
| Federal Realty Investment Trust | 8.5B |
Regency ranks 4th among its competitors with a market cap about 23% of the leader, Simon Property Group. It sits below the average market cap of the top 10 (29.4B) but above the sector median (13.6B). Regency is closely positioned to Kimco Realty, trailing by approximately 2.5%, while significantly ahead of Federal Realty by 63%.
Comparisons with competitors
Check out how we compare the company to its competitors:
Does REG have a competitive advantage?
Regency Centers Corporation presents a sustainable competitive advantage, evidenced by a very favorable moat rating and a ROIC exceeding its WACC by 172%. This indicates efficient capital use and strong value creation over 2021-2025.
Looking ahead, Regency’s focus on affluent, densely populated retail centers supports opportunities for growth. The company’s integrated operations and high-quality tenant mix position it well to capitalize on evolving market demands.
SWOT Analysis
This SWOT analysis highlights Regency Centers Corporation’s core competitive position and strategic risks.
Strengths
- strong portfolio in affluent, dense trade areas
- very favorable moat with growing ROIC
- solid net margin of 33.94%
Weaknesses
- low current and quick ratios at 0.33 signal liquidity risk
- moderate ROE at 7.64% below industry peers
- Altman Z-score in distress zone indicates financial vulnerability
Opportunities
- expansion into new retail formats
- capitalize on strong community connections
- leverage self-management for operational agility
Threats
- rising interest rates impacting debt costs
- retail sector disruption from e-commerce
- competitive pressure from other REITs and developers
Regency’s durable competitive advantages and attractive margins underpin a resilient business model. However, liquidity concerns and financial distress signals require cautious capital management. Growth strategies should focus on leveraging community ties while mitigating sector headwinds.
Stock Price Action Analysis
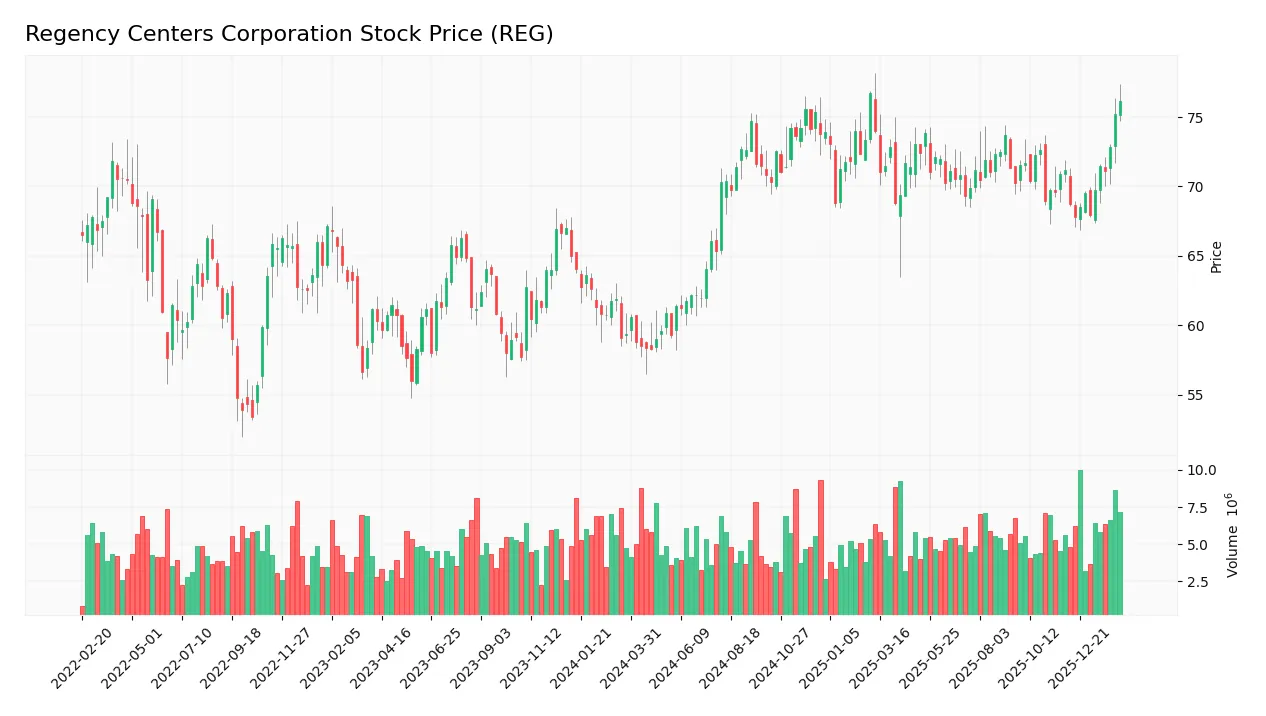
The weekly stock chart highlights Regency Centers Corporation’s price movements and volatility over the past 100 weeks:
Trend Analysis
Over the past 100 weeks, REG’s stock price rose 28.38%, indicating a bullish trend with clear acceleration. The price fluctuated between a low of 58.28 and a high of 76.7, supported by a volatility measure (std deviation) of 4.64. The recent 11-week period shows a continued uptrend with a 7.05% gain and moderate volatility.
Volume Analysis
Trading volume for REG is increasing, with buyer volume consistently outpacing seller volume. Over the last three months, buyers dominated 71.79% of activity, signaling strong buyer interest and robust market participation, reinforcing positive sentiment around the stock.
Target Prices
Analysts set a consensus target price signaling moderate upside potential for Regency Centers Corporation.
| Target Low | Target High | Consensus |
|---|---|---|
| 74 | 85 | 80.3 |
The target range from $74 to $85 reflects cautious optimism, with a consensus near $80 indicating steady growth expectations.

Don’t Let Luck Decide Your Entry Point
Optimize your entry points with our advanced ProRealTime indicators. You’ll get efficient buy signals with precise price targets for maximum performance. Start outperforming now!
Analyst & Consumer Opinions
This section examines the latest analyst grades and consumer feedback related to Regency Centers Corporation (REG) performance.
Stock Grades
Here are the latest verified stock grades for Regency Centers Corporation from top-tier financial institutions:
| Grading Company | Action | New Grade | Date |
|---|---|---|---|
| Citigroup | Maintain | Neutral | 2026-02-10 |
| Scotiabank | Maintain | Sector Perform | 2026-01-14 |
| Mizuho | Downgrade | Neutral | 2026-01-09 |
| UBS | Maintain | Neutral | 2026-01-08 |
| JP Morgan | Downgrade | Neutral | 2025-12-18 |
| Keybanc | Downgrade | Sector Weight | 2025-12-04 |
| Truist Securities | Maintain | Buy | 2025-11-18 |
| Barclays | Upgrade | Overweight | 2025-11-18 |
| Scotiabank | Maintain | Sector Perform | 2025-11-13 |
| Wells Fargo | Maintain | Overweight | 2025-10-21 |
The grades show a recent shift toward more cautious views, with several downgrades from overweight and outperform to neutral or sector weight. However, buy ratings still outnumber sell calls, reflecting mixed but generally positive sentiment.
Consumer Opinions
Regency Centers Corporation enjoys a generally favorable reputation among consumers, reflecting its strong presence in retail real estate.
| Positive Reviews | Negative Reviews |
|---|---|
| Well-maintained properties with clean facilities | Some locations experience parking shortages |
| Convenient store mix tailored to community needs | Occasional delays in maintenance response times |
| Friendly and helpful onsite management staff | Limited dining options in certain shopping centers |
Consumers consistently praise Regency’s property upkeep and location strategy. However, parking constraints and sporadic maintenance delays slightly dampen the overall experience. The company’s responsiveness to these issues will be key to maintaining its strong consumer goodwill.
Risk Analysis
The following table summarizes key risks Regency Centers Corporation faces, highlighting their likelihood and potential impact:
| Category | Description | Probability | Impact |
|---|---|---|---|
| Liquidity Risk | Current and quick ratios at 0.33 signal tight liquidity and potential cash flow issues. | High | High |
| Financial Distress | Altman Z-Score of 1.52 places REG in the distress zone, indicating bankruptcy risk. | Moderate | Very High |
| Market Risk | Beta of 0.94 shows slightly less volatility than the market but still exposed to economic cycles. | Moderate | Medium |
| Leverage Risk | Debt-to-assets at 45.7% and D/E ratio of 0.86 suggest moderate leverage exposure. | Moderate | Medium |
| Dividend Risk | Extremely low dividend yield of 0.01% could disappoint income-focused investors. | Low | Low |
| Operational Risk | Unfavorable asset turnover (0.12) points to inefficiencies in asset use. | Moderate | Medium |
I emphasize liquidity and financial distress risks as most urgent. The low current ratio is a red flag in retail REITs, where steady cash flow is critical. REG’s Altman Z-Score in the distress zone signals caution despite strong ROIC. Market cyclicality and leverage add moderate risk. Investors must weigh these against REG’s solid portfolio and S&P 500 membership.
Should You Buy Regency Centers Corporation?
Regency Centers appears to be delivering improving operational efficiency with a durable competitive moat supported by strong value creation. However, its substantial leverage profile and distress-zone Altman Z-score suggest caution. The overall B+ rating reflects a balanced but moderate risk-return profile.
Strength & Efficiency Pillars
Regency Centers Corporation posts robust operational margins, including a net margin of 33.94% and an EBIT margin of 37.03%. Its return on invested capital (ROIC) stands exceptionally high at 178.49%, well above the weighted average cost of capital (WACC) at 6.71%, marking it as a clear value creator. Despite a modest return on equity of 7.64%, the company demonstrates increasing profitability and operational efficiency, supported by a favorable interest coverage ratio of 9.82.
Weaknesses and Drawbacks
Regency faces significant financial distress, reflected by an Altman Z-Score of 1.52, placing it firmly in the distress zone and signaling a heightened bankruptcy risk. Liquidity is a critical concern, with a current ratio of just 0.33, indicating potential difficulty covering short-term obligations. Valuation metrics remain mixed, with a neutral P/E of 24.78 and P/B of 1.89, which do not offer a clear margin of safety. The debt-to-equity ratio of 0.86 is moderate but adds to solvency concerns given the overall financial instability.
Our Final Verdict about Regency Centers Corporation
Despite strong operational profitability and a compelling ROIC profile, Regency’s financial distress as indicated by its low Altman Z-Score makes it a highly speculative investment. The solvency risk overshadows its efficiency strengths, suggesting the stock may be too risky for conservative capital. Investors might consider waiting for clearer signs of financial stabilization before committing to this profile.
Disclaimer: This content is for informational purposes only and does not constitute financial, investment, or other professional advice. Investing in financial markets involves a significant risk of loss, and past performance is not indicative of future results.
Additional Resources
- Impax Asset Management Group plc Acquires Shares of 14,896 Regency Centers Corporation $REG – MarketBeat (Feb 13, 2026)
- Regency Centers Corporation (REG) Highlights Resilient Retail Fundamentals and Long-Term Growth Strategy – Finviz (Feb 10, 2026)
- REG SEC Filings – Regency Ctrs Corp 10-K, 10-Q, 8-K Forms – Stock Titan (Feb 12, 2026)
- Regency Centers Q4 Update: High Credit Quality, Strong Metrics, And Attractive Preferreds – Seeking Alpha (Feb 10, 2026)
- Roth, Regency Centers COO, sells $616k in stock – Investing.com (Feb 11, 2026)
For more information about Regency Centers Corporation, please visit the official website: regencycenters.com